 Print
PrintBen Burney is Senior Advisor at Exequity LLP. This post is based on an Exequity publication by Mr. Burney. Related research from the Program on Corporate Governance includes: Paying for Long-Term Performance by Lucian Bebchuk and Jesse Fried (discussed on the Forum here).
Over the last several years as compensation committees and executives strive to align pay with shareholder returns, they have increasingly turned to market-based performance measures such as relative total shareholder return [1] (RTSR). Traditionally, RTSR was used primarily by Energy and Utilities companies, largely because these companies’ stock prices tend to be closely correlated, so TSR differences can more confidently be attributed to the success of management’s stewardship. Many companies outside of the Energy and Utilities arena have now adopted RTSR plans: 55% of S&P 500 companies use RTSR in their long-term incentive plans. While, adoption of new RTSR plans has slowed in recent years, it nonetheless continues to inch up in prevalence as companies and compensation committees seek to adjust compensation programs to comply with evolving expectation or respond to dissatisfied shareholders.
Exequity analyzed the key design elements of RTSR programs in an effort to discern how RTSR is being implemented across S&P 500 companies and whether the new entrants to the RTSR fold have designed their plans similarly to the plans traditionally used by Energy or Utilities companies. This is the third year Exequity has reported on RTSR usage and the fifth year we have tracked prevalence across S&P 500 companies. In addition to refreshing the data for 2017, we have included additional thoughts and considerations for decision making on incorporating RTSR into performance plans.
2017 Highlights
Overall, prevalence of RTSR in long-term incentive plans increased 2% to 55%. RTSR as a discrete metric is the most prevalent method, used by 81% of companies, while 19% utilize RTSR as a modifier—the same percentages as in 2016. Among companies employing RTSR as either a metric or modifier, approximately one-half measure RTSR against a custom group of companies, and of those companies, 41% against the same peer group used for benchmarking compensation levels and 59% against a custom performance peer group. The remaining half measure RTSR against a pre-defined set of peers determined by a third party (e.g., a stock index such as the S&P 500), and of those companies, 48% of companies use a multi-sector index (e.g., the S&P 500) and 52% a single-sector index—an increase from 2016 of 4% for more focused, single-sector index peer groups. The S&P 500 is used by 23% of companies using RTSR—a decrease of 2% from 2016.
Prevalence
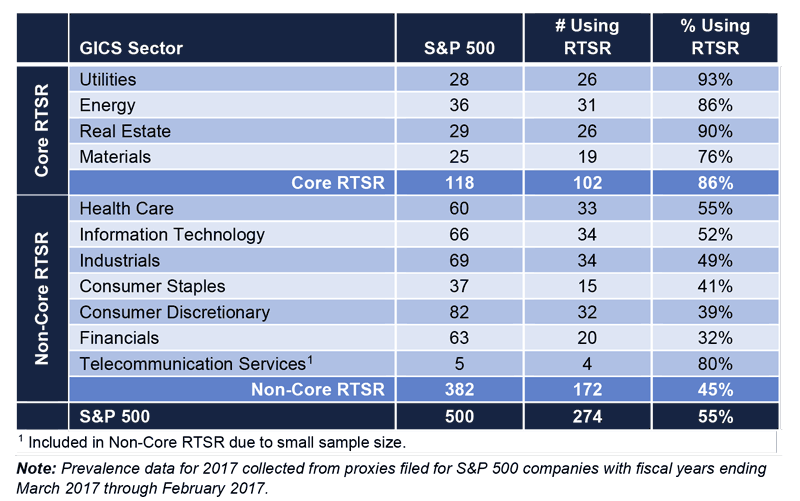
Energy and Utilities companies continue to be the primary users of RTSR across the S&P 500, with 86% of Energy and 93% of Utilities companies using RTSR. Of the remaining industries with 20 or more companies in the S&P 500, Materials and Real Estate companies are the only other sectors with 60% or higher RTSR prevalence (76% and 90% respectively). Within each of these high-prevalence sectors, companies tend to face similar commodity price pressures or economic similarities, potentially rendering RTSR a more reliable method for identifying financial and operational outperformance via market performance. (We refer to Energy, Materials, Real Estate, and Utilities companies collectively as the Core group of RTSR users, while the remaining companies we refer to as Non-Core.)
We note that Non-Core RTSR companies generally have lesser (or more diversified) commodity pricing (or other) pressures and tend to use RTSR with roughly one-half the frequency of Core companies. Prevalence among other Non-Core companies is generally within the 40% to 50% range. We would posit that Non-Core companies experience a more diverse array of stock price pressures than do Core companies by virtue of various industry-specific factors that operate as independent variables, from raw materials and transportation costs to consumer preferences. [2] It appears that industry-specific forces are driving the ways in which RTSR is used in pay programs.
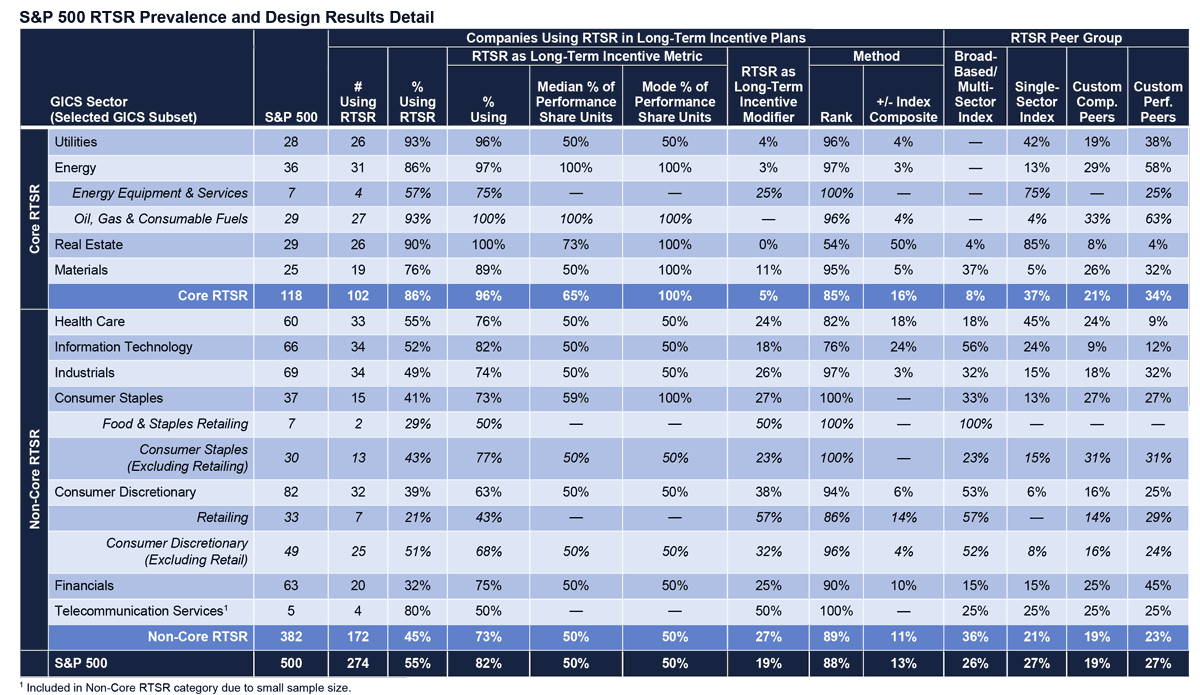
The table below reflects the prevalence of RTSR programs within selected industries:
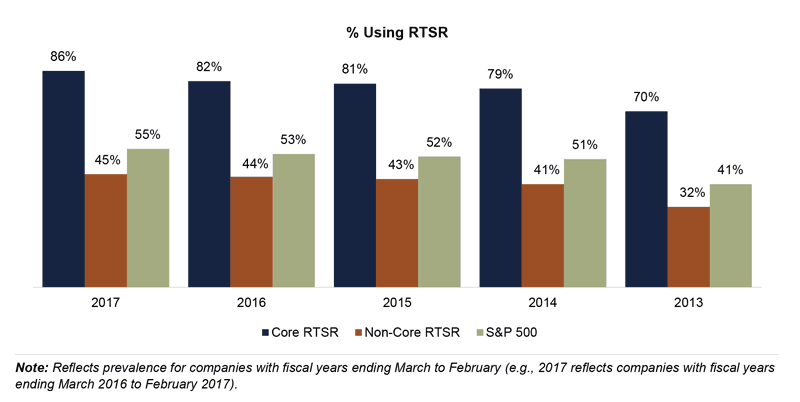
Overall, prevalence of RTSR programs for 2017 is slightly higher than in 2016:
Metric Versus Modifier
Companies typically employ RTSR in one of two ways: as a discrete metric within a performance plan or as a modifier to a financial metric. Used as a discrete metric, RTSR is assigned a weighting within the performance share plan, e.g., a company using RTSR as a discrete metric may weight it 50% and return on capital 50%. As a modifier, RTSR generally adjusts performance plan payouts, which typically measure a non-market metric (e.g., return on capital). In most cases, RTSR modifiers provide for upward or downward adjustment to plan payouts (e.g., a modifier of +/- 25%), though companies may also utilize downward-only or upward-only modifiers.
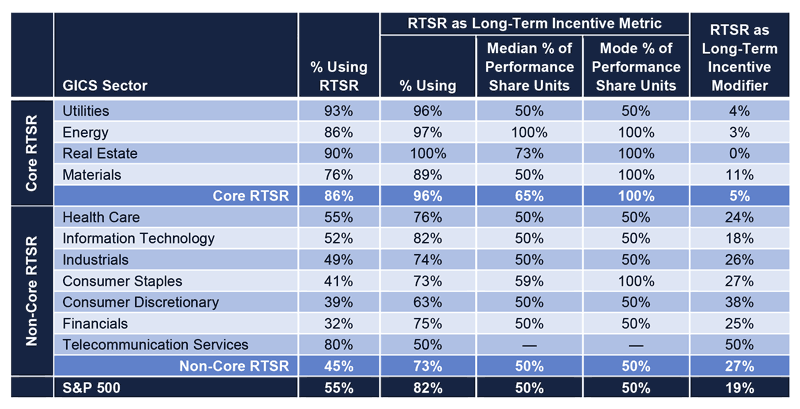
A majority of S&P 500 companies including RTSR in their long-term incentive plans use it as a discrete metric within their performance plans. The most prevalent weighting given to RTSR under performance share plans is 50% and Core companies weight RTSR more heavily than Non-Core companies with 41% of Core companies weighting RTSR at 100% versus 27% for Non-Core companies.
In addition to assigning lower weightings to RTSR, Non-Core companies represent 92% of those using RTSR as a modifier. Among these Non-Core companies, approximately 40% measure performance against the S&P 500, 40% versus a custom compensation or performance peer group, and 20% versus a sector index.
The table below identifies the ways in which RTSR is used within selected industries:
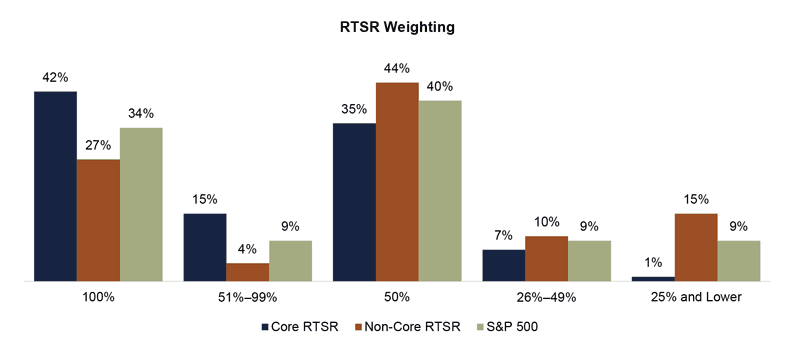
The graph below presents RTSR weightings as a percentage of total performance shares across Core and Non-Core companies:
Peer Group
The selection of an RTSR peer group is a critical factor in the establishment of an RTSR program. Broadly speaking, there are three categories of peer groups used by companies to benchmark RTSR:
- Multi-sector index—a broad-based index comprising multiple sectors such as the S&P 500 or two or more sectors within a broad-based index (e.g., S&P 500 excluding Financials).
- Single-sector index—an index comprising a single sector, such as an S&P sector index or non-S&P index such as the MSCI US REIT Index; other examples include the S&P 500 Utility Index or S&P 1500 Utility Index.
- Custom peer groups—the custom compensation benchmarking peers or custom performance peers.
Across the S&P 500, approximately one-half of companies use a peer group defined by a third party (e.g., S&P 500 or a sector index) and the other half use a customized peer group. Most Core companies (approximately 90%) use a focused peer group to benchmark RTSR by using either a single-sector index or custom group of companies. Notably, few Core companies, other than Materials companies, benchmark RTSR relative to multi-sector indexes. Non-Core companies, but especially consumer-oriented companies, are more likely to use a broad index such as the S&P 500.
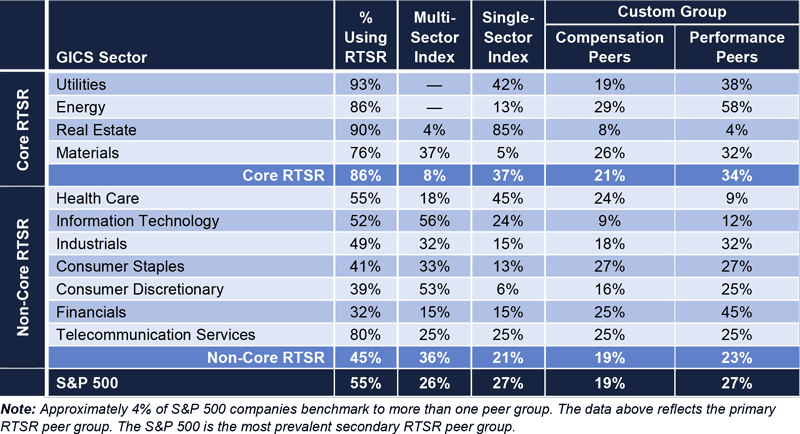
Among Energy companies, a large majority benchmark against custom groups due to the differing impacts oil prices have on companies within various sectors in the overall industry. For example, a rise (or fall) in global oil prices will affect exploration and production companies differently than oil transportation companies or oil refining companies. Because Utilities are not subject to the intra-sector variances that impact Energy companies, they tend to benchmark to a single-sector index group (e.g., S&P 1500 Utilities or the Dow Utilities Index).
Peer group usage among Materials companies is particularly notable. Materials companies often have significant problems setting three-year financial goals due to the impact of commodity prices (or other outside forces), not unlike how Energy companies are impacted by the price of oil. The key difference with Materials versus Energy is the diversity of exogenous factors: Materials companies range from chemicals to paper to metals and mining companies, all serving myriad consumers and companies. This creates a significant challenge for identifying peers. Materials companies employing RTSR handle this challenge by moving to two ends of the RTSR spectrum: highly focused custom peer groups (58%) or a broad index such as the S&P 500 (37%). The inherent dissimilarities among Materials companies is likely why no S&P 500 Materials company benchmarks to the S&P 500 Materials Index companies. [3]
Performance measurement methodology is varied across S&P 500 companies. Most (88%) with RTSR plans use percentile rank or numerical rank methods for benchmarking relative performance. Among these companies, 84% use the percentile rank method, and 16% a numerical rank method. Of those using the numerical rank method, roughly 50% are Energy companies. An alternative to the traditional ranking method is to measure the spread in TSR relative to a defined barometer of performance, such as an index composite or the median TSR of a peer group. A company employing this method compares its TSR to that of the index composite figure and adjusts payouts based on the spread between the two figures. For example, if the company’s TSR is 15% and the index composite TSR is 5%, then the company beat the index by 10 percentage points. Assuming a payout of 2% of each percentile of outperformance, this would yield a 110% payout. This method is used by 13% [4] of S&P 500 companies but is most common among REITs, with roughly 45% measuring RTSR against an index composite figure or peer group median. This method is less than 10% prevalent across non-REIT S&P 500 companies.
Other Design Elements
Pay/Performance Leverage
Unlike other design elements of RTSR plans, pay/performance leverage varies less across industries:

Negative TSR Cap
An increasing number of companies are imposing a “cap” on RTSR payouts when absolute TSR is negative. Compensation committees are increasingly uncomfortable with the possibility of above-target RTSR payouts when shareholder returns over the measurement period are negative. Shareholders and proxy advisors tend to favor capping awards at target when absolute TSR is negative. 20% of S&P 500 companies now disclose caps on RTSR awards, based on the most recent proxy filings as of this publication, but prevalence of negative TSR caps is undoubtedly increasing. 60% of companies employing negative TSR caps are Non-Core companies.
Stock Price Averaging
Since RTSR is a naturally volatile incentive metric, companies commonly employ stock price averaging to smooth out the impact of daily stock price movements on relative performance at the beginning and end of the performance period. Among those companies disclosing averaging periods, approximately 60% use a period of one to four weeks (e.g., 5 trading days to 30 calendar days), with 20 trading or 30 calendar days being the most prevalent periods. Among the remaining companies, 20% use a period of six to ten weeks (e.g., 45 calendar or 30 trading days), and 20% a 90-calendar day period. [5]
Stock price averaging periods are commonly viewed as shareholder-neutral, working neither in favor of nor against executives’ wealth interests. We tested this common perception in 2016 and found that while on average differences are indeed minimal, calculated TSR increasingly deviates from the shareholder experience as averaging periods are extended.
Above-Median Target Performance Percentile
Proxy advisors have subjected RTSR plans to an increased level of scrutiny and occasionally criticized companies for prescribing a target-level payout at median performance. In 2016, ISS went so far as to suggest that targeting median performance may not always be defensible. Despite this ISS criticism, 92% of S&P 500 companies target the peer group median. Among the remaining 8%, 52% target the 60th percentile and 35% the 55th percentile.
Discussion
The rise in RTSR prevalence has many roots, from the impact of say-on-pay to the increasing influence of proxy advisors. Companies finding it challenging to set reasonable long-term goals but feeling pressure by proxy advisors to implement performance-based long-term incentives may turn to RTSR as a non-controversial solution: it demonstrates a commitment to performance-based pay (i.e., “checks the box” for ISS), requires no goal setting (outside of relative ranking), is ostensibly objective, and is intended to align executive wealth with the shareholder experience. However, as a backward-looking metric, RTSR does little to motivate executive behaviors and is often viewed as a “lottery ticket” by participants—especially in instances where peer group companies poorly correlate with the sponsor. Regardless, RTSR is widely perceived as a “shareholder-friendly” metric, as it aligns with relative shareholder returns.
In an effort to assess trends in companies choosing to add RTSR, Exequity reviewed disclosures of companies adding RTSR over the past two years and found mixed results. In several cases, companies added RTSR as a discrete metric or modifier and simultaneously adjusted their long-term incentive mix to include a greater emphasis on performance. In a handful of instances, companies explicitly disclosed that the addition or modification was in response to a lower say-on-pay approval vote and/or negative feedback from ISS. More often, companies tended to offer little insight into their rationale for the change, beyond simply indicating a desire to further align pay programs with shareholder interests. In these latter cases, it’s possible that goal setting was challenging and/or payouts weren’t corresponding with performance perceptions. Companies dropping RTSR disclosed concerns from shareholders over its relevance as a performance measure and/or difficulty identifying a reasonable peer group. RTSR is a performance measure simple to add (to “check the box” for proxy advisors) but challenging to remove.
A viable and reasonable peer group is the most critical factor when determining whether or how to incorporate RTSR into a performance plan. Peer group viability may be determined by measuring similarities in market characteristics between the sponsor and each peer company. By market characteristics, we mean the degree to which the sponsor’s and peers’ stock prices move similarly in direction and magnitude (i.e., highly correlated daily stock price movements and similar volatilities—which may differ from long-term performance). A company’s outperformance of a peer group of highly correlated stocks suggests management’s stewardship resulted in superior TSR. If the sponsor and peers demonstrate dissimilar market characteristics, then RTSR success (or failure) may be attributable more to exogenous factors than management’s stewardship—in other words, if companies are not comparable, then performance outcomes are more likely to result from chance—the antithesis of shareholder-friendly pay-for-performance alignment. [6]
Determination of relative market comparability is difficult to surmise without a rigorous analysis, such as Exequity’s Market Analytics. Analyses conducted by Exequity using Market Analytics demonstrate the historical users of RTSR (Energy and Utilities, but also REITs) tend to exhibit very similar market characteristics while most Non-Core companies tend not to share such similarities. As a result, many Non-Core companies (and also some Materials companies) have a greater difficulty picking relevant, closely correlated peers. This phenomenon is likely at the root of why Non-Core companies use RTSR differently than Core companies—and evidenced by the three trends:
- Non-Core companies are less likely to use RTSR.
- When they do, they are more likely to incorporate RTSR in such a way as to mute its impact on total compensation (RTSR modifier or lower weighting).
- They are more likely to use a broad peer group such as the S&P 500.
The last trend is often rationalized by statements describing performance against a broad range of pre-determined capital competitors of which the sponsor is a member (be it the S&P 500 or a sector within it). The reality is that some companies are pressured into adding RTSR default to the S&P 500 because they are not otherwise able to define a reasonable set of performance peers. Market Analytics outcomes suggest that on average, any single S&P 500 company demonstrates low comparability to the remaining index constituents. In this light, the S&P 500 may be as defensible as any peer set from an external optics perspective, but among the least defensible in terms of performance comparability. For some, use of RTSR may actually run counter to the pay-for-performance philosophy virtually all companies espouse.
From our perspective, RTSR is a metric to be approached with caution. We think companies currently using or contemplating RTSR should consider the approach taken by Core RTSR users, who tend to use focused sets of peers against whom relative performance may be more reliably measured. We would strongly encourage companies to assess their relative market characteristics early on in the process of deciding whether or how to use RTSR or when reviewing the appropriateness of their current RTSR peer groups. Market Analytics helps determine if RTSR is a reasonable metric to use and, if so, which index or peer group of companies can be expected to best measure a company’s relative performance and drive the relative pay-for-performance outcomes shareholders expect.
S&P 500 RTSR Prevalence and Design Results Detail
Endnotes
1Total shareholder return is defined as the change in a company’s stock price plus reinvested dividends.(go back)
2For example, the share price of a health care equipment company reliant upon a certain precious metal (presumably provided by a Materials company) may exhibit sensitivities to the price swings of this commodity, but this will be one of many factors impacting this hypothetical health care company’s share price. The precious metal company’s share price will show much greater—and direct—sensitivity to the same price swings.(go back)
3One company benchmarks to the S&P 1500 Chemicals Index. No others use a single sector index.(go back)
4 One company uses both the percentile rank and TSR spread methods within its performance share plan.(go back)
5Not all companies using averaging periods disclose them in proxy filings.(go back)
6For example, let us assume measurement of relative performance versus the S&P 500: Is it meaningful if a restaurant company outperforms most Utilities? If a retailer outperforms most Energy companies? In our view, the likely answer is “no” in each of these cases.(go back)
