 Print
PrintCharlie Pontrelli is Project Manager at Equilar, Inc. This post is based on an Equilar publication by Mr. Pontrelli, available here. Related research from the Program on Corporate Governance includes: Paying for Long-Term Performance by Lucian Bebchuk and Jesse Fried (discussed on the Forum here); and The Growth of Executive Pay by Lucian Bebchuk and Yaniv Grinstein.
Over the past few years, relative total shareholder return (TSR) has continued to be the most widely used executive long-term incentive (LTI) plan metric, even though its usage is leveling off to some degree at the CEO level as other incentive plan metrics become more popular. That said, due to its clear connection to shareholder value, TSR will likely remain a fixture among executive incentive plans for years to come.
Of course, all uses of relative TSR are not created equal. Because companies are becoming more sophisticated when it comes to their pay design, the ways in which they structure incentive plans is also becoming more varied and complex. This blog aims to take a deeper look at how exactly the metric is being used. The data herein will examine the prevalence of weighted metrics vs. modifiers, performance targets and performance leverages. On the whole, this combination of charts demonstrates the variety of practices when it comes to implementing relative TSR LTI plans. All the data comes from a study of Fortune 100 company incentive plans that Equilar completed this year.
The first analysis looks at whether TSR is most commonly a weighted metric or a modifier. The study also looked at the prevalence of an absolute TSR “modifier cap.” This type of absolute TSR metric is included in the chart below because it is very commonly used in relative TSR plans as well. A typical modifier cap will limit (or cap) the LTI award payout at 100% if absolute TSR is negative. There are a number of other variations that appear as well. See below for a breakdown of the prevalence:
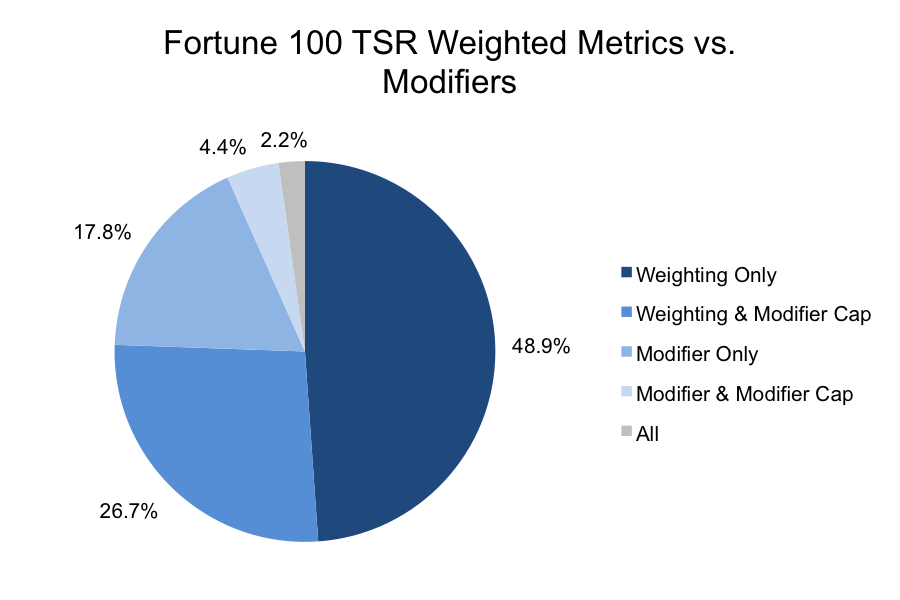
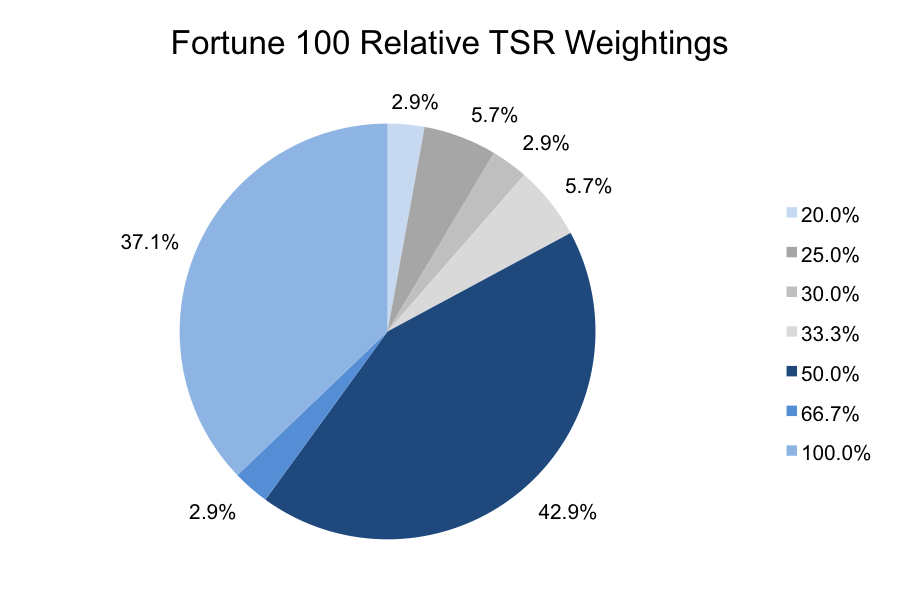
The data can be broken down further to show the relative TSR weightings among the 77.8% of companies that use weighted metrics as seen in the first chart.
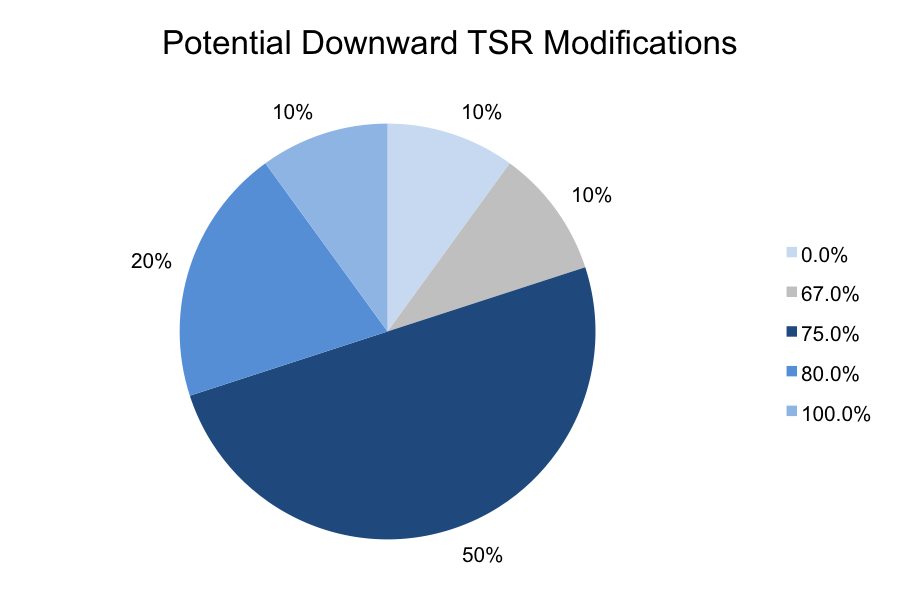
The next two charts show the potential magnitudes that modifiers had in the sample. An award will be adjusted downward for poor performance and upward for good performance. For example, a company that has a relative TSR modifier ranging from 67% to 133% will multiply the award payout by 67% for threshold TSR performance or by 133% for maximum TSR performance.

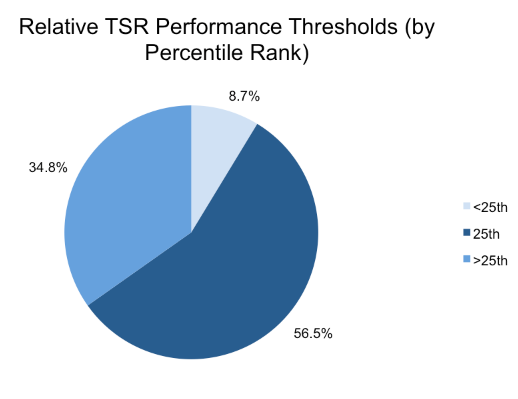
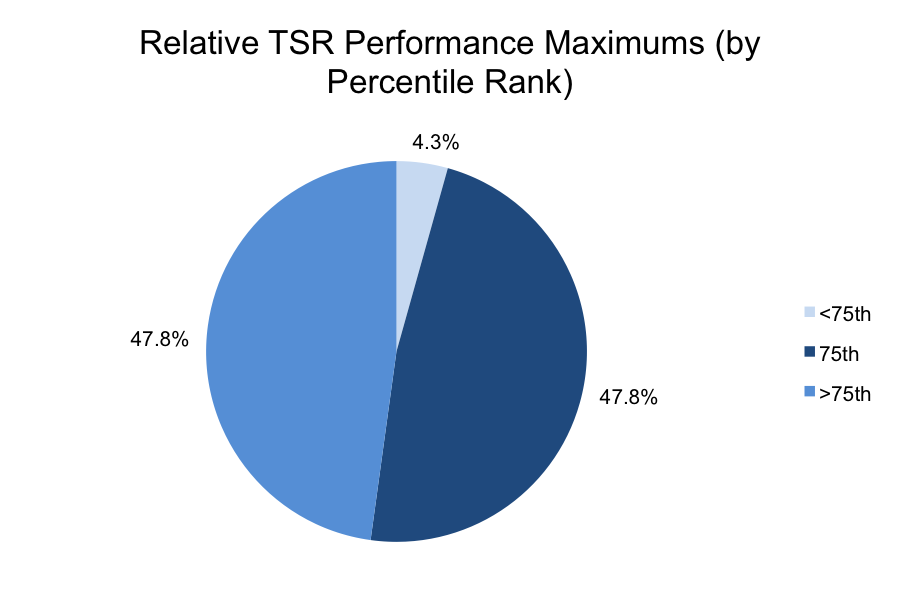
Among weighted metrics, the most typical threshold, target, and maximum performance targets are 25th, 50th, and 75th percentiles respectively. The three charts below note how often companies break from this practice. The 30th and 35th percentiles tied for the second most common threshold, the 55th percentile was the second most common target, and the 90th percentile was the second most common maximum.

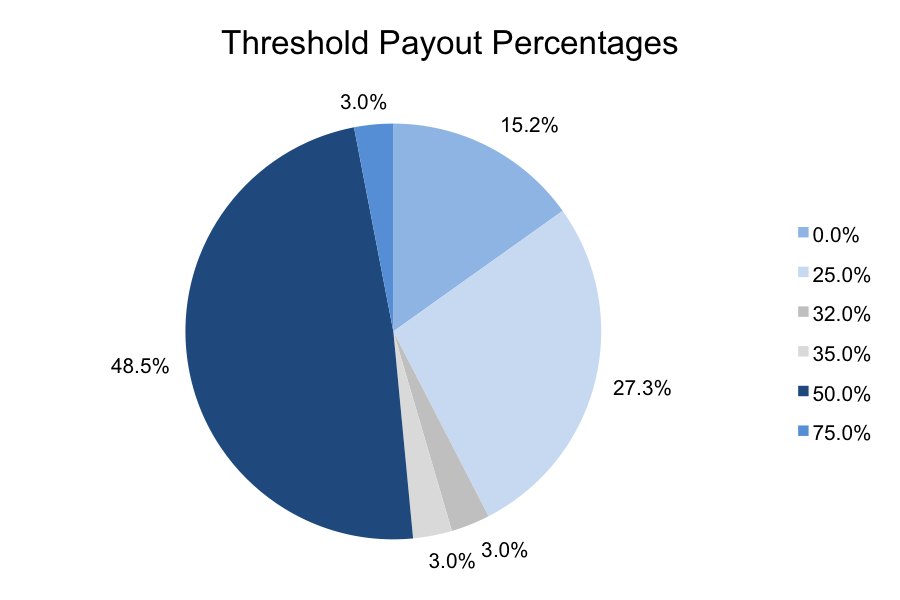
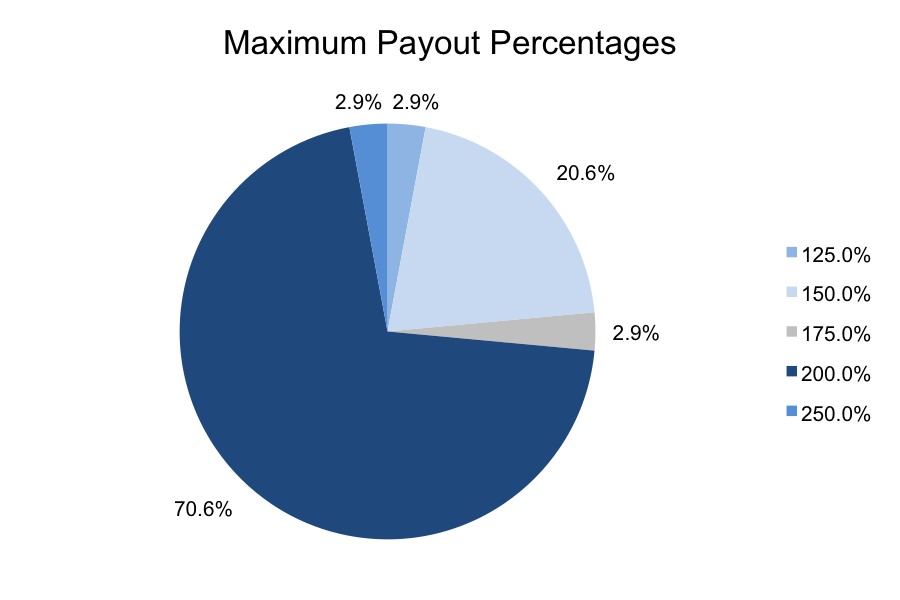
The next charts demonstrate how leveraged TSR plans typically are. The first one shows the payout percentage that is earned when threshold performance is achieved and the second shows the payout percentage earned for maximum performance.
While it would not be surprising to see other metrics continue to surge as part of executive pay plans, TSR is not likely to be eliminated due to its direct tie to investor value. As a result, tracking the nuances and changes to how companies provide performance pay based on this measurement is critical to keeping apprised of best practices.
