 Print
PrintJoseph E. Bachelder is special counsel in the Tax, Employee Benefits & Private Clients practice group at McCarter & English, LLP. The following post is based on a column by Mr. Bachelder which first appeared in the New York Law Journal. Andy Tsang, a senior financial analyst with the firm, assisted in the preparation of this post.
Two ratios often cited to support the argument that CEO pay is too high are:
- the growth rate of CEO pay compared with the growth rate of the stock market; and
- the ratio of CEO pay to average worker pay.
As discussed in this post, these two ratios do not necessarily support the argument that CEO pay is too high. Also, the ratios do not explain underlying factors that cause pay levels to be where they are. Such factors include the competition of major US corporations for a very limited supply of top CEO talent. A recent Rock Center/Stanford Business School report on this subject is noted at the end of today’s column.
Rate of Increase of CEO Pay Compared with Rate of Increase in the Stock Market [1]
On July 20, 2017 the Economic Policy Institute published a report entitled “CEO pay remains high relative to the pay of typical workers and high-wage earners” (the “2017 EPI Report”). It was authored by Lawrence Mishel and Jessica Schieder.
The 2017 EPI Report goes back to 1965. For the period 1965–2015 (approximately 50 years) the cumulative annual growth rate (CAGR) for CEO pay was greater than the CAGR for the stock market.
On the other hand, if one looks at the CAGR in more recent periods (such as from 1995 to 2015), the CAGR for CEO pay has been lower than the CAGR for the stock market. Following is a chart based on the 2017 EPI Report, showing CAGRs for CEO pay at the Top 350 Companies (i.e., the top 350 U.S. companies based on revenues) and the S&P 500 Index for the period 1965–2015 and for the period 1995–2015 (the latter being shown at five-year intervals).
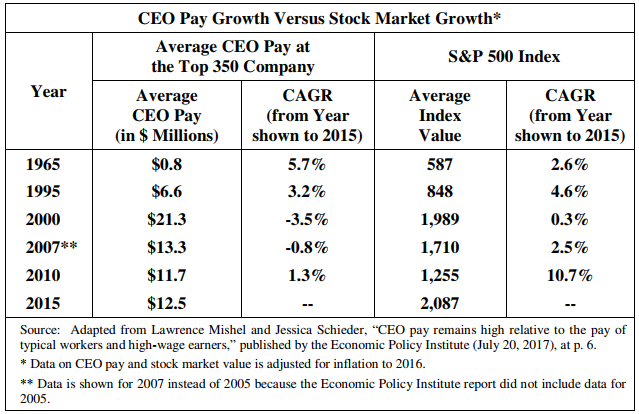
The chart shows that from 1995 through 2015 average CEO pay at top US companies grew at a CAGR of 3.2% compared with a CAGR of 4.6% for the S&P 500 Index. For the period 2010–2015 the CAGR for CEO pay lags significantly behind the CAGR for the S&P 500 Index—1.3% compared to 10.7%.
Why this difference between growth rate from 1965-2015 and the growth rate in more recent years? In 1965, the value of stock-related awards was a significantly smaller component of CEO pay than it became later on. The growth in CEO pay in more recent periods has reflected both the substantial growth in stock market values and the increased portion of CEO pay composed of stock awards.
CEO Pay as a Ratio of Average Worker’s Pay [2]
Based on the same 2017 EPI Report, at the Top 350 Companies in 2015 the multiple of CEO pay to the average worker’s pay in the key industries of the respective companies was 219.7. [3] The following chart displays these ratios over time, based on data contained in the 2017 EPI Report.
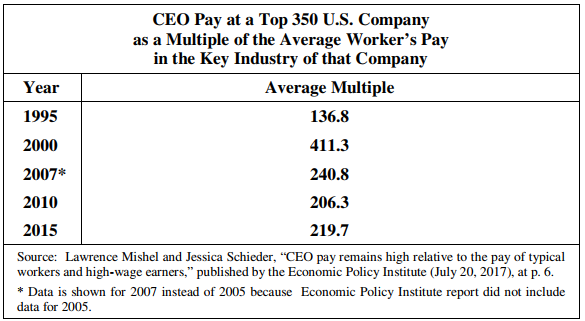
The multiples of CEO pay to average worker’s pay at major U.S. companies reflect, in part, the very different roles of CEOs at major U.S. companies and the roles of the average workers at these companies. CEOs are custodians of the enterprises that they manage on behalf of shareholders whereas the average worker is performing specific duties associated with the specific job being performed.
In a recent issue of the Harvard Business Review, Professor Alex Edmans of the London Business School states that: “CEOs and workers operate in very different markets, so there is no reason for their pay to be linked….” [4] He notes scalability as an important determinant in their jobs: “A CEO’s actions are scalable. For example, if the CEO improves corporate culture, it can be rolled out firm-wide, and thus has a larger effect in a larger firm. One percent is $20 million in a $2 billion firm, but $200 million in a $20 billion firm. In contrast, most employees’ actions are less scalable. An engineer who has the capacity to service 10 machines creates, say, $50,000 of value regardless of whether the firm has 100 or 1,000 machines. In short, CEOs and employees compete in very different markets, one that scales with firm size and one that scales less.”
It is interesting to compare CEO pay as a percentage of assets managed with asset managers’ pay. Following is a chart that shows CEO pay at S&P 500 companies as a percentage of the market cap at those companies.
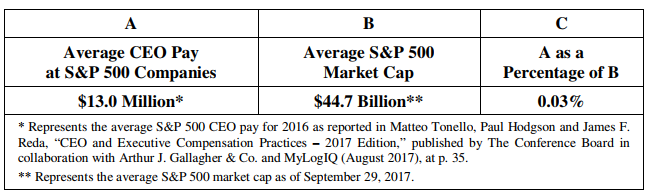
CEO pay, on average, is much less than one percent of the market cap of the company being managed (3/100s of one percent as shown in Column C of the chart). In contrast, the annual fees of an asset manager typically are in the range of 1 to 2% of assets under management (“AUM”). In addition, the asset manager typically receives a percentage of income and/or gain realized on those assets (often called a “Carried Interest”). [5]
The quantitative and qualitative complexities of running a major U.S. company appear to be significantly greater than those of serving as an asset manager. (The author is not denigrating the value of services provided by asset managers but is contrasting pay rates for CEOs and pay rates for asset managers relative to the services they are providing.)
Looking Beyond Ratios: The Competitive Market for CEO Talent
The competitive market for CEOs of major U.S. companies has forced up the level of CEO pay at those companies. Evidence of this pressure is contained in a very recent report published by the Rock Center for Corporate Governance and the Stanford Graduate School of Business. The report is entitled “CEO Talent: America’s Scarcest Resource? 2017 CEO Talent Survey.” [6]
The opening paragraph of the Executive Summary states the issue as follows:
[T]he qualified pool of CEO talent to run the largest publicly traded companies in the United States is incredibly small, according to the directors who sit on the boards of these companies. The average director of a Fortune 250 company estimates that fewer than 4 people—including those both inside and outside their company—would be capable of stepping into the CEO role today and running it at least as well as their current CEO.
The Executive Summary of the Report prefaces its comments with excerpts from responses by two of the 113 directors of Fortune 250 companies surveyed during 2017:
“Talent is scarce, the job is tough, and the runway for success narrower every day.”
“I have never seen the CEO labor market tighter.”
A co-author of the Report, Professor David F. Larcker of the Stanford Graduate School of Business, comments as follows:
Almost across the board, directors of the largest publicly traded U.S. companies believe that the available pool of qualified CEO talent in their industry is small, the issue of ‘fit’ difficult to get right, and the downside risk of making the wrong choice high … These findings have profound implications for talent development and CEO compensation: How you groom senior executives, how you plan for a CEO transition, and how you structure CEO pay really hinge on just how available replacement talent is.
The Rock Center/Stanford Business School Report is important evidence of the upward pressure on CEO pay. The two ratios discussed in today’s column are a reflection of that pressure.
Endnotes
1Reference in this column to CEO pay for a particular year is to compensation comprised of salary paid and annual bonus earned for that year, the award value of long-term stock incentives made during that year (e.g. stock options, stock awards, etc.), long-term cash awards earned in that year and the value of perquisites and benefits received and incremental retirement benefits earned during that year.(go back)
2Under rules adopted by the SEC pursuant to Section 953(b) of the Dodd-Frank law, starting in 2018 most public companies will be required to report in their proxy statements the ratio of the CEO’s pay to that of the median employee at the company reporting. Dodd-Frank Wall Street Reform and Consumer Protection Act of 2010, Public Law No. 111-203, §953(b), 124 Stat. 1376, 1904 (2010), as amended by the Jumpstart Our Business Startups Act (JOBS Act), Public Law No. 112-106, §102(a)(3), 126 Stat. 306, 309 (2012). The SEC regulation adopted pursuant to Dodd-Frank Section 953(b) was published as Pay Ratio Disclosure, SEC Release No. 33-9877 (August 5, 2015), available at https://www.sec.gov/rules/final/2015/33-9877.pdf. 80 Fed. Reg. 50103 (August 18, 2015). See also SEC Interpretive Guidance, entitled “Commission Guidance on Pay Ratio Disclosure,” SEC Release No. 33-10415 (September 21, 2017), available at https://www.sec.gov/rules/interp/2017/33-10415.pdf, and Division of Corporation Finance Guidance on Calculation of Pay Ratio Disclosure (September 21, 2017), available at https://www.sec.gov/corpfin/announcement/guidance-calculation-pay-ratio-disclosure. In a report entitled “A Financial System that Creates Economic Opportunities,” issued October 6, 2017 (see page 29 of the report), the U.S. Department of the Treasury recommends that Dodd-Frank 953(b), containing the pay ratio disclosure requirement, be repealed and that rules issued pursuant to it be withdrawn.(go back)
3The 2017 EPI Report defines average worker’s pay as the average wages and benefits of “production and nonsupervisory” workers in the key industry of the company in question.(go back)
4Alex Edmans, “Why We Need to Stop Obsessing Over CEO Pay Ratios,” Harvard Business Review (February 23, 2017).(go back)
5A fee paid to a large institutional asset manager must, of course, take into account costs such as the staff required, overhead costs including space and other expenses. On the other hand, the 1% (or more) AUM formula (plus Carried Interest) is a formula that applies to asset managers whether they are practicing as individuals with low overhead costs or as entities with large overhead costs.(go back)
6David F. Larcker, Nicholas Donatiello, and Brian Tayan are authors of the report, which was published by the Rock Center for Corporate Governance and the Stanford Graduate School of Business in September 2017.(go back)
