 Print
PrintJohn Roe is Head of ISS Analytics and Managing Director at Institutional Shareholder Services, Inc. This post is based on an ISS publication by Mr. Roe.
As of March 26, ISS Analytics has collected pay data for 661 “same-store” CEOs [1] within the Russell 3000. Same-store CEOs are those in place for each of the most recent full two fiscal years, and were the only CEO at their respective firms. We focus on these CEOs to gauge the sentiment of compensation committees and how their thinking evolves year-over-year, without clouding the issue with payments to executives around employment start or end events and without bespoke multiple-CEO situations.
Buoyed by a strong stock market (leading to higher annual incentive payments) and more generous stock awards, CEOs across every market capitalization range saw some of the strongest pay increases since the recovery years from the financial crisis.

Source: ISS Analytics
Pay Ratio: Interesting Numbers, Few Conclusions
Approximately 500 companies have reported their CEO pay ratio so far, and—as expected—the numbers have landed all over the map. While all other analyses in this post focus on same-store CEOs, because this is a new disclosure and we don’t have broad year-over-year comparison data, for pay ratio we include all disclosing CEOs. S&P 500 companies have reported ratios as low as 1.87 (Warren Buffet at Berkshire Hathaway) to as high as 2,526 (Kevin Clark at Aptiv PLC). Breaking this out into percentile bands makes individual pay ratios easier to contextualize:
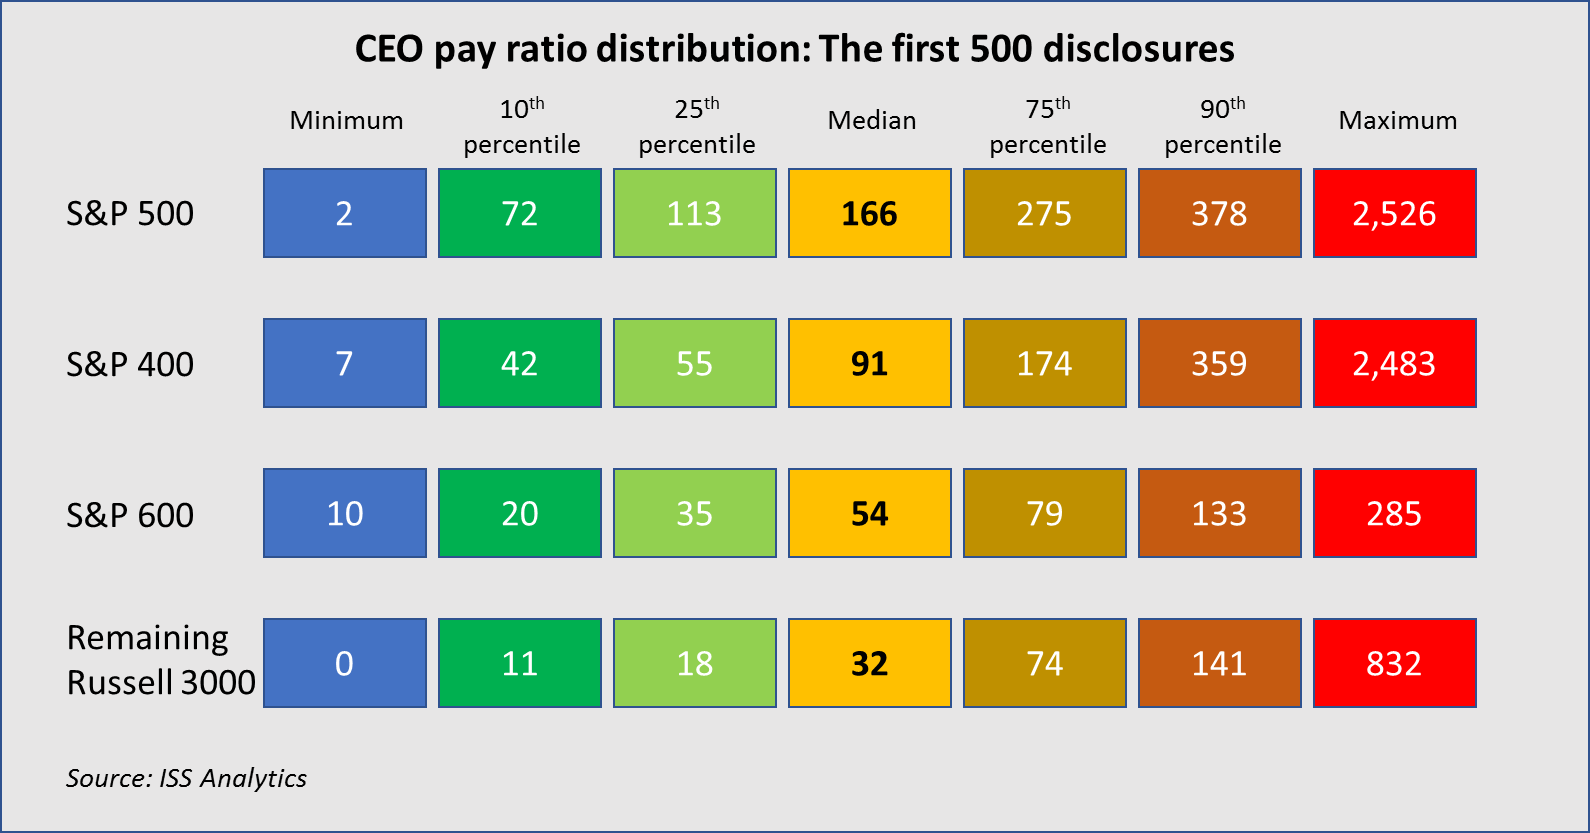
Although some commenters will likely cite the average pay ratio disclosure for companies in various indices or industries, the influence of large-ratio outliers suggests that the median provides a much better picture of what companies are actually disclosing.
Historical Context Shows Strong Compensation Sentiment
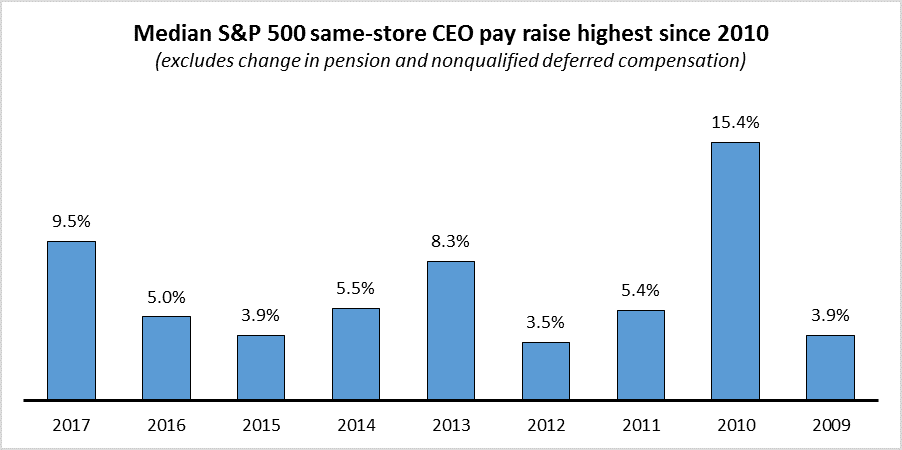
Looking at large capital, S&P500 pay changes over the years helps set the context of this year’s increases. We look at this data through two lenses: First, excluding changes in pension and non-qualified deferred compensation—large swings are sometimes seen in this category, but are driven primarily by interest rate assumptions and actuarial table updates rather than by new compensation awards. Using this frame of reference, pay changes in fiscal 2017 are the largest since those received in 2010 when many companies were recovering from the financial crisis.
Source: ISS Analytics
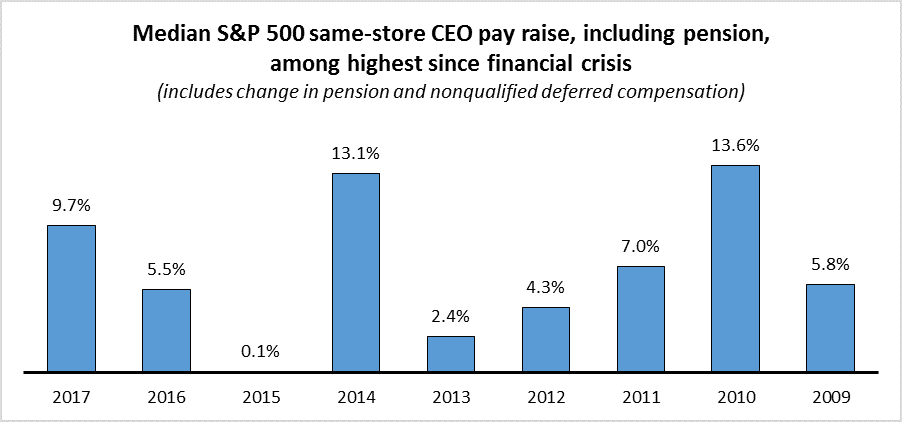
Adding back in the change in pension produces a more complex year-over-year track record, due to periodic interest rate assumption adjustments (particularly driven by interest rates remaining lower than expected for an extended duration, depressing the performance of pension plan assets) as well as an actuarial table update that happened in 2014, leading to longer life expectancies for many executives. Even factoring this data back in, fiscal 2017 looks to be a strong year for executives.
Source: ISS Analytics
Stock Awards and Annual Incentives Driving CEO Pay Increases
As in prior years, stock awards continue to be the primary driver of increased executive pay. But with the strong stock market performance in 2017, annual incentives also showed a strong year-over-year increase. We look at aggregate pay for guidance on where pay changes are coming from; we do this by tallying the components of pay (such as base salary, bonus, and so on) for each executive across the Russell 3000 and determining how the aggregate changes year-over-year (again, to ensure better comparability, just factoring in these same-store CEOs).
Stock award increases contributed to an overall 7.4 percent increase in CEO pay, while increases in paid-out annual incentives added another 2.6 percent. Aggregate stock option grants fell behind 2016 levels, acting to reduce overall pay by 2.2 percent. All of the components are reflected in the following chart:

Source: ISS Analytics
Compensation Story for 2018 May Not Yet Be Written
While early disclosures indicate large pay increases for CEOs in 2018, the story for 2018 is yet to be fully written. Only about one-third of all large- and mid-cap company disclosures are in so far, and a smaller fraction of small-cap companies—a number that will rise dramatically over the next month. As those disclosures are made, we will publish updated trend data.
The complete publication is available here.
Endnotes
1“Same-store” includes all CEOs that were employed as CEO for the full two most recent fiscal years. Companies that have multiple concurrent chief executives are excluded from this analysis. Any company with a fiscal year ending between July 1, 2017 and June 30, 2018 and having publicly disclosed executive compensation data as of March 26, 2018 is included in the Fiscal 2017 analysis.(go back)