 Print
PrintAlex Knowlton is a Senior Research Analyst at Equilar Inc. This post is based on an Equilar memorandum by Mr. Knowlton, Amit Batish, Courtney Yu, Elizabeth Carroll, Hailey Robbers, and Joseph Kieffer.
With Say on Pay now a regular part of the executive compensation landscape, companies have a clear understanding of how shareholders view chief executive pay. Since the implementation of Say on Pay in accordance with the enactment of Dodd-Frank, over three-fourths of large-cap companies have received at least 90% of shareholder approval, while chief executive officer (CEO) compensation has continued to increase with each passing year.
However, despite the overall increase in total CEO compensation, the composition of CEO compensation, especially equity, has seen updates to reflect the modern pay landscape. Say on Pay provides shareholders an outlet to voice opinions on CEO compensation, and companies, for the most part, listen. For example, compensation tied to specific performance goals became increasingly prevalent with each passing year, evidenced by almost 90% of Equilar 500 CEOs receiving an award tied to some performance metric in 2017. As awards have more often than not hinged upon some performance metric, time-based awards, specifically option awards, continually decreased in prevalence. Additionally, plan-based bonuses and performance incentives have seen a higher, widespread usage, while discretionary bonuses still remain few and far between.
Furthermore, as the voices of activists and institutional investors have become louder and more pronounced, pressure has continually mounted upon boards to align the pay of CEOs with the long-term company strategy, as well as the interests and returns of shareholders. As a result, a majority of large-cap companies highlight some form of shareholder engagement in the annual proxy statement, with discussions on executive pay a principal engagement topic.
This 2018 edition of the Equilar CEO Pay Trends report contains information on trends and changes of CEO compensation, in addition to the breakdown of pay package components, chiefly: cash, equity, time-based and performance-based vehicles. A review of these trends over the five year period provides insight into how boards have positioned pay to balance the combination of executive talent, company strategy and shareholder concerns over the years.
Total Compensation Nearly $12 Million in 2017
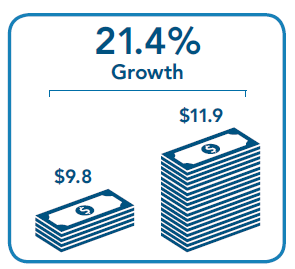
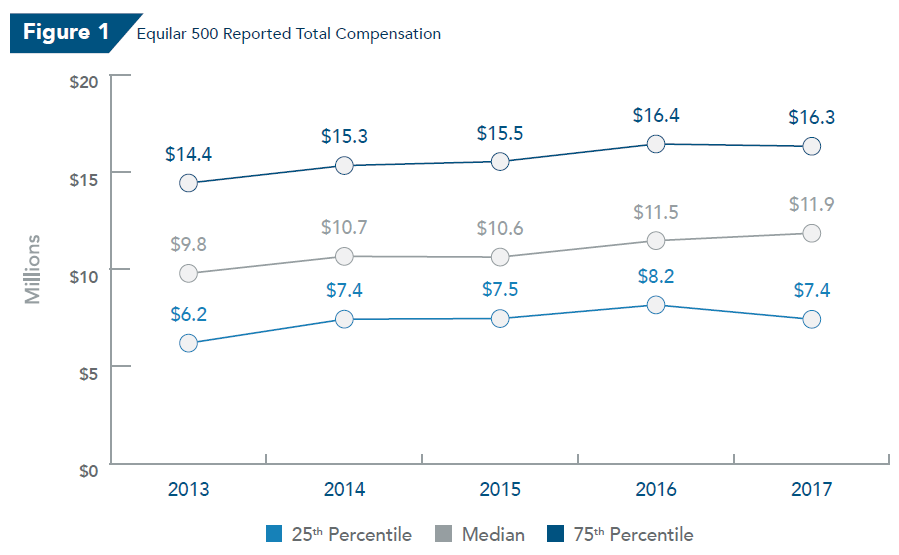
The median total reported compensation for Equilar 500 chief executive officers was $11.9 million in 2017, the highest of the five years in the study, and a 3.5% increase from the previous year, though not as large as the increase between 2015 and 2016. Additionally, with generally consistent growth throughout the years included in the study, the median total compensation has increased 21.4% from 2013 to 2017. That being said, both the 25th percentile and 75th percentile for Equilar 500 total compensation actually saw decreases from 2016 to 2017 of 9.8% and 0.6%, respectively.
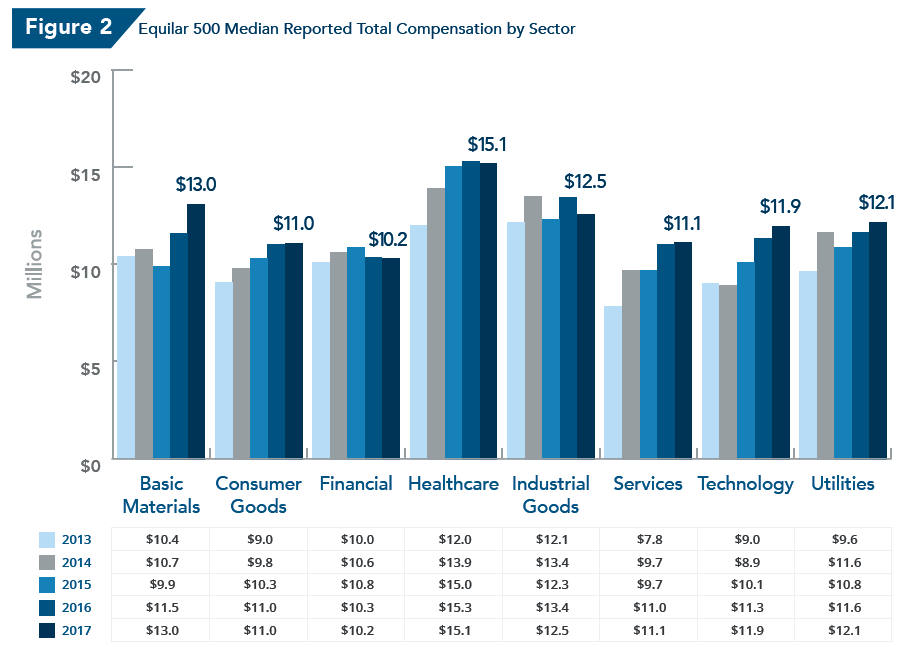
Breaking down median total compensation by sector allows for a more in-depth analysis across industries and provides for more specific trends. The healthcare sector, despite remaining constant around $15 million from 2015 to 2017, had the highest median total compensation in all three years. The basic materials sector was the only other sector to have median total compensation for CEOs of at least $13 million, while the financial sector had the lowest median total CEO compensation at $10.2 million.
Stock Continues to Represent Majority of CEO Compensation
Stock, which is the summation of both restricted stock and units, increased steadily over each year in the study and had a peak median value of $5.4 million in 2017, more than $3 million of the median value of any other pay component. With all other pay components remaining relatively constant in value from 2013 to 2017, the increase in median CEO pay can be attributed almost exclusively to the increase in median stock value. Though stock also represented the largest value for median pay components in every sector, the basic materials and technology sectors sported the highest median values, with both sectors’ median stock values surpassing $6.9 million.
While value provides one avenue of pay component analysis, the makeup of median total compensation also allows for deliberation between each CEO pay component. For example, on average, nearly half of the median total compensation—48.5% to be exact—for an Equilar 500 CEO was comprised of stock. Annual bonus was the second most prevalent component, with almost a quarter of median compensation represented in the form of a bonus. The makeup of total compensation also provides for a detailed look at compensation structure between the sectors. Utilities employed both stock and salary the most on average, while granting CEOs the fewest options and “other” compensation, which is comprised of benefits and executive “perks.” Conversely, the consumer goods and services sectors spread the components of CEO pay out the most across multiple vehicles.
Long-Term Incentives Highlight Performance
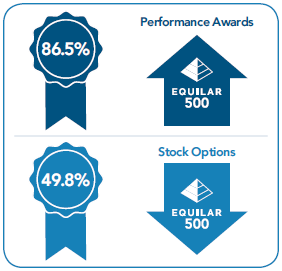
While the aforementioned stock was the most prevalent component of median total compensation for Equilar 500 CEOs, performance-based was the most common vehicle by which long-term incentives (LTI) were delivered. In fact, 86.5% of companies granted an incentive award with a performance condition in 2017, compared to only 49.8% of companies awarding time-based options. On top of that, performance award prevalence at Equilar 500 companies increased by 20% from 2013 to 2017, while time-based option usage decreased by 16.3% over that same time frame. Over 90% of technology companies granted awards with a performance-based vehicle, and all sectors had at least 82% of companies follow suit.
The median long-term incentive package granted to an Equilar 500 CEO in 2017 consisted of a 54.6% performance-based and 45.4% time-based mix. While this may seem somewhat of an equal breakout, when compared to previous years the numbers begin to paint a vibrant, performance-based picture. Since 2015, performance-based LTI has seen an increase of 14.2%, and an even larger increase of 23.8% since 2013. The utilities and financial sectors both showcased a performance-based LTI mix of nearly 60% of the median incentive award. Moreover, technology, though almost 90% of companies in the sector utilized a performance award, was the sector with the least performance-based LTI mix, with the breakout barely a majority of 51.2% in terms of performance.
Of all Equilar 500 companies in 2017, 30% utilized both restricted stock and performance awards as vehicles in long-term incentive awards for chief executive officers, a 92.3% increase for the same combination in 2013. Granting just options was the least prevalent LTI vehicle in 2017, at 2.1% of companies. Additionally, companies granting options as the only vehicle were even less prevalent than companies that granted no equity at all in the most recent year. In fact, throughout all five years in the study, time-based vehicles with no performance supplement—options or restricted stock alone, or a combination of the two—were never featured by more than 9% of companies each, exhibiting the mass push towards performance since the enactment of Dodd-Frank.
Methodology
CEO Pay Trends, an Equilar publication, analyzes the compensation data of chief executive officers at Equilar 500 companies over the last five fiscal years. The Equilar 500 is comprised of the 500 largest, by reported revenue, U.S.-headquartered companies that trade on one of the major U.S. stock exchanges (Nasdaq, NYSE or NYSE American), with adjustments to compare to the sector mix of similar large-cap indices. Fiscal year one is defined by companies that filed their most recent proxy statement (DEF 14A or DEFC 14A) or compensation information in a 10-K amendment (10-K/A) between May 2, 2017 and May 1, 2018. Additionally, CEOs that did not serve in the position for a full fiscal year were excluded from the analysis.
Total compensation is defined as the total sum of salary, bonus, non-equity incentive plan compensation, stock awards, option awards and all other compensation as reported in the summary compensation table (SCT). As a way to eliminate actuarial value changes, nonqualified deferred compensation and changes in pension value were excluded from the summation of total compensation. The term “options” includes both options as well as stock appreciation rights (SARs). Similarly, “stock” refers to all full-value shares, including both restricted stock units and restricted stock awards. Performance awards are defined in the report as all long-term incentive compensation vehicles that are linked to a performance metric in some way. Industry sectors for companies in the Equilar 500 are based on the Yahoo! Finance classifications. Though excluded from the sector analysis, companies with the designation of conglomerate were still included in the overall figures.
The data points and figures captured in the report highlight trends in the compensation of chief executives and how companies award that compensation. Meridian Compensation Partners has provided independent commentary to help illustrate how compensation awards are structured and paid to Equilar 500 CEOs.
Key Findings
- Median reported total compensation for Equilar 500 chief executive officers was $11.9 million in 2017, $400,000 more than the previous year’s median and a 4% increase from 2013, the first year in the study.
- Despite remaining constant around $15 million the past three years and even slightly decreasing from 2016 to 2017, median total compensation of CEOs in the healthcare sector was the highest of all sectors. The median total compensation of basic materials chief executives was the only other sector to reach at least $13 million, while the financial sector saw the lowest median at $10.2 million in 2017.
- On average, nearly half of the reported pay mix for CEOs in the Equilar 500, 5%, is represented in the form of stock. Conversely, barely 3% of the pay mix is made up of “other” compensation, such as benefits and perquisites.
- 86.5% of Equilar 500 CEOs received an award with a performance condition in 2017, while only 49.8% of the same group was granted an award with time-based options.
- At the median, 6% of the reported LTI mix for the Equilar 500 was performance-based in 2017. Additionally, financial and utilities companies reported a high of 59.7% performance-based LTI mix, while technology had the lowest median with only 51.2% of LTI mix as performance-based.
- 30% of all companies in 2017 utilized both restricted stock and performance vehicles in awards, the combination resulting in the most prevalent of all grant vehicles.
Data Points
- From 2013 to 2017 the median total compensation of CEOs increased by 21.4%. The largest increase, $0.9 million, occurred from 2013 to 2014 and 2015 to 2016 (Fig. 1)
- Average total compensation surpassed $13 million in 2017 for first time in the five years included within the study
- The 25th percentile of total compensation for chief executives at Equilar 500 companies decreased by $800,000 between 2016 and 2017 (Fig. 1)
- As was the case from 2014 to 2016, healthcare was the sector with the highest median total compensation, despite seeing a drop of $0.2 million from 2016 to 2017 (Fig. 2)
- Between the two most recent fiscal years, CEOs in the basic materials sector saw the highest increase in pay at $1.5 million (Fig. 2)
Meridian Compensation Partners Commentary
There are several factors that lead to higher or lower CEO compensation rates by industry. The most obvious and direct factors are the size and complexity of the organization and the related experience and skill level required by the CEO. Actual performance of the company, and the executive, will materially impact annual bonus and long-term performance-based incentive payout levels. The overall market demand for talent within the certain industry, in comparison to the supply of well-qualified executives, will also have an impact on pay levels.
For example, healthcare is typically in the lead when it comes to CEO compensation. CEOs in this industry often possess a very specific set of skills when it comes to identifying and integrating strategic acquisitions to build value. The high level of M&A activity in this industry means there is relatively higher risk. CEOs typically demand a market premium in pay to offset this risk.
Technology, on the other hand, has seen some of the strongest gains. This appears to be related to the high demand for talent in this space. It’s not just from within the technology sector—most companies in all industries are transforming to be more “tech-oriented” or “tech-enabled” and therefore recruiting executive talent away from the technology sector. With higher demand, technology companies are forced to pay higher wages to retain their talent.
* * *
The complete memorandum is available here.
