 Print
PrintRichard Presutti is partner at Schulte Roth & Zabel LLP. This post is based on a Schulte Roth & Zabel memorandum by Mr. Presutti, Matthew Gruenberg, Andrew Fadale, Stavan Desai, William Morici, and David Rothenberg. Related research from the Program on Corporate Governance includes M&A Contracts: Purposes, Types, Regulation, and Patterns of Practice and Allocating Risk Through Contract: Evidence from M&A and Policy Implications (discussed on the Forum here), both by John C. Coates, IV.
In this post, we survey private equity buyer acquisitions of U.S. public companies from 2015 to 2017. Focusing on key terms in middle- and large-market acquisitions valued at over $100 million, we also compare our findings with our previous analysis of transactions from 2013 to 2014. The complete publication identifies key market practices and deal trends, and its appendices present additional data that will be helpful to participants in today’s M&A markets.
Survey Methodology
Consistent with our prior deal studies, we conducted the survey as follows:
- We reviewed certain key deal terms in all private equity buyer/public-company target cash merger transactions entered into in 2015, 2016 and 2017 involving consideration of at least $100 million (a total of 56 transactions and, collectively, the “2015-17 Transactions”). For the purposes of our analysis, the 2015-17 Transactions are further divided into the following two groups:
- Transactions involving consideration of at least $500 million in enterprise value (a total of 36 transactions and, collectively, the “2015-17 Large-Market Transactions”); and
- Transactions involving consideration of at least $100 million but less than $500 million in enterprise value [1] (a total of 20 transactions and, collectively, the “2015-17 Middle-Market Transactions”).
- We then compared such deal terms with those of similarly sized private equity buyer/public company target cash merger transactions entered into in 2013 and 2014 (which were the subject of our most recent deal study and which we refer to herein as the “2013-14 Transactions,” divided similarly into the “2013-14 Large-Market Transactions” and “2013-14 Middle-Market Transactions”) and, where applicable, set forth detailed analysis of any notable changes in market trends with respect to such deal terms.
Please note that (i) the findings of our survey are not intended to be an exhaustive review of all terms in the transactions—this survey reports only on those matters that we believe would be most interesting to the deal community; (ii) our observations are based on a review of publicly available information for the transactions; (iii) the transactions discussed herein account for only a portion of M&A activity during the surveyed periods and may not be representative of the broader M&A market; and (iv) our comparative analysis may be impacted by the relatively small sample size and differences in size of the sample groups.
A list of the surveyed transactions can be found in Appendix A of the complete publication, available here.
Key Takeaways
In general, we continue to observe a “market practice” regarding a number of the key deal terms.
Deal Structure
- One-step mergers continue to be more popular than two-step tender offers. Approximately 84% of all 2015-17 Transactions were structured as one-step mergers rather than two-step tender offers followed by back-end mergers, up from 71% of all 2013-14 Transactions. 92% of 2015-17 Large-Market Transactions were structured as one-step mergers, up from 75% of 2013-14 Large-Market Transactions. 70% of the 2015-17 Middle-Market Transactions were structured as one-step mergers, up from 33% observed in 2013-14 Middle-Market Transactions.
- Go-shop provisions were included in approximately 33% of the 2015-17 Large-Market Transactions and 20% of the 2015-17 Middle-Market Transactions as compared to 29% of the 2013-14 Large-Market Transactions and 22% of the 2013-14 Middle-Market Transactions.
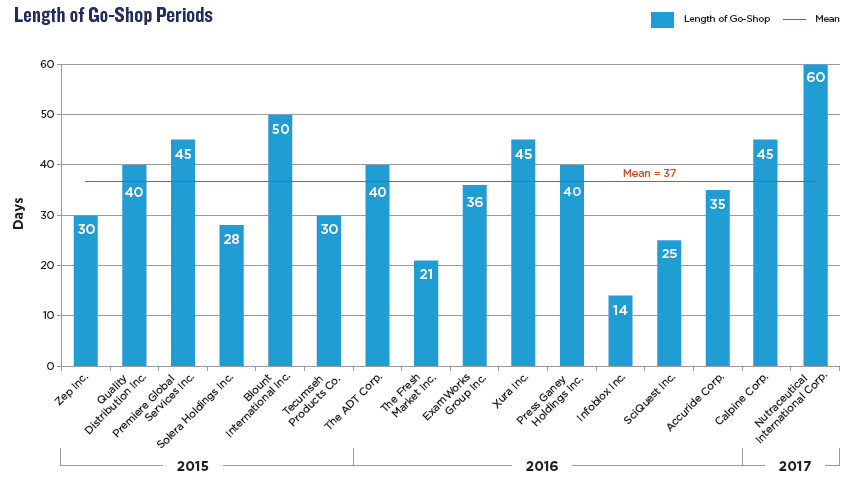
- The go-shop periods have lengthened slightly—the average go-shop was 37 days (median: 38 days) for the 2015-17 Transactions as compared to 33 days (median: 30 days) for the 2013-14 Transactions.
Marketing Period
- Consistent with the increasing trend observed in prior years, a large majority—approximately 81%—of the 2015-17 Large-Market Transactions contained marketing period provisions. In the 2015-17 Middle-Market Transactions, such provisions were considerably more rare. Only 15% of the 2015-17 Middle-Market Transactions contained “marketing period” provisions as compared to 44% of the 2013-14 Middle-Market Transactions. See Appendix B of the complete publication for more information on the length of marketing periods in the 2015-17 Transactions.
Buyer Deal Protections
- All of the 2015-17 Transactions provided the buyer with match rights and all but one with “last look” match rights.
- The target’s break-up fees declined on a mean/median basis:
- For the 2015-17 Large-Market Transactions, the mean break-up fee was 2.4% of target equity value (median: 2.4%) as compared to 3.3% of target equity value (median: 3.2%) for 2013-14 Large-Market Transactions.
- For the 2015-17 Middle-Market Transactions, the mean break-up fee was 3.1% of target equity value (median: 3.2%) as compared to 3.5% of target equity value (median: 3.6%) for 2013-14 Middle-Market Transactions.
Target Deal Protections
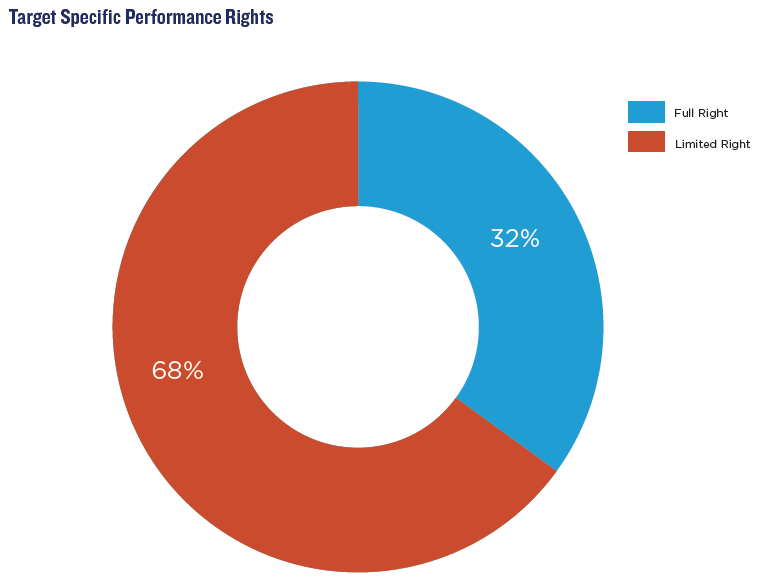
- Closing conditions for buyer financing continue to be essentially nonexistent, with specific performance rights and reverse termination fees constituting the target’s deal protections.
- Approximately 68% of the 2015-17 Transactions (81% of the 2015-17 Large-Market Transactions and 45% of the 2015-17 Middle-Market Transactions, as compared to 83% and 78%, respectively, in 2013-14) gave the target company a limited specific performance right that was available only if (i) the buyer’s closing conditions to the merger agreement were satisfied and (ii) the buyer’s debt financing was available.
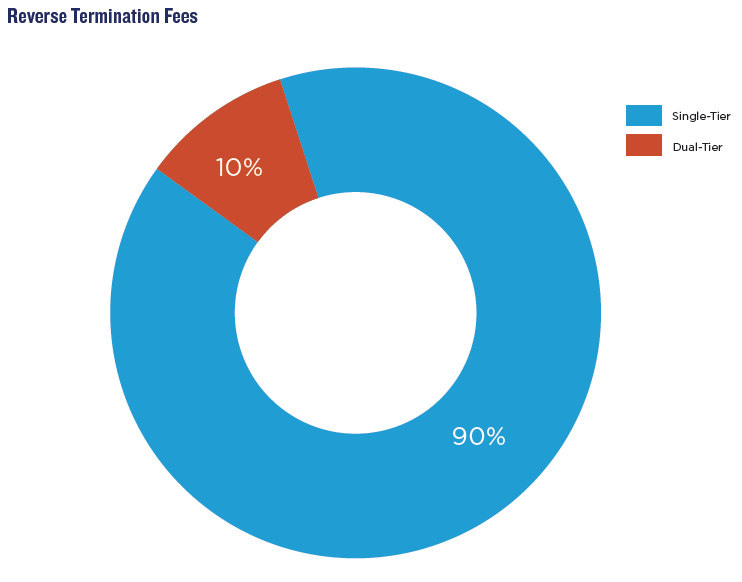
- The average size of a buyer’s reverse termination fee (“RTF”) has declined from 6.5% of the target’s equity value in 2013-14 Transactions to an average of 4.5% in 2015-17 Transactions for deals with single-tier RTFs. [2]

Market Activity—Number and Value of Transactions
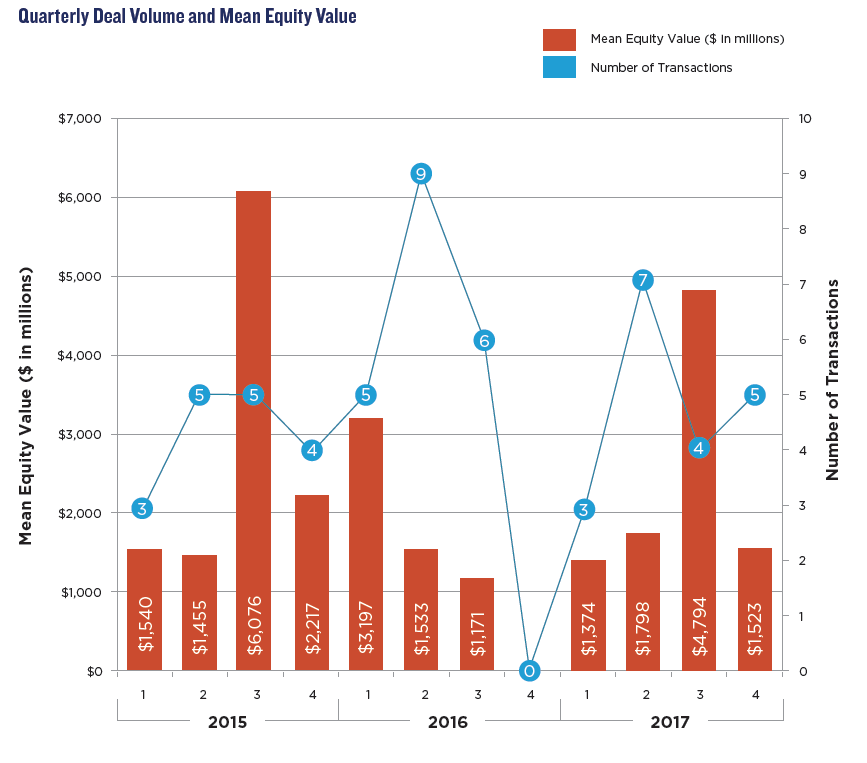
As noted in the chart below:
- The average deal value for the surveyed large-market deals has decreased, although the median deal value has increased—with $3.5 billion mean/$1.7 billion median for the 2015-17 Large-Market Transactions as compared to $4.2 billion mean/$1.0 billion median for the 2013-14 Large-Market Transactions. For the middle-market deals, the average value increased while the median value decreased—from $285.8 million mean/$308.4 million median for the 2013-14 Middle-Market Transactions to $321.2 million mean/$300.2 million median for the 2015-17 Middle-Market Transactions.
Deal Structure—One-Step Merger vs. Two-Step Tender Offer/Back-End Merger
Overall, the two-step tender offer/back-end merger structure (as opposed to a one-step statutory merger) was used less frequently in the 2015-17 Transactions than in the 2013-14 Transactions—13% of all 2015-17 Transactions as compared to 21% of all 2013-14 Transactions.
Large-Market Deals
Only 8% of the 2015-17 Large-Market Transactions were structured as tender offers, whereas 92% were structured as one-step reverse triangular mergers. In comparison, 75% of the 2013-14 Large-Market Transactions were structured as reverse triangular mergers, and 25% were structured as tender offers.
Middle-Market Deals
70% of the 2015-17 Middle-Market Transactions were structured as reverse triangular mergers, and 30% were structured as tender offers. These percentages varied only slightly from what we observed in the 2013-14 Middle-Market Transactions, in which 67% were structured as reverse triangular mergers and 33% were structured as tender offers.
Target Fiduciary Duty Issues
Fiduciary Termination Rights
Consistent with the 2013-14 Transactions, all of the 2015-17 Transactions included a fiduciary termination right allowing the target to terminate the merger agreement with the buyer in order to enter into an alternative acquisition agreement deemed to be a superior proposal, subject in all cases to payment of a break-up fee and the buyer’s match rights, as described in the Deal Protections for Buyer section that follows.
Go-Shop Provisions
Go-shop provisions were used more often in 2015-17 Large-Market Transactions but less often in 2015-17 Middle-Market Transactions, as compared to the 2013-14 Transactions (in 33% of 2015-17 Large-Market Transactions vs. 29% of 2013-14 Large-Market Transactions and in 20% of 2015-17 Middle-Market Transactions vs. 22% of 2013-14 Middle-Market Transactions), as fewer targets in the large market engaged in pre-signing market checks. As illustrated in the following chart, the lengths of go-shop periods have increased. In the 2015-17 Transactions, the average go-shop period was approximately 37 days (median: 38 days), as compared to 33 days (median: 30 days) for the 2013-14 Transactions. [3] See the Break-Up Fee Payable by the Target section following for information regarding the amount of the go-shop break-up fee, compared to the general break-up fee.
Deal Protections for Buyer
We reviewed the 2015-17 Transactions for provisions designed to protect the buyer against topping bids and target stockholder opposition.
Match Rights and Last Look Rights
Initial match rights provide the buyer with an opportunity to negotiate with the target board during a specific period of time after receipt of notice from the target board of an intended change in recommendation (“CIR”) and propose modified terms that are sufficiently improved so as to preclude the target from effecting a CIR. We note that in In re Smurfit-Stone Container Corp. Shareholder Litigation, C.A. No. 6164 (Del. Ch. May 20, 2011), Vice Chancellor Parsons of the Delaware Chancery Court determined that each of the deal protections agreed to by the target, which included a three-day initial match rights period, were “standard,” whether considered alone or as a group. [4] Last look match rights provide the buyer with a further right to negotiate in the event that the other bidder revises its proposed terms.
The terms of the initial match rights were consistent across the 2015-17 Transactions and 2013-14 Transactions. Of the 2015-17 Transactions:
- All had initial match rights (consistent with the 2013-14 Transactions).
- The mean and median time period for initial match rights were 3.6 business days and three business days, respectively [5], which is generally consistent with the initial match rights parameters in 2013-14 Transactions.
The terms of last look match rights were also generally consistent across 2015-17 Transactions and 2013-14 Transactions. All but one of the 2015-17 Transactions had last look match rights. The range of last look match rights was one to seven business days (mean: 2.5 business days; median: two business days), which is consistent with the time periods for last look match rights in the 2013-14 Transactions.
Break-Up Fee Payable by the Target
As with other deal protection devices, Delaware courts have not provided any bright-line rules regarding when a break-up fee will be deemed unreasonable in amount. Nevertheless, practitioners can take comfort that fees in the range of 2% to 4% of equity value are generally permissible. Delaware jurisprudence, most recently in the In re Cogent Inc. Shareholder Litigation, suggests that equity value may be the appropriate metric for calculating a break-up fee where a target has minimal debt. Conversely, where the buyer is assuming a significant amount of a target’s debt, enterprise value may be the appropriate metric. This situation is illustrated by the Macquarie/WCA Waste Corporation transaction (2011), where the target had an enterprise value of $526 million but an equity value of only $154 million (due to its significant debt). The Macquarie/WCA transaction had a two-tier break-up fee: $11 million (2.1% of enterprise value and 7% of equity value) payable in the event of termination for entering into an alternative transaction and $16.5 million (3.2% of enterprise value and 10.7% of equity value) for other specified terminations.
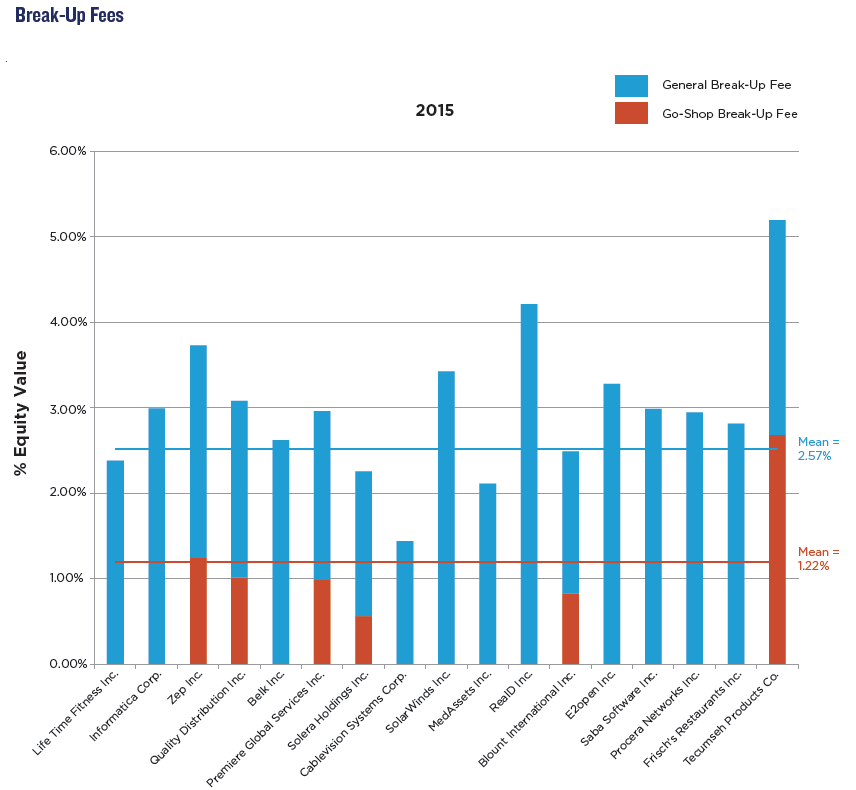
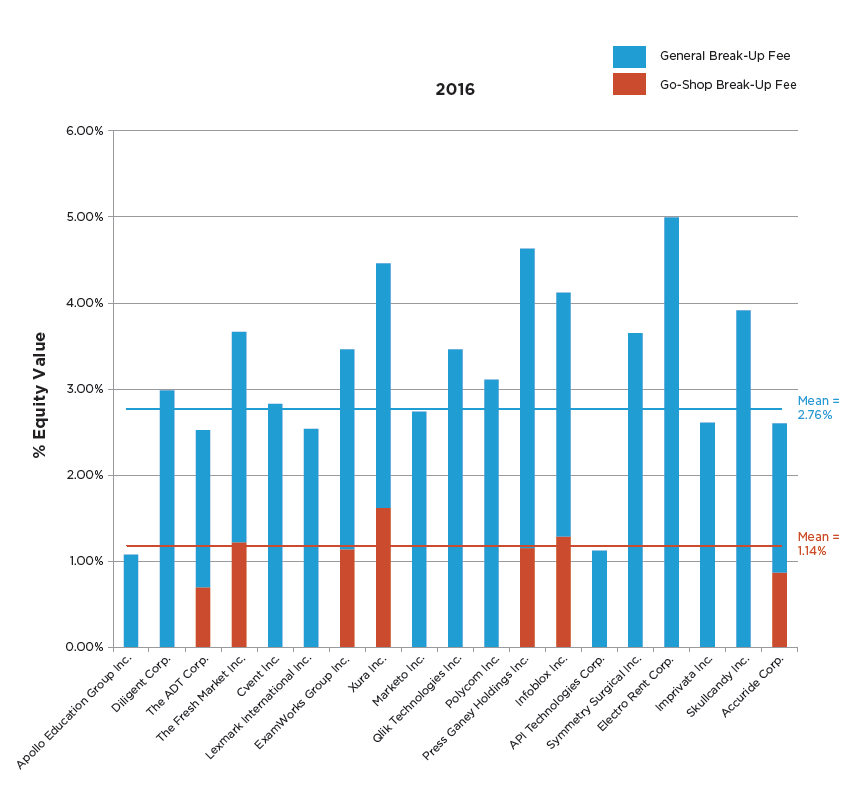
As noted in the following charts:
- For the 2015-17 Large-Market Transactions, both the mean and median break-up fees were 2.4% of equity value, which was lower than 3.3% and 3.2%, respectively, for the 2013-14 Large-Market Transactions.
- For the 2015-17 Middle-Market Transactions, the mean and median break-up fees were 3.1% and 3.2% of equity value, respectively, which also was lower than the 3.5% mean and 3.6% median for the 2013-14 Middle-Market Transactions. [6]
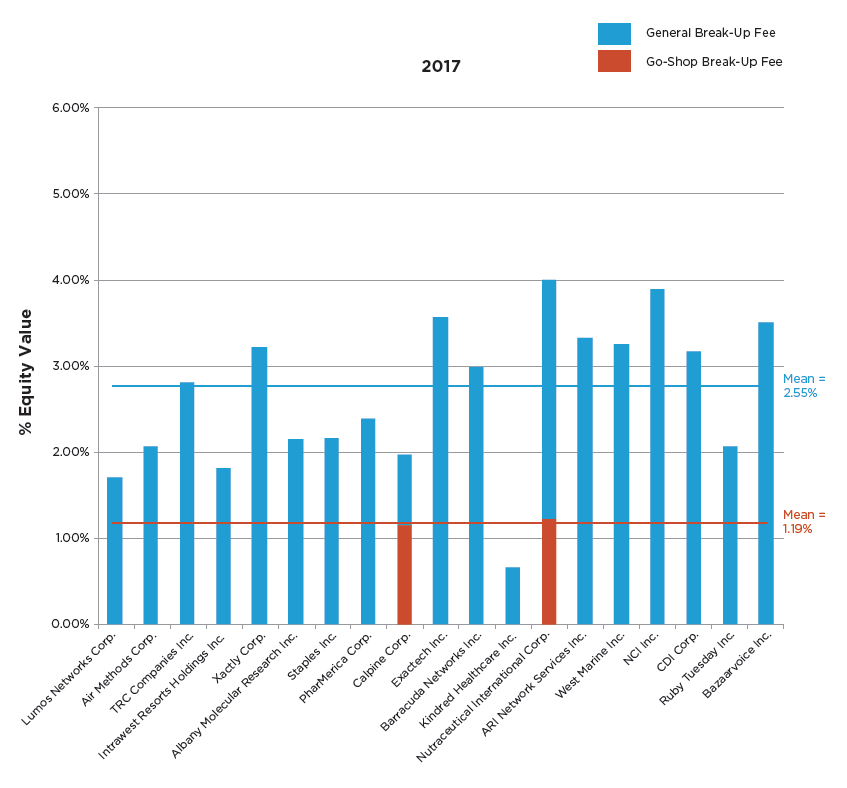
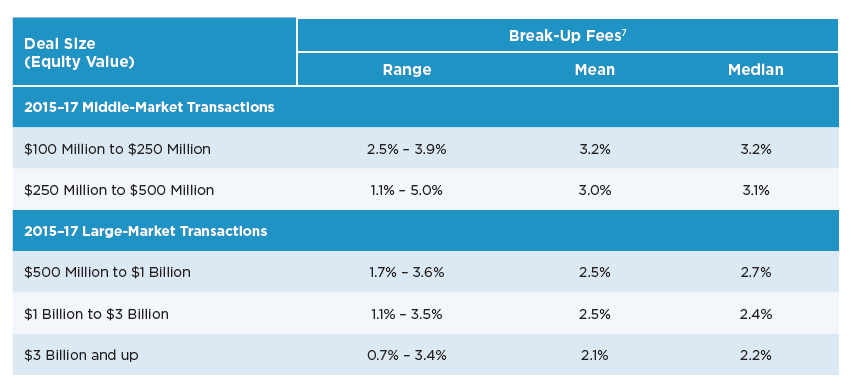
Given the wide range of fees and deal sizes, we grouped the 2015-17 Transactions by deal size based on equity value and noted the range of break-up fees (as a percentage of equity value). We note that the break-up fees as a percentage of equity value on a mean/median basis decreased as deal size increased. [7]
Deal Certainty Provisions for the Target
We reviewed the 2015-17 Transactions for provisions that are intended to provide the target with additional certainty of closing.
Target’s Ability to Obtain Specific Performance Against the Buyer
Our review of the 2015-17 Transactions included an analysis of specific performance rights afforded to the target.
All transactions in our study had at least a limited specific performance remedy (i.e., no deal allowed the buyer to walk away by simply paying a reverse termination fee).
Large-Market Deals
The 2015-17 Large-Market Transactions provided the target with a limited specific performance right against the buyer in 81% of deals surveyed (with 19% providing the target with a full specific performance right). These findings are consistent with recent trends revealing the popularity of limited specific performance rights in larger deals: 83% of the 2013-14 Large-Market Transactions provided the target with limited specific performance rights (with 17% providing the target with a full specific performance right).
Middle-Market Deals
Only 45% of the 2015-17 Middle-Market Transactions contained a limited specific performance right (whereas full specific performance provisions were present in 55%). The popularity of full specific performance rights marks a drastic shift from the 2013-14 period, where of the Middle-Market Transactions that provided the target with any specific performance rights, 83% contained limited specific performance provisions and only 17% contained full specific performance provisions.
Reverse Termination Fees
Our review of the 2015-17 Transactions included an analysis of the structure (single-tier vs. two-tier) and the size of the RTFs (expressed as a percentage of the target’s equity value) required to be paid by the buyer in connection with the termination of the merger agreement.
In general, the buyer’s RTF rates have decreased—from an average of 6.5% of the target’s equity value in the 2013-14 Transactions to an average of 4.5% of the target’s equity value in the 2015-17 Transactions—for deals with single-tier RTFs. (Note that of the 2015-17 and 2013-14 Transactions that contained RTFs, 90% of the 2015-17 Transactions and 81% of the 2013-14 Transactions used a single-tier (rather than a two-tier) RTF structure.)
Below is a summary of our findings:
Large-Market Deals
As noted in the following chart:
- 86% of the 2015-17 Large-Market Transactions had an RTF (as compared to 92% for the 2013-14 Large-Market Transactions):
- 87% of transactions with an RTF had a single-tier RTF (as compared to 86% for the 2013-14 Large-Market Transactions).
- 11% of transactions with an RTF had a two-tier RTF (as compared to 14% for the 2013-14 Large-Market Transactions). The four deals making up the 11% of deals had a higher RTF payable for the following reasons:
- Apex Technology Co. Ltd., PAG Asia Capital and Legend Capital Management Co. Ltd.’s acquisition of Lexmark International Inc.—any breach, except for failure to obtain governmental merger approval, except in the case of merger approval from the People’s Republic of China, financing failure [8] or failure to obtain merger approval from the People’s Republic of China.
- Siris Capital Group LLC’s acquisition of Polycom Inc.—willful breach.
- KKR & Co. LP and Walgreens Boots Alliance Inc.’s acquisition of PharMerica Corporation—willful breach or failure to obtain antitrust approval.
- Canada Pension Plan Investment Board, Access Industries Inc. and Energy Capital Partners’ acquisition of Calpine Corp.—any breach, unless the agreement is terminated due to a lower rating by two rating agencies of the target’s debt instruments.
- 87% of transactions with an RTF had a single-tier RTF (as compared to 86% for the 2013-14 Large-Market Transactions).
With respect to the size of the RTFs:
- For transactions with a single-tier RTF, the mean and median were 4.6% and 4.4% of target equity value, respectively (range: 1.4% to 6.9%), as compared to 6.4% and 6.3%, respectively (range: 0.5% to 10.7%), for the 2013-14 Large-Market Transactions. For transactions with a dual-tier RTF, the mean and median were 5.49% and 5.89%, respectively (range: 1.93% to 8.23%), as compared to 9.21% and 4.69%, respectively (range 3.09% to 19.84%), for the 2013-14 Large-Market Transactions.
Middle-Market Deals
As noted in the following chart:
- Only 10 of the 20 2015-17 Middle-Market Transactions (50%) had an RTF (as compared to 83% for the 2013-14 Middle-Market Transactions), and each of the 10 transactions with RTFs had a single-tier structure (whereas of the 2013-14 Middle-Market Transactions with RTFs, 73% had a single-tier structure and 27% had a two-tier structure).
With respect to the size of the RTFs:
- The mean and median percentages of target equity value were 4.3% and 5.0%, respectively (range: 1.6% to 6.8%), as compared to 6.4% and 6.3%, respectively (range: 4.3% to 8.0%), for the 2013-14 Middle-Market Transactions with a single-tier RTF.
Reverse Termination Fee Triggers
We reviewed the 2015-17 Transactions with RTFs to analyze the types of RTF triggers. Below is a summary of our findings:
2015-17 Large-Market Transactions with RTFs
In 94% of the transactions with an RTF, the RTF was triggered by buyer’s material breach of a representation, warranty or a covenant in the merger agreement—up from 86% in the 2013-14 transactions. Only one of the 2015-17 Large-Market Transactions limited the RTF to instances where buyer was unable to obtain financing, whereas none of the 2013-14 Large-Market Transactions provided such limitation.
2015-17 Middle Market Transaction with RTFs
In 70% of the transactions with an RTF, the RTF was triggered by buyer’s material breach of a representation, warranty or a covenant in the merger agreement—a decrease from 73% in the 2013-14 transactions. 30% of the 2015-17 Middle-Market Transactions limited the RTF to instances where buyer was unable to obtain financing, whereas none of the 2013-14 Middle-Market Transactions provided such limitation.
Treatment of Buyer’s Willful Breach
We reviewed the 2015-17 Transactions with RTFs to determine whether the target’s damages for buyer’s willful breach were capped and whether “willful breach” was defined. We observed a decrease in Large-Market Transactions that contained a cap on damages for buyer’s willful breach equal to the amount of the RTF, whereas the number of Middle-Market Transactions featuring such a structure increased.
2015-17 Large-Market Transactions with RTFs
- Of the deals with RTFs, 90% of them had a specific damages cap, down from 95% in 2013-14. Of those deals with a specific cap, 86% were capped at the single-tier RTF and 14%, each providing for a dual-tier RTF, with capped damages at the higher RTF. Only one deal limited the remedy for buyer’s willful breach to specific performance only.
- Of the deals with RTFs, only 3% of the 2015-17 Large-Market Transactions allowed for damages for buyer’s willful breach that were uncapped, down from 5% of the 2013-14 Large-Market Transactions. [9]
- Buyer’s willful breach was defined in 52% of the transactions with RTFs, and in 63% of such
transactions the definition required the taking of a deliberate act or omission constituting a breach but did not require that the breach be the conscious object of the act or omission.
Chancery Court Vice Chancellor Lamb’s definition of a “knowing and intentional breach” in Hexion Specialty Chemicals, Inc. v. Huntsman Corp., C.A. No. 3841 (Del. Ch. Sept. 29, 2008), holding that a “knowing and intentional” breach means “the taking of a deliberate act, which act constitutes in and of itself a breach of the merger agreement, even if breaching was not the conscious object of the act.” We note that the “knowing and intentional” formulation in Hexion and in these transactions is target-friendly in that it avoids any need to establish that a buyer acted with the intent of breaching the merger agreement, which intent may be very difficult to prove.
2015-17 Middle-Market Transactions with RTFs
- Of the deals with RTFs, 80% of the 2015-17 Middle-Market Deals contained a specific cap on damages for buyer’s willful breach and all but one of those deals were limited to the amount of the RTF, down from 87% of 2013-14 Middle-Market Deals. The only deal that had a specific damages cap and did not limit it to the RTF actually limited damages to an amount less than the RTF. [10] No transactions limited the damages for willful breach by buyer to specific performance.
- Only 20% of the transactions with RTFs provided for uncapped damages for buyer’s willful breach, whereas no transaction with an RTF was without a cap in 2013-14.
- In four of the 10 transactions with RTFs, willful breach was defined. In two of these cases, willful breach required intent.
Willful Breach, RTF and Specific Performance
As is noted at the beginning of this section, each of the 2015–2017 Transactions had at least a limited specific performance right. In each where the target is able to pursue damages, either explicitly capped or uncapped, it may also pursue specific performance from buyer to complete the transaction. This mechanic is important for transactions that limit the damages for willful breach by buyer to the RTF in order to prevent buyer from entering into an agreement with a set walk price. Without such mechanic, these agreements would essentially be reduced to option contracts.
The complete publication, including Appendix, is available here.
Endnotes
1The enterprise values of the 2015-17 Large-Market Transactions ranged from $530.6 million to $18.6 billion, and the enterprise values of the 2015-17 Middle-Market Transactions ranged from $127.0 million to $496.9 million.(go back)
2All but four of the transactions surveyed which contained RTF provisions were single-tiered.(go back)
3The duration of the go-shop periods in the 2015-17 Large-Market Transactions had a mean of 36 days and median of 40 days (range: 14 days to 50 days). The duration of such periods in the 2015-17 Middle-Market Transactions had a mean of 38 days and median of 33 days (range: 25 days to 60 days). For the 2013-14 Large-Market Transactions, both the mean and median were 32 days (range: 14 days to 45 days), while the 2013-14 Middle-Market Transactions had a mean and median of 35 days and 30 days, respectively (range: 30 days to 50 days).(go back)
4The other deal protection provisions included a no-shop clause and a break-up fee of approximately 3.4% of the target equity value.(go back)
5For the 2015-17 Large-Market Transactions, the mean and median were 3.4 and three business days, respectively. For the 2015-17 Middle-Market Transactions, the mean and median were both four business days, respectively.(go back)
6The mean and median break-up fees for the 2015-17 Middle-Market Transactions both exclude SciQuest Inc.’s acquisition by Accel-KKR LLC, which had a two-tiered break-up fee structure with a lower break-up fee of 4.1% and a higher break-up fee of 8.9%.(go back)
7Figures are based on a percentage of equity value.(go back)
8Lexmark is unique in that the agreement expressly provides that either the failure of the parent to comply with the financing covenants or failure of one of the acquirers to obtain shareholder approval for the merger constitutes a material and willful breach by the respective failing party.(go back)
9One deal, Informatica Corp.’s acquisition by Permira and the Canada Pension Plan Investment Board, not included in the 6%, provided for uncapped damages only when buyer’s willful breach resulted from fraud by buyer.(go back)
10Monomoy Capital Partners’ acquisition of West Marine Inc. provided for an RTF of $17 million, but limited the damages for intentional breach of the buyer’s covenants to $15 million.(go back)
