 Print
PrintBen Burney is a Senior Advisor at Exequity, LLP. This post is based on an Exequity memorandum by Mr. Burney. Related research from the Program on Corporate Governance includes Paying for Long-Term Performance by Lucian Bebchuk and Jesse Fried (discussed on the Forum here).
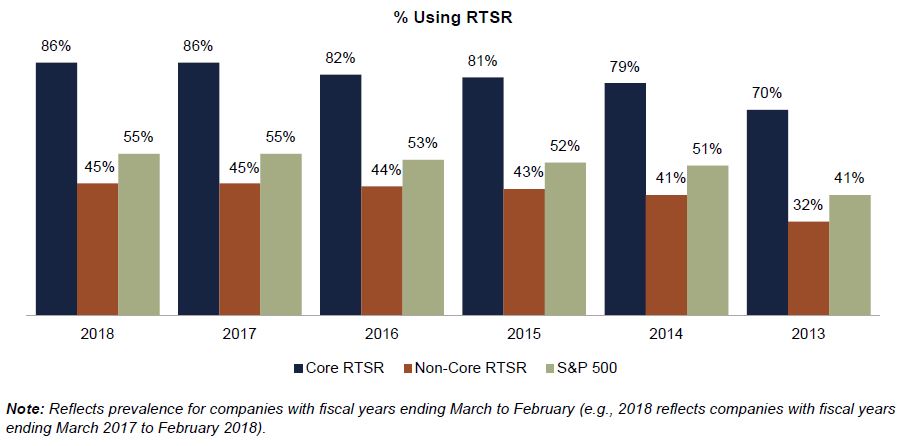
Over the last several years as compensation committees and executives strive to align pay with shareholder returns, they have increasingly turned to market-based performance measures such as relative total shareholder return (RTSR) [1]. Traditionally, RTSR was used primarily by Energy and Utilities companies, largely because these companies’ stock prices tend to be closely correlated, so TSR differences can more confidently be attributed to the success of management’s stewardship. Adoption of new RTSR plans has slowed in recent years, leveling off at 55% for 2018—the same prevalence we reported in 2017. TSR remains a popular metric for compensation committees striving to maintain defensible compensation programs that also comport with shareholder (and proxy advisor) expectations.
This is the fourth year Exequity has reported on RTSR usage and the sixth year we have tracked prevalence across S&P 500 companies. As in prior years, we analyzed the key design elements of RTSR programs in an effort to discern how RTSR is being implemented across S&P 500 companies and whether the new entrants to the RTSR fold have designed their plans similarly to the plans traditionally used by Energy or Utilities companies.
2018 Highlights
Overall, prevalence of RTSR in long-term incentive plans is flat for 2018, remaining at 55%. RTSR as a discrete metric is the most prevalent method, used by 82% of companies, while 18% utilize RTSR as a modifier—little different than in 2017 when 19% used RTSR as a modifier and 81% as a metric. Among companies employing RTSR as either a metric or modifier, approximately 47% measure RTSR against a custom group of companies and, of those companies, 43% against the same peer group used for benchmarking compensation levels and 57% against a custom performance peer group. The remaining 53% using RTSR as a metric or modifier measure RTSR against a pre-defined set of peers determined by a third party (e.g., a stock index such as the S&P 500) and, of those companies, 50% use a multi-sector index (e.g., the S&P 500) and 50% a single-sector index. The S&P 500 is used by 23% of companies using RTSR—the same as in 2017.
Prevalence
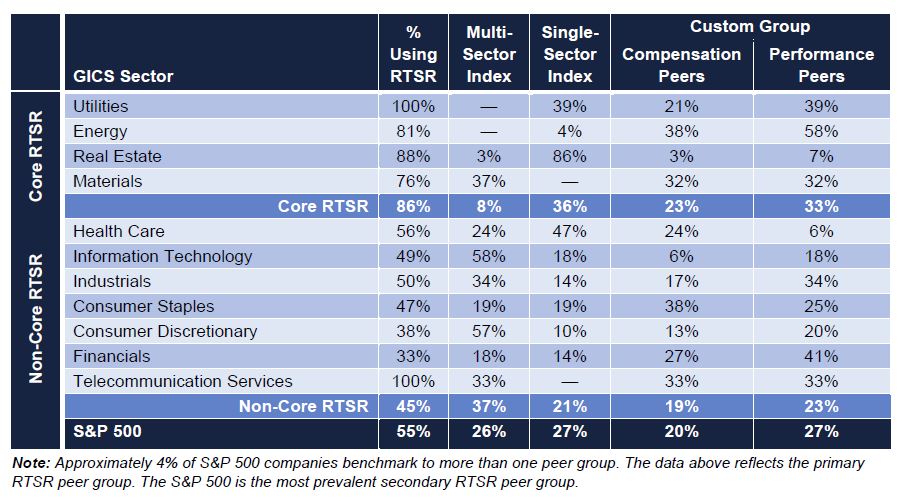
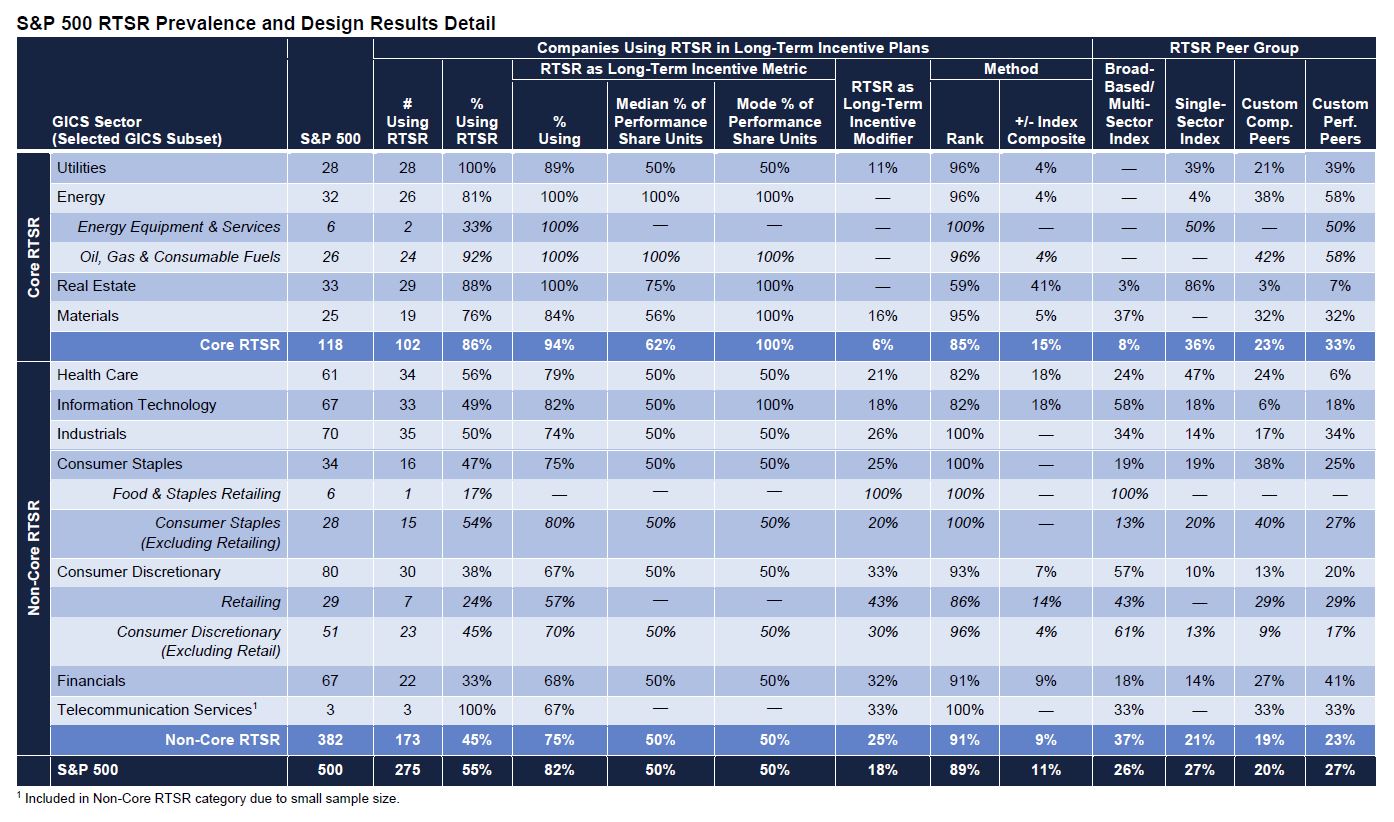
Energy and Utilities companies continue to be the primary users of RTSR across the S&P 500, with 81% of Energy and 100% of Utilities companies using RTSR. Materials and Real Estate companies report high RTSR prevalence as well: 76% and 88%, respectively. Within each of these high-prevalence sectors, companies tend to face similar commodity price pressures or economic similarities, potentially rendering RTSR a more reliable method for identifying financial and operational outperformance via market performance. (We refer to Energy, Materials, Real Estate, and Utilities companies collectively as the Core group of RTSR users, while the remaining companies we refer to as Non-Core.)
We note that Non-Core RTSR companies generally have lesser (or more diversified) commodity pricing (or other) pressures and tend to use RTSR with roughly one-half the frequency of Core companies. Prevalence among other Non-Core companies is generally within the 40% to 50% range. We would posit that Non-Core companies experience a more diverse array of stock price pressures than do Core companies by virtue of various industry-specific factors that operate as independent variables, from raw materials and transportation costs to consumer preferences. [2] It appears that industry-specific forces are driving the ways in which RTSR is used in pay programs.
The table below reflects the prevalence of RTSR programs within selected industries:
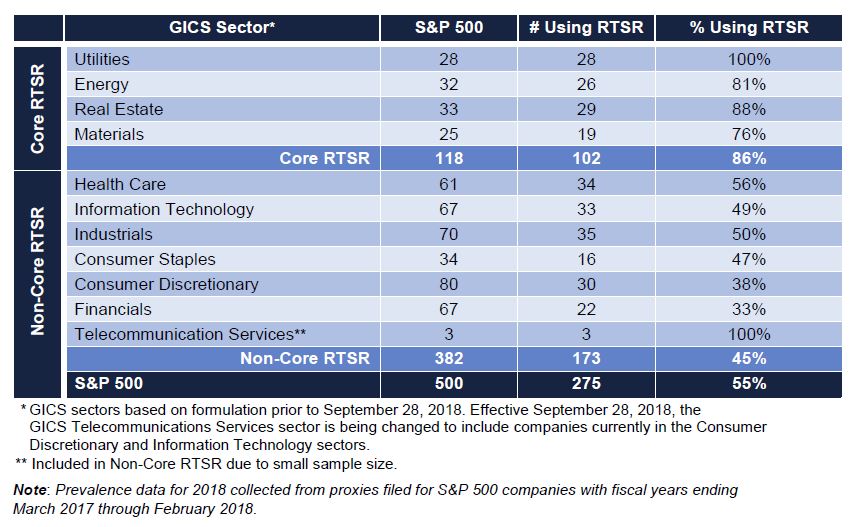
Overall, prevalence of RTSR programs for 2018 is unchanged from 2017.
Metric Versus Modifier
Companies typically employ RTSR in one of two ways: as a discrete metric within a performance plan or as a modifier to a financial metric. Used as a discrete metric, RTSR is assigned a weighting within the performance share plan, e.g., a company using RTSR as a discrete metric may weight it 50% and return on capital 50%. As a modifier, RTSR generally adjusts performance plan payouts, which typically measure a non-market metric (e.g., return on capital). In most cases, RTSR modifiers provide for upward or downward adjustment to plan payouts (e.g., a modifier of +/- 25%), though companies may also utilize downward-only or upward-only modifiers.
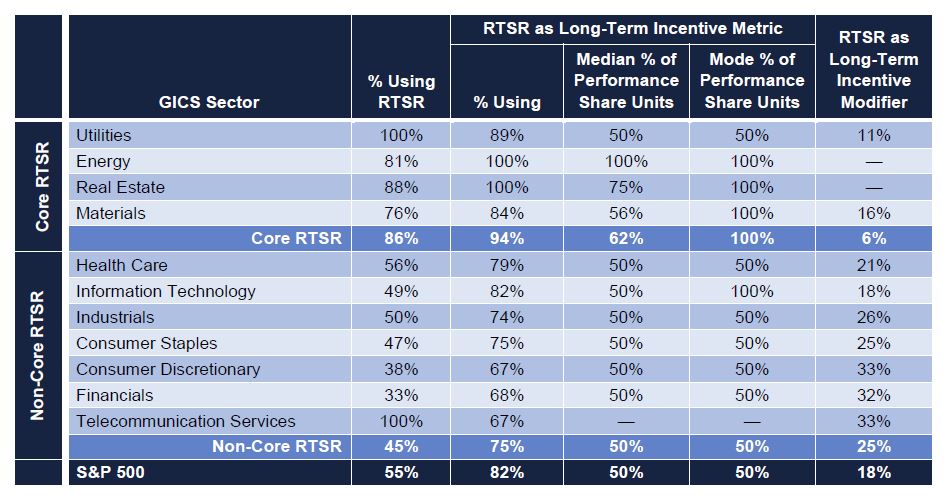
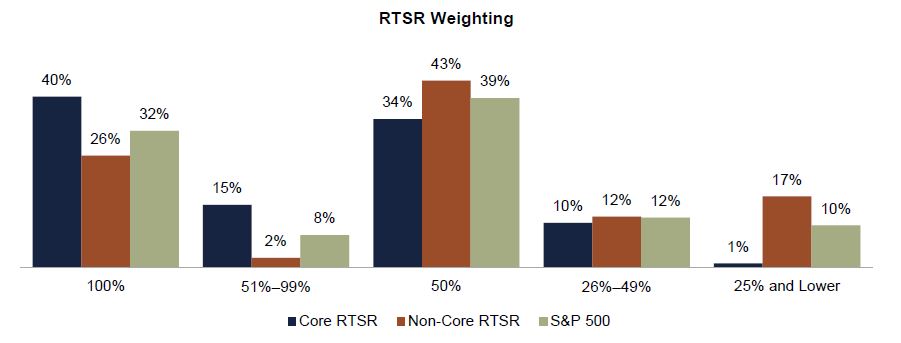
A majority of S&P 500 companies including RTSR in their long-term incentive plans use it as a discrete metric within their performance plans. The most prevalent weighting given to RTSR under performance share plans is 50% and Core companies weight RTSR more heavily than Non-Core companies with 41% of Core companies weighting RTSR at 100% versus 27% for Non-Core companies.
In addition to assigning lower weightings to RTSR, Non-Core companies represent 88% of those using RTSR as a modifier. Among these Non-Core companies, approximately 34% measure performance against the S&P 500, 41% versus a custom compensation or performance peer group, 20% versus a sector index, and 5% versus a multisector index other than the S&P 500.
The table below identifies the ways in which RTSR is used within selected industries.
The graph below presents RTSR weightings as a percentage of total performance shares across Core and Non-Core companies.
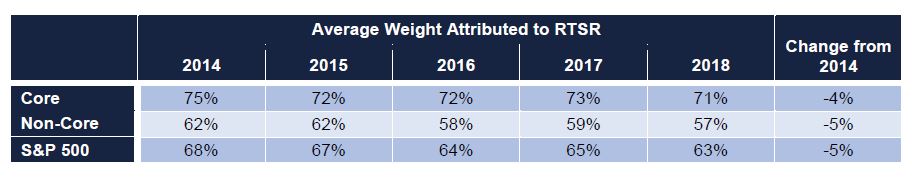
Over the past five years, the average weight given to this metric has decreased by 5%. The table below displays the average weight attributed to RTSR in performance plans (excluding RTSR modifiers).
Peer Group
The selection of an RTSR peer group is a critical factor in the establishment of an RTSR program. Broadly speaking, there are three categories of peer groups used by companies to benchmark RTSR:
- Multi-sector index—a broad-based index comprising multiple sectors such as the S&P 500 or two or more sectors within a broad-based index (e.g., S&P 500 excluding Financials).
- Single-sector index—an index comprising a single sector, such as an S&P sector index or non-S&P index such as the MSCI US REIT Index; other examples include the S&P 500 Utility Index or S&P 1500 Utility Index.
- Custom peer groups—the custom compensation benchmarking peers or custom performance peers.
Across the S&P 500, approximately one-half of companies use a peer group defined by a third party (e.g., S&P 500 or a sector index) and the other one-half use a customized peer group. Most Core companies (approximately 90%) use a focused peer group to benchmark RTSR by using either a single-sector index or custom group of companies. Notably, few Core companies, other than Materials companies, benchmark RTSR relative to multi-sector indexes. Non-Core companies, but especially consumer-oriented and information technology companies, are more likely to use a broad index such as the S&P 500.
Among Energy companies, a large majority benchmark against custom groups due to the differing impacts oil prices have on companies within various sectors in the overall industry. For example, a rise (or fall) in global oil prices will affect exploration and production companies differently than oil transportation companies or oil refining companies. Because Utilities are not subject to the intra-sector variances that impact Energy companies, they tend to benchmark to a single-sector index group (e.g., S&P 1500 Utilities or the Dow Utilities Index).
Peer group usage among Materials companies is particularly notable. Materials companies often have significant problems setting three-year financial goals due to the impact of commodity prices (or other outside forces), not unlike how Energy companies are impacted by the price of oil. The key difference with Materials versus Energy is the diversity of exogenous factors: Materials companies range from chemicals to paper to metals and mining companies, all serving myriad consumers and companies. This creates a significant challenge for identifying peers. Materials companies employing RTSR handle this challenge by moving to two ends of the RTSR spectrum: highly focused custom peer groups (63%) or a broad index such as the S&P 500 (37%). The inherent dissimilarities among Materials companies is likely why no S&P 500 Materials company benchmarks to the S&P 500 Materials Index companies.
Performance measurement methodology is varied across S&P 500 companies. Most (89%) with RTSR plans use percentile rank or numerical rank methods for benchmarking relative performance. Among these companies, 84% use the percentile rank method, and 16% a numerical rank method. Of those using the numerical rank method, roughly 50% are Energy companies. An alternative to the traditional ranking method is to measure the spread in TSR relative to a defined barometer of
performance, such as an index composite or the median TSR of a peer group. A company employing this method compares its TSR to that of the index composite figure and adjusts payouts based on the spread between the two figures. For example, if the company’s TSR is 15% and the index composite TSR is 5%, then the company beat the index by 10 percentage points. Assuming a payout of 2% of each percentile of outperformance, this would yield a 110% payout. This method is used by 11% of S&P 500 companies but is most common among REITs, with roughly 41% measuring RTSR against an index composite figure or peer group median. This method is less than 10% prevalent across non-REIT S&P 500 companies.
Other Design Elements
Pay/Performance Leverage
Unlike other design elements of RTSR plans, pay/performance leverage varies less across industries.
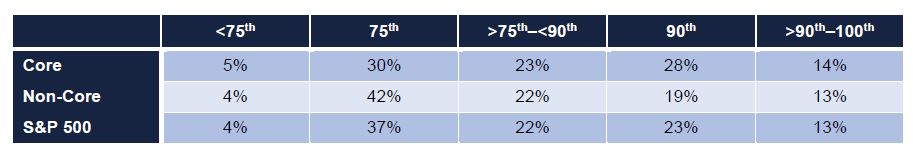
While the single most common maximum performance percentile remains at the 75th, it is a majority practice for companies to require performance to exceed this level. Nearly 60% of all S&P 500 companies require performance above the 75th percentile for RTSR plans to pay at maximum. The table below displays maximum performance percentiles required to achieve maximum payouts.
Negative TSR Cap
An increasing number of companies are imposing a “cap” on RTSR payouts when absolute TSR is negative. Compensation committees are increasingly uncomfortable with the possibility of above-target RTSR payouts when shareholder returns over the measurement period are negative. Shareholders and proxy advisors tend to favor capping awards at target when absolute TSR is negative. Twenty-three percent of S&P 500 companies now disclose caps on RTSR awards. Despite the attention negative TSR caps have received, prevalence increased just 3% from 2017.
Stock Price Averaging
Since RTSR is a naturally volatile incentive metric, companies commonly employ stock price averaging to smooth out the impact of daily stock price movements on relative performance at the beginning and end of the performance period. Among those companies disclosing averaging periods, approximately 60% use a period of one to four weeks (e.g., five trading days to 30 calendar days), with 20 trading or 30 calendar days being the most prevalent periods. Among the remaining companies, 25% use a period of five to ten weeks (e.g., 45 calendar or 25–30 trading days), and 15% a period of 90-calendar days or longer. [3]
Stock price averaging periods are commonly viewed as shareholder neutral, working neither in favor of nor against executives’ wealth interests. We tested this common perception in 2016 and found that while on average differences are indeed minimal, calculated TSR increasingly deviates from the shareholder experience as averaging periods are extended.
Above-Median Target Performance Percentile
Proxy advisors have subjected RTSR plans to an increased level of scrutiny and occasionally criticized companies for prescribing a target-level payout at median performance. In 2016, ISS went so far as to suggest that targeting median performance may not always be defensible. Despite this ISS criticism, 89% of S&P 500 companies target the peer group median (an increase of 3% targeting above-median performance). Among those targeting above the median, 40% target the 60th percentile and 43% the 55th percentile. In 2017, 52% targeted the 60th percentile and 35% the 55th, suggesting the growth in prevalence for target above-median performance is a result of a handful of companies now targeting the 55th percentile, up from the 50th percentile.
Discussion
The rise in RTSR prevalence has many roots, from the impact of say on pay to the increasing influence of proxy advisors. Companies finding it challenging to set reasonable long-term goals but feeling pressure by proxy advisors to implement performance-based long-term incentives may turn to RTSR as a non-controversial solution: it demonstrates a commitment to performance-based pay (i.e., “checks the box” for ISS), requires no goal setting (outside of relative ranking), is ostensibly objective, and is intended to align executive wealth with the shareholder experience. However, as a backward-looking metric, RTSR does little to motivate executive behaviors and is often viewed as a “lottery ticket” by participants—especially in instances where peer group companies poorly correlate with the sponsor. Regardless, RTSR is widely perceived as a “shareholder-friendly” metric, as it aligns with relative shareholder returns. Further, it is simple to add it as a performance measure to “check the box” for proxy advisors without the challenge of goal setting. This combination of factors also makes RTSR a challenging metric to remove.
Endnotes
1Total shareholder return is defined as the change in a company’s stock price plus reinvested dividends.(go back)
2For example, the share price of a health care equipment company reliant upon a certain precious metal (presumably provided by a Materials company) may exhibit sensitivities to the price swings of this commodity, but this will be one of many factors impacting this hypothetical health care company’s share price. The precious metal company’s share price will show much greater—and direct—sensitivity to the same price swings.(go back)
3Not all companies using averaging periods disclose them in proxy filings.(go back)