 Print
PrintDeb Lifshey is managing director at Pearl Meyer & Partners, LLC. This post is based on a Pearl Meyer memorandum by Ms. Lifshey. Related research from the Program on Corporate Governance includes The CEO Pay Slice by Lucian Bebchuk, Martijn Cremers and Urs Peyer (discussed on the Forum here).
It is hard to believe that eight years have passed since the enactment of the Dodd-Frank Act (“DFA”) and its many rules intended to regulate executive compensation. Among the most controversial of these rules is the requirement for public filers to disclose in their annual proxy statements the CEO’s total annual compensation, the total annual compensation of the median employee of the organization, and the ratio between the two, which has become known as the “CEO Pay Ratio.”
In the years since the DFA’s introduction, there have been hotly debated proposals, lobbying efforts, thousands of public comments, and numerous rounds of US Securities and Exchange Commission (SEC) interpretations, after which the rules finally became effective for proxies filed in 2018. Now, for the first time, we have information not only with respect to CEO pay (which was already disclosed in proxy statements), but about median employee pay.
Not surprisingly, there is substantial variation across companies and industries, with one of the highest ratios at approximately 5900:1 and many ratios at 0, in cases where CEOs did not take any reportable compensation for the year. It was expected that due to the variability in permitted methodologies, there would be little validity to peer comparisons. Also as expected, ample media coverage highlighted trends and outliers, often with alarming headlines. With the first year’s disclosure on the books for most companies, boards are now beginning to think about if and how they should evaluate their numbers, compare to their peers, and what—if any—actions they should take in year two.
Our research offers some interesting information for anecdotal discussion. However, as expected by many, including our firm, what is uncovered is not and should not be material to the philosophy or implementation of compensation, either for the CEO or the balance of the workforce.
—Deborah Lifshey Managing Director, Pearl Meyer
Introduction
As the 2018 proxy season ensued, Pearl Meyer and Main Data Group began collecting and analyzing extensive data on the inaugural CEO Pay Ratio disclosures in an effort to identify any trends, important comparisons, or unexpected results. While the rule presented a challenge for companies and was a significant change in compensation disclosure, our expectations in terms of the significance of the data on compensation programs were low.
Unfortunately, any clear legislative intent of the rule was not apparent, and when the SEC issued regulations on the rule, it specifically noted Congress’ lack of direction on the matter. In fact, the SEC’s release noted that in the absence of guidance from Congress, it surmised that the ratio was intended to provide shareholders another piece of information to understand compensation practices. It also stated that the ratio should not be used to facilitate peer-to-peer comparison and, noting the hardship in complying with this new rule, the SEC took a flexible approach in allowing companies to use vastly different methodologies, exceptions, and assumptions in calculating their ratios. [1]
Most companies believed that the exercise would be overly complicated, expensive, and provide little to no value to investors, especially for global companies whose workforces include international and part-time workers. [2] Similarly, they did not seem to buy into the claim that the pay ratio would provide incentive to keep executive compensation in check or change pay levels for lower-level employees.
On the other hand, some constituencies (primarily large unions and pension funds) argued the rule would be beneficial in that it would enable investors to judge if executive pay was excessive. They also asserted that if the ratio showed a large gap in pay between the CEO and the rest of a company’s employees, it would likely hurt productivity and increase turnover, ultimately affecting profitability and investor returns. The expectation was for a simple benchmark to help investors understand how a company pays its workforce and whether its executive pay is reasonable.
Despite the SEC’s guidance to avoid peer comparisons, along with the flawed assumptions inherent in doing so, media coverage was chock full of reports doing just that in Q1 and Q2. What most of the articles excluded, though, were the important differences in demographics and assumptions that went into computing the ratio. As the data has been amassed in this first year, it is likely clear to most directors, management teams, and HR professionals that benchmarking pay ratios holds little meaning. Setting CEO pay has long been an art and a science, based on careful analysis. Median employee pay is a new disclosure, but companies should not attempt to make broad-based pay decisions based on this number.
To arrive at these conclusions, Pearl Meyer and Main Data Group collected and studied more than 45 data points associated with each of the proxy filings of 2005 public companies as of the end of the second quarter 2018. Our research and analysis is summarized in the following pages.
Research Findings and Analysis
The CEO Pay Ratio
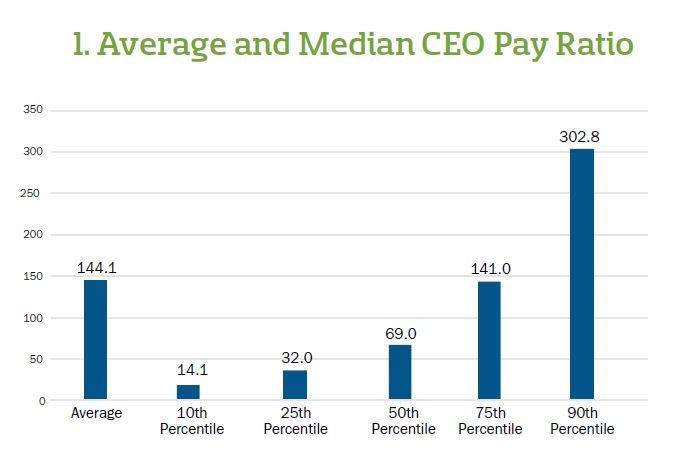
Overall, the pay ratio numbers were lower than forecasted, with an average of 144:1 and median of 69. There were quite a few cases where the ratio was at or near zero, which were outliers in cases where the CEOs either declined to receive pay or were paid a nominal sum. (As one might expect, in most of these cases the CEOs were large equity holders or founders of the company.)
Industry
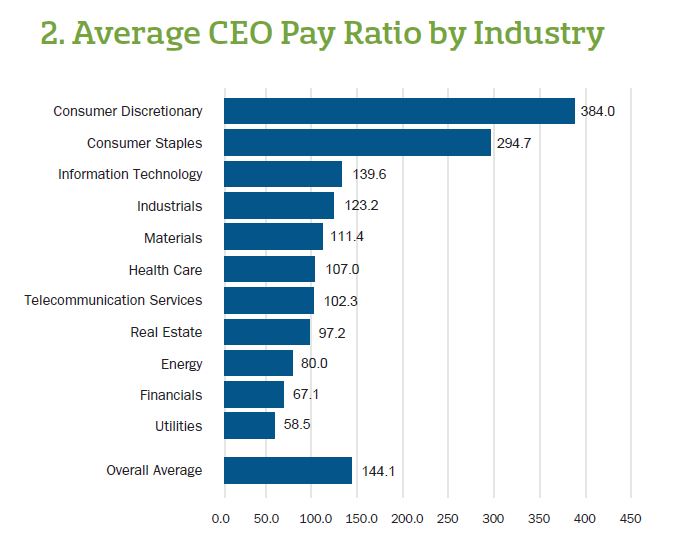
Industry has an important impact on the size of the ratio. Companies in the consumer discretionary and consumer staples sectors were understandably at the higher end at 384 and 295 on average. At the other end of the spectrum were energy, financials, and utilities, with averages ranging from 59 to 80.
Size of Company
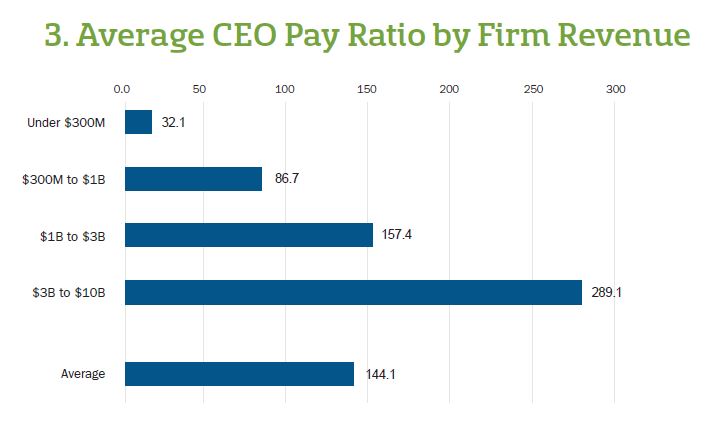
Our study tracked pay ratios by the size of the company as measured for this purpose in terms of revenue. There is a close correlation between the size of the pay ratio and revenue. For those companies under $300M, the average pay ratio was 32, as compared to those companies at $3B and higher, where ratios average close to 290. charts 1-3
Number of Employees
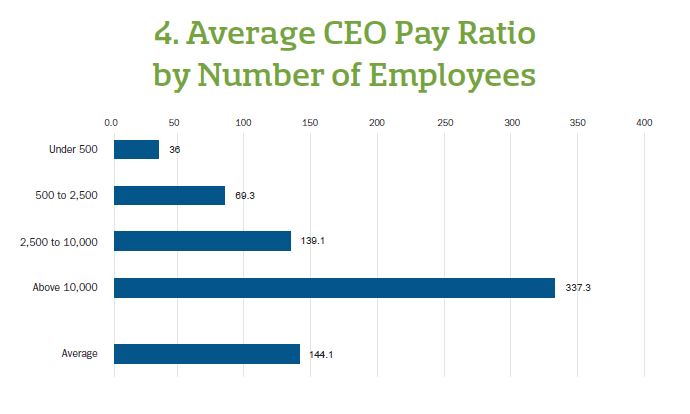
Similar to size of company, the larger the employee population, the larger the pay ratio. Those companies with a population under 500 had an average pay ratio of 36 compared to those with employee populations over 10,000 with average pay ratios of 337.
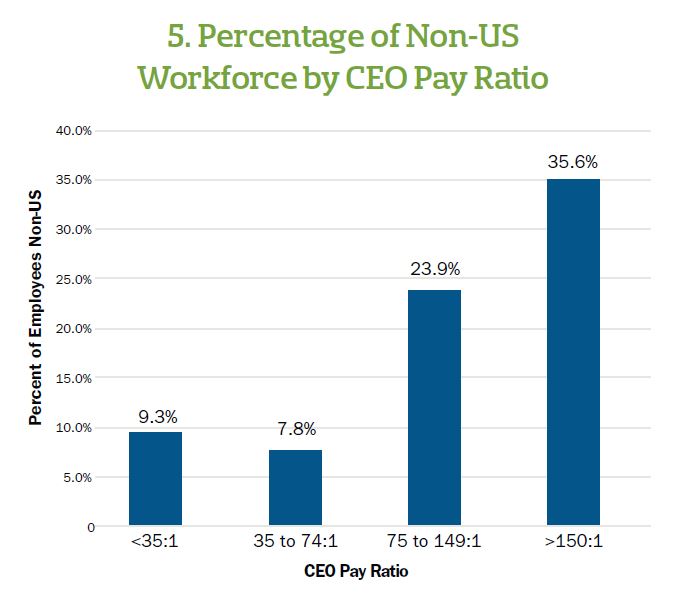
Non-US Employees
Not surprisingly, one of the strongest correlations and predictors of pay ratio was the percent of company employees located overseas. The lowest pay ratio band had roughly 9% of its employees located outside of the US, while those companies with a pay ratio of over 150 had more than a third of their workforce overseas. The argument against doing peer-to-peer comparisons is even stronger when one takes this impactful element into consideration.
Company Financial Performance
Advocates of the CEO Pay Ratio disclosure seemed to be of the mindset that the ratio would correlate with company performance. However, our study finds no such correlation. In fact, the lowest average three-year total shareholder return (TSR) was associated with the lowest pay ratio band. While the highest average three-year TSR correlated with the band of ratios between 35 and 74, it then dropped off as the ratio increased.

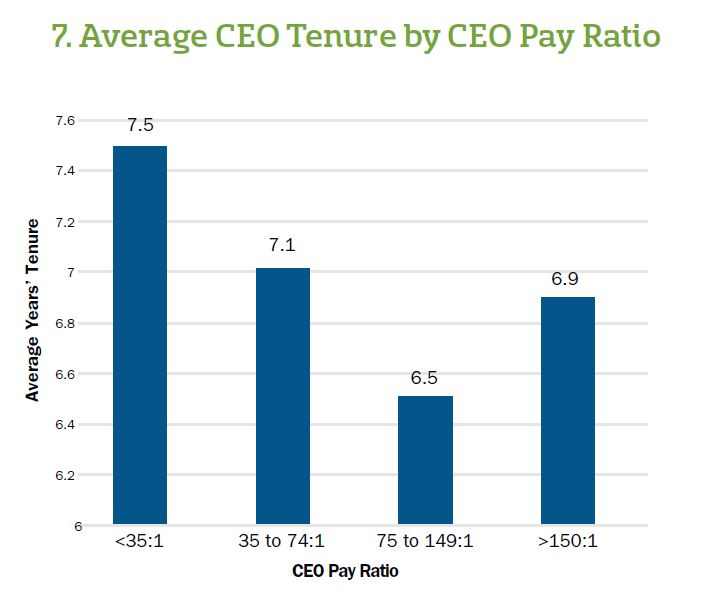
Average CEO Tenure
Some surmised that the longer a CEO was in the job, the higher the ratio might be, as CEO pay tends to rise over time. Our research found very little correlation between CEO tenure and pay ratio, however, as the average CEO tenure is fairly consistent across all companies. Companies with the lowest pay ratios (under 35) have CEOs with average tenure at 7.5 years, while those on the higher end of the pay ratio range have an average CEO tenure of 6.9 years.
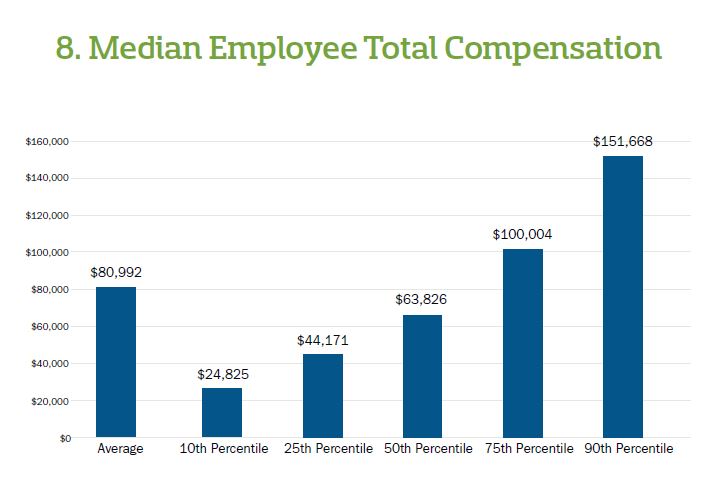
Median Employee Pay
The story that most companies worried about was not so much the pay ratio, as it was the disclosure of the pay of the individual identified at median. To the surprise of many, this number came in on average much higher than anticipated, at approximately $81,000, with $25,000 at the 10th percentile. The lowest reported median was roughly $2,000 and the highest was approximately $965,000.
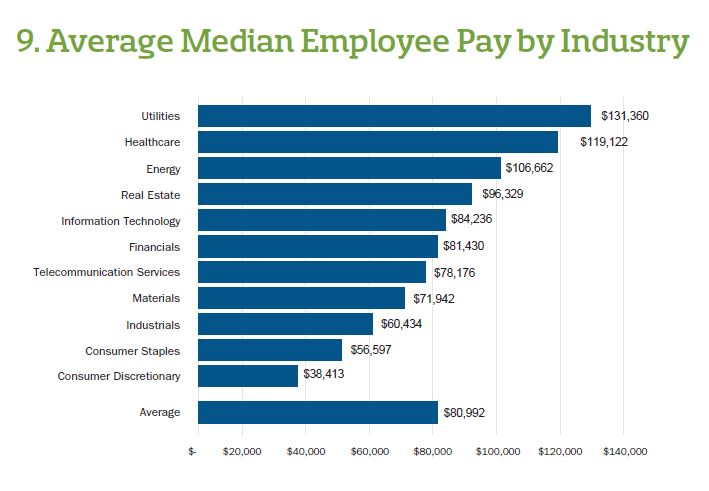
Industry
Like the pay ratio, median employee pay varied considerably by industry. The utilities and healthcare industries led with average median pay at about $119,000 to $131,000. The industries with higher CEO Pay Ratios (e.g., consumer discretionary and staples) also had the lowest median worker averages at around $38,000 to $57,000, indicating that the median employee pay number likely had an important influence on the ultimate CEO Pay Ratio. This would make sense as median employee pay (the denominator in the ratio) is generally expected to be more variable than CEO pay (the numerator).
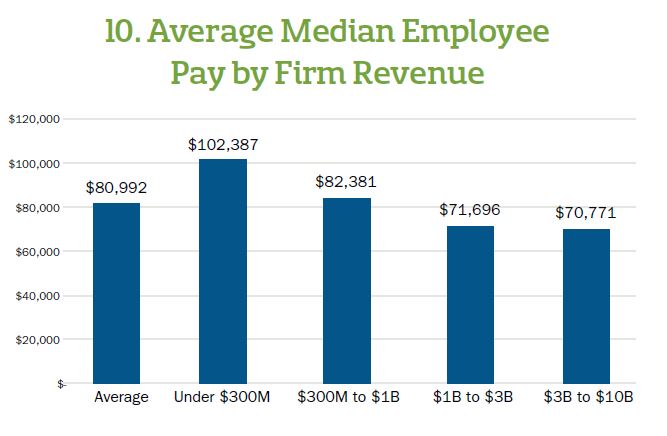
Size of Company
Median employee pay was also highly correlated with company size (determined by revenue) but in the opposite direction from the pay ratio. That is, the smaller the company, the higher the pay. Companies under $300M had an average median pay of just over $100,000, while those at the largest companies averaged just over $70,000. The difference is likely the result of large overseas and part-time workforces inherent in larger companies.
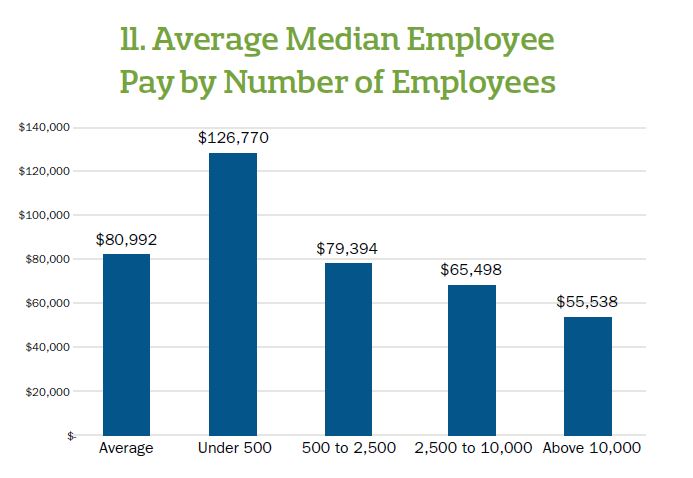
Number of Employees
Median employee pay had a similar correlation with number of employees as it did with the size of the company. That is, the smaller the employee base, the higher the median pay. For companies with fewer than 500 employees, median pay was roughly $127,000, but where there were more than 10,000 workers, median employee was less than half that amount at around $56,000. Again, the difference is likely the result of large overseas and part-time workforces generally found in larger companies.
Methodologies in Calculating the Ratio
As noted, the SEC permitted a wide variety of assumptions and methodologies to choose from in calculating the ratio, adding another complication to the supposed benefits of comparing ratios across companies.
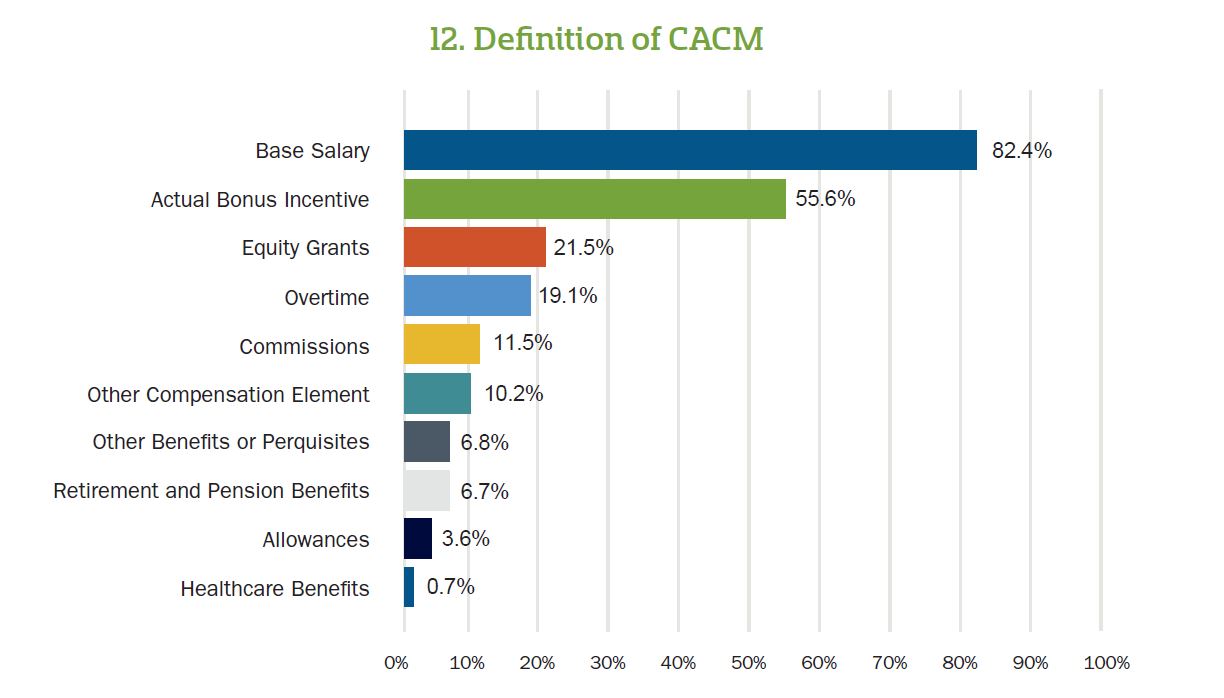
Consistently Applied Compensation Measures
(“CACM”) Companies were permitted to use a proxy for Summary Compensation Table (“SCT”) Annual Total Compensation in an effort to reduce the cost and expense of identifying the median paid employee. The CACM is a methodology that enabled companies to pick certain elements of compensation that would generally represent the distribution of compensation over all employees to identify the median employee. (Once the median was identified, however, the Annual Total Compensation methodology was required for that one individual). Almost all companies (82%) included base salary and about 56% also included bonus or other annual incentives. Almost 20% of companies included overtime pay. Only around one in five companies included equity grants, which reflects the fact that stock-based awards are not universally granted at most companies. Most other compensation elements (e.g., commissions, allowances, retirement/ pension, and other benefits/perquisites) are only sporadically included.
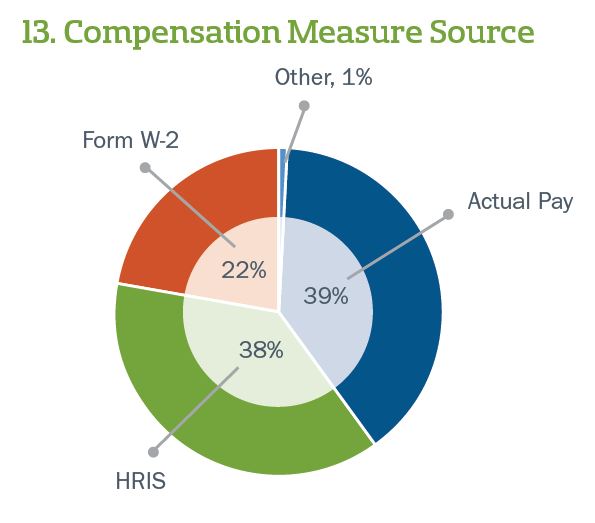
Data Sources
Collecting even the CACM data for large multi-national companies without unified payroll systems presented a huge challenge. The SEC did provide some relief in late season 2017 guidance indicating that the CACM could be derived from various sources, including reasonably available internal or tax records. As such, companies disclosed pulling data in various ways, with use of “actual pay” (presumably from payroll data) and human resource information systems (“HRIS”) being the most frequently used sources (each at around 40%), while W-2 records were used in 22% of cases (usually domestic-only companies).
Adjustments
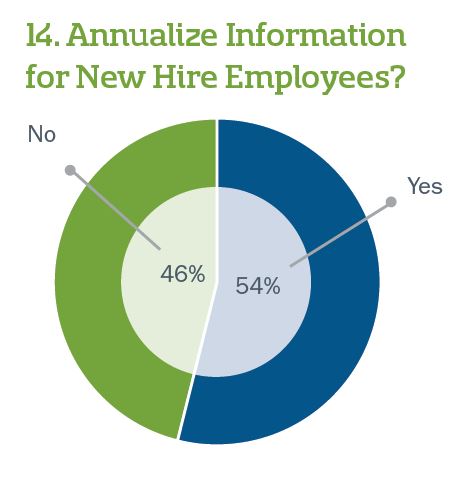
Annualization: The rules permit companies to annualize pay for those who were only hired for a partial year, but only 54% of companies report using this methodology. In our experience, many companies chose not to do so because it complicated the process and/or it did not influence the ratio in any material respect.
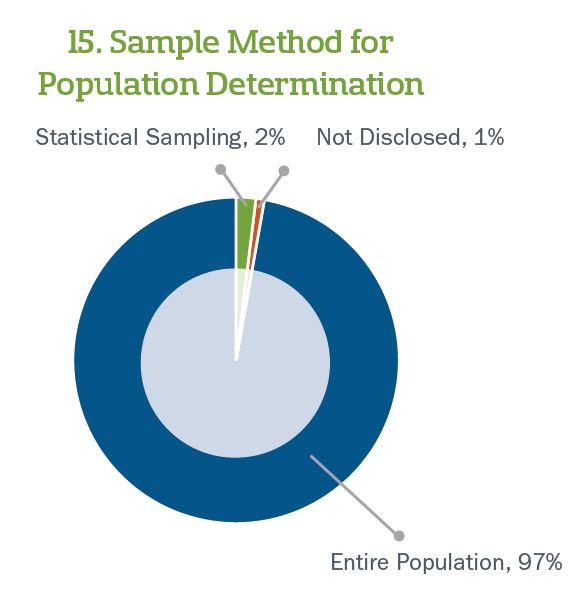
Statistical Sampling: While many companies initially intended to statistically sample their population to narrow the data collection exercise, with the SEC’s interpretive guidance creating greater flexibility on payroll sources and assumptions, most companies decided not to sample their populations. The prevalence of companies disclosing the use of statistical sampling was very low, at around 2%, and really only used for companies with over $1B in revenue and more than 10,000 employees.
COLA: While applying cost of living allowances (“COLA”) may have reduced the pay ratio, its benefits were overshadowed by the tandem requirement to provide an alternative ratio without the application of COLA. As such, only 1% of companies applied this adjustment. Most of our clients were averse to this option because it meant running the methodology two ways, along with disclosing two different ratios, which may have detracted from the favorable ratio derived with the COLA adjustment.
Exemptions
Data Privacy: As anticipated, not one company as of the end of Q2 2018 reported using the data privacy exemption to exclude certain overseas employees. While the SEC permitted the exemption, it required companies to jump through a series of hoops and, at the end of the day, companies were able to use workarounds to capture employee data without associations to employee names, thus circumventing most privacy laws.
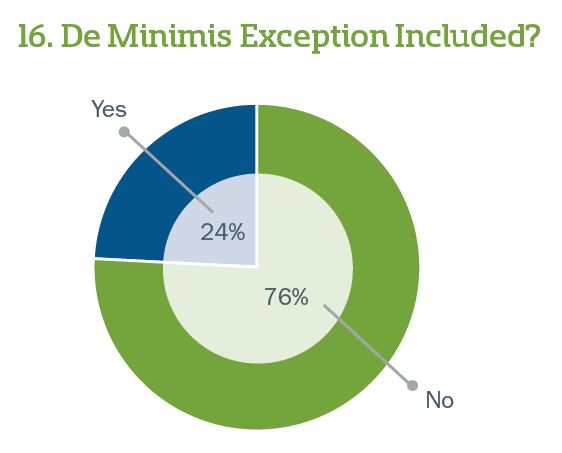
De Minimis: The SEC rules permit companies to exclude up to 5% of non-U.S. employees from consideration in identifying the median employee. Our research indicates that about 25% of companies took advantage of this exemption. In our experience, some companies did not avail themselves of this exception because: (1) they had fairly easy access to their non-U.S. data; (2) including overseas employees led to a more desirable outcome; (3) they didn’t want to include the extra disclosure associated with the exemption (e.g., total number of employees excluded in each jurisdiction); and/or (4) they had an entirely U.S.-based population.
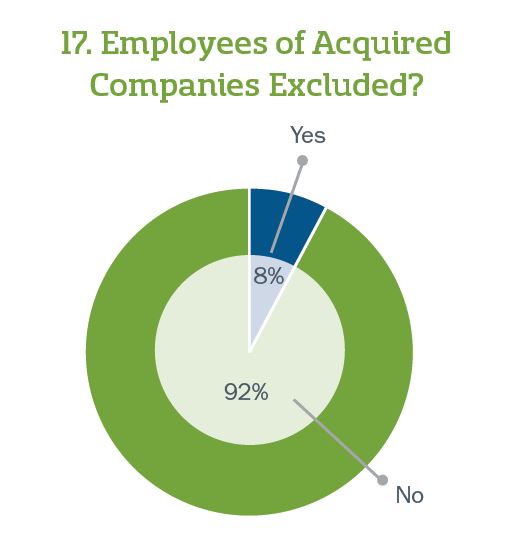
Acquisitions: The rules allow but do not require companies to exclude employees acquired in the past fiscal year and roughly 8% of the companies studied took advantage of this exclusion. Based on our experience, many companies did not want to take advantage of this exclusion because: (1) it resulted in increased disclosure, and (2) it would have required the company to re-identify the median employee in the immediate subsequent year, rather than in three years.
Narratives
As anticipated, almost all disclosures have been brief (at around three paragraphs) and include only the essential data needed to comply with the rule. In addition, most disclosures were not placed within the compensation discussion and analysis (CD&A) itself but, rather, after the last compensation table. The longest disclosure was just over 800 words, while the shortest was a mere 60. We anticipate disclosures may trend longer in the second year of filings if companies feel it necessary to discuss how their ratios compare with those of their peers or industry.
The SEC’s regulations implementing the pay ratio requirement provided public companies tremendous leeway to calculate and disclose. While some companies struggled with whether or not to provide a supplemental pay ratio using a different methodology from the required rules, our study revealed that very few—approximately 10%—filed a supplemental ratio.
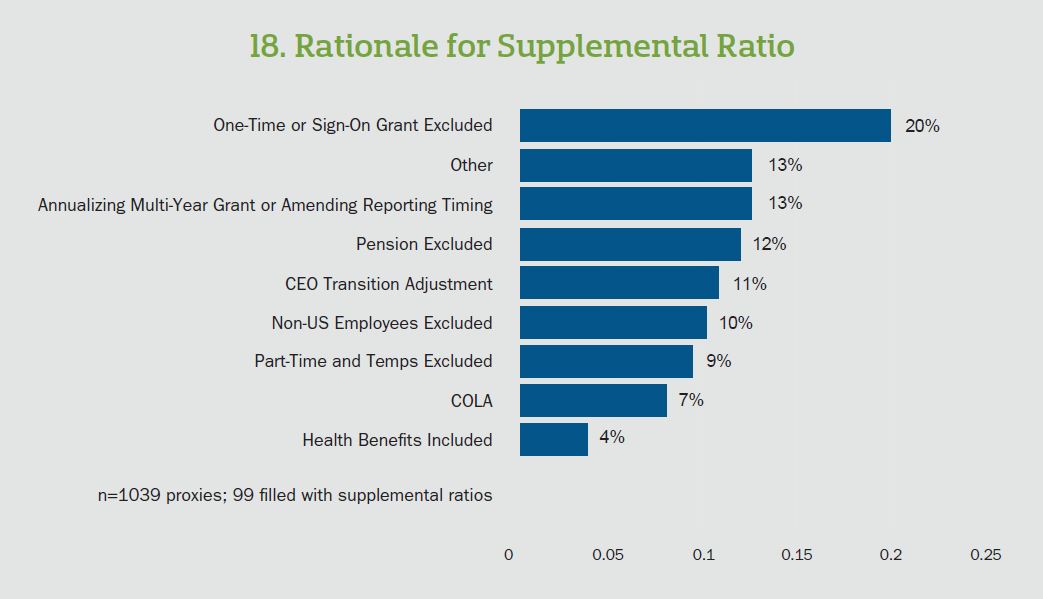
When we examined the disclosure narratives of the 1,039 proxies that were available in mid-April, those who chose to disclose a supplemental figure were able to show a significantly lower ratio (on average, 42% lower) in many cases. The desire to “smooth out” the impact of one-time or multi-year grants to a CEO was the most commonly occurring reason to provide a supplemental ratio. The most profound decrease from the required ratio occurred when companies provided a supplemental ratio that excluded part-time and seasonal employees. Interestingly, a number of companies provided a supplemental ratio that was greater than the required ratio, mostly likely to avoid a drastically increased ratio in 2019.
The stated rationale for filing supplemental ratios fell into nine general categories.
Most companies took a “less is more” approach to the disclosure overall and avoided supplemental disclosures. Some boards we spoke with viewed the additional disclosure as a double edged sword—while, overall, the populist messaging of a lower ratio may have been a short-term goal, any benefit reaped from the lower ratio was surely overshadowed by the required ratio, as well as possible negative inferences one may draw from the alternate ratio discussion (e.g., “If we don’t pay attention to part-time or overseas employees, or CEO mega-grants, our ratio looks better.”). However, we anticipate that supplemental ratios may become more prevalent in 2019 filings when year-over-year company-specific comparisons are under the microscope.
Key Takeaways
Many companies spent a lot of time and money— not just this year, but also in the years since the DFA’s introduction—thinking about methodology and approach and planning for this disclosure. The SEC has estimated that cost to have been more than $1B this year alone. [3] The rule created an unfair burden on larger multinational companies, many of which had to assemble large teams and outside consultants to track and collect data. (Anecdotally, we know some smaller domestic companies were able to complete the process in less than a week.)
Not surprisingly, at the end of the day, most companies tried to keep the actual calculation as simple as possible within the parameters of the SEC rule, and spent more time thinking about communication and disclosure. Fortunately, most companies will be able to use the same median pay figure for the next two years, cutting down on the near-term data gathering and number crunching exercises.
Overall, we learned a few things that, while interesting, are not likely to influence pay practices:
- Pay ratios seemed to be more influenced by median employee pay than CEO pay.
- Pay ratios were not as high as anticipated (144:1 on average) and median employee pay was not nearly as low as anticipated (approximately $81,000 on average).
- Pay ratios were closely correlated with industry, with those in consumer discretionary at the top end (384:1) and those in utilities at the bottom end (59:1).
- Pay ratios were correlated with revenues and employee population (the higher the revenues/more employees, the higher the ratio).
- Median employee pay was inversely correlated with revenues and employee population (the higher the revenue/more employees, the lower the average median compensation).
- The inclusion of a large overseas or part-time workforce had a big impact on median employee pay and the pay ratio.
- There is no discernable correlation between a firm’s TSR-based financial performance and the CEO Pay Ratio.
Reception by Investors and the Press
Many were surprised—and relieved—to learn prior to proxy season that the biggest shareholder advisory services would not take into account pay ratio disclosure in issuing their recommendations.
ISS indicated that while they would display the median employee pay figure and the CEO Pay Ratio in research reports, it would not have any policy implication (i.e., it would not impact vote recommendations). However, ISS also indicated that it would continue to assess the CEO Pay Ratio data as it becomes available and will continue to assimilate feedback from investors on the usefulness and application of this new disclosure, leaving the door open for its treatment in 2019.
Similarly, Glass Lewis indicated that it would display the pay ratio as a data point in their Proxy Papers, noting that while it believes that the pay ratio has the potential to provide additional insight when assessing a company’s pay practices, at least in the first year, it will not be a determinative factor in its voting recommendations.
As to institutional investors, we have heard some constituencies say that the CEO Pay Ratio disclosure is a factor that could be valuable in making informed voting decisions. But not one institutional investor has ultimately admitted to using the CEO Pay Ratio outcomes in their voting decisions thus far. Rather, it seems that investors who are truly concerned with executive pay already express concerns through their say-on-pay opportunities, where they are asked to vote for or against the executive pay program generally or can even vote down directors for poor pay practices. In this first year, CEO Pay Ratio discussions were simply not on many, if any, investor radar screens.
However, as expected, the pay ratio provided ongoing storylines for reporters focusing on executive pay. News reports abounded— particularly in local publications—with empirical data comparing local businesses and industries in general. It seems the median employee pay figure, possibly a more interesting number at the local level, was as popular as the ratio itself. What we discovered in speaking with reporters is that few truly understood the nuances and the flexibility that the rule afforded in reporting the numbers. Once they understood the complex calculations, they were less likely to focus on company peer-to-peer comparisons.
Many have been hopeful that the disclosure will, over time, close the gap between median employee and CEO pay, but we do not believe boards or management teams should be relying on pay ratio data to drive executive compensation or employee pay decisions.
Reception by Employees
The “just the facts” approach to the disclosure, along with the strategic placement of the narrative outside of the CD&A, seemed to prove effective. While the media picked up headlines, reactions from the public were minimal. Furthermore, concerns about workforce blowback—not about the level of CEO pay, but about the level of median employee pay—did not seem to materialize (at least not yet).
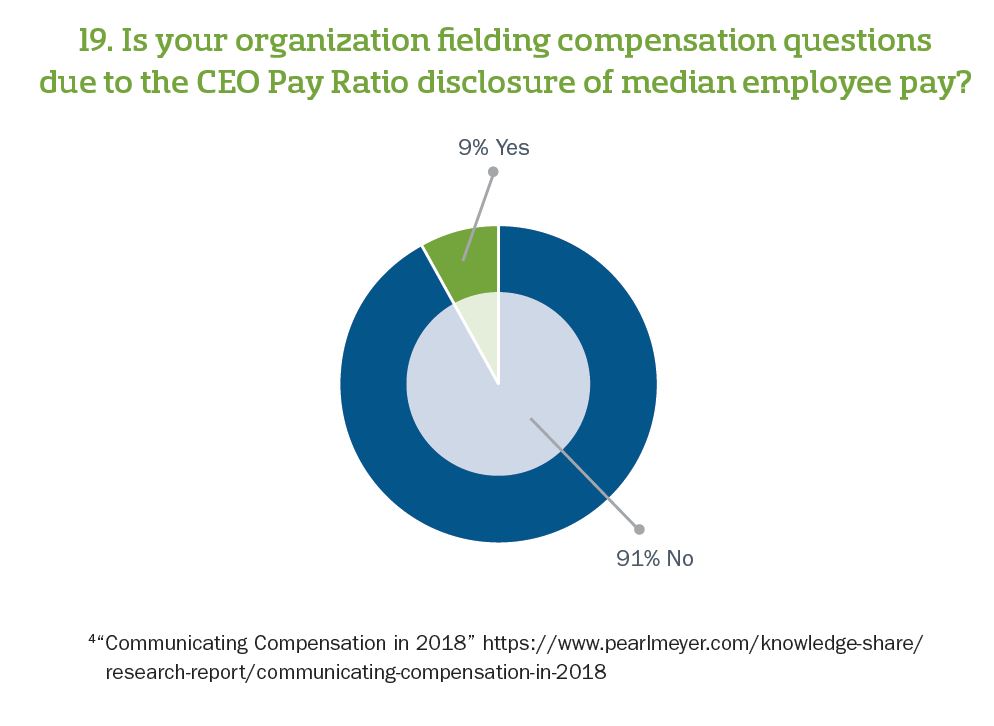
In summer of 2018 [4], Pearl Meyer conducted a survey on communicating compensation to understand how the CEO Pay Ratio and other hot-button issues like gender pay equity may be influencing pay discussions, as well as to look at the degree to which companies are proactively communicating about some of these emerging pay topics. The survey showed most companies aren’t using the CEO Pay Ratio as burning platform to change the nature of their communications, although a few proactive companies are using it as an opportunity to make changes.
Based on this first year, it is likely that from a disclosure standpoint, most companies will aim for consistency and keep CEO Pay Ratio narratives short, sweet, and buried. It’s a strategy that worked well.
However, it would be unwise for companies to ignore the current groundswell of public debate on pay. In light of today’s emotionally-charged backdrop, companies should continue to focus efforts on bolstering compensation education to ensure that executives and employees understand how their pay is determined.
Lessons for 2019
While we endured eight years’ worth of anticipation that the pay ratio disclosure might be tabled, the matter has been settled and it appears here to stay. Fortunately, the worst is behind us in terms of initial time and money investments.
Nonetheless, it is yet another data point that directors and management teams must make sure they fully understand. Conducting peer benchmarking on this number is an exercise that must be approached carefully, with caveats based not only on company demographics, but also on the many methodological assumptions undertaken by each company that simply cannot be normalized. Further, directors would be ill-advised to try to make critical compensation decisions based on the ratio itself.
While the issues of income disparity (presumably at least part of the basis for this rule) are not going away and will not be solved by this disclosure, there should be some sensitivity to employee perceptions and morale. Proper communication about how employee compensation is determined and managed is likely the best strategy to address concerns resulting from the ratio.
With regard to management, the best move is to stay the course. Maintain the approach undertaken prior to such disclosures. In other words, boards should continue to set CEO pay based on sound governance principles and a philosophy that aligns compensation with the company’s long-term business strategy.
The complete publication, including Appendix, is available here.
Endnotes
1https://www.sec.gov/rules/final/2015/33-9877.pdf(go back)
2For purposes of the rule, the actual compensation for a part-time worker must be included in the calculation of the median employee; companies are not allowed to use a full-time employee equivalent figure.(go back)
3https://www.sec.gov/rules/final/2015/33-9877.pdf(go back)
4“Communicating Compensation in 2018” https://www.pearlmeyer.com/knowledge-share/research-report/communicating-compensation-in-2018(go back)