 Print
PrintAlexander “Sasha” Aganin is vice president and John Gould is senior vice president at Cornerstone Research. This post is based on their Cornerstone memorandum.
Executive Summary
Securities class action activity remained at near record levels for both core and M&A filings. Driven by a large number of mega filings, market capitalization losses surpassed $1 trillion. Last year also saw more companies on U.S. exchanges facing a greater threat of securities litigation than in any previous year.
Number and Size of Filings
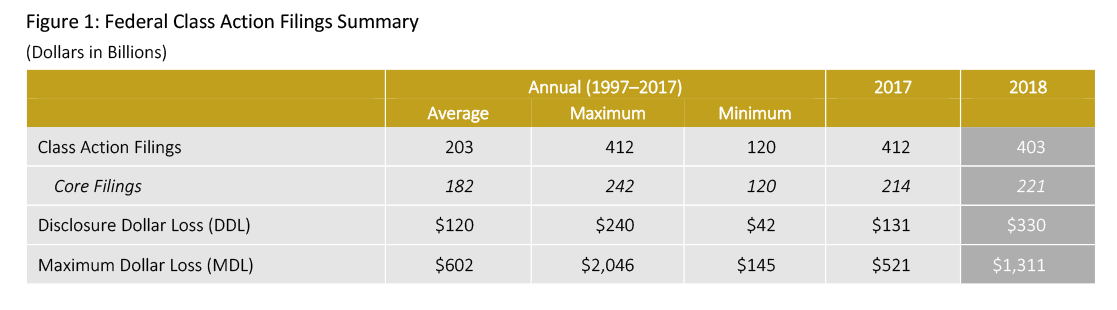
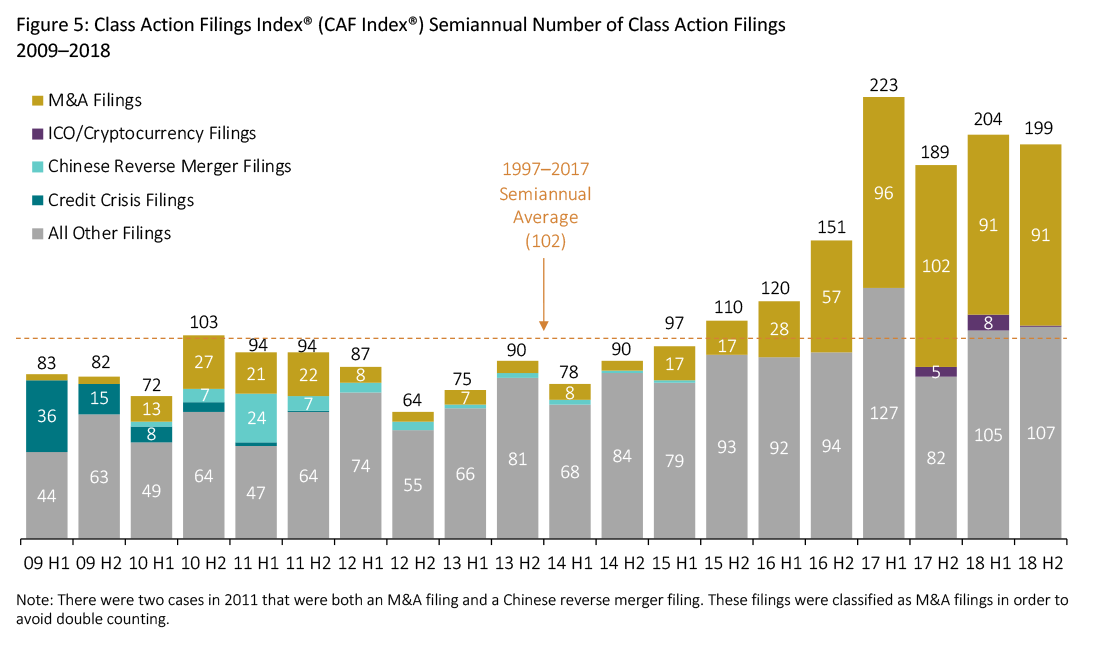
- Plaintiffs filed 403 new federal class action securities cases (filings) in 2018. This was 2 percent lower than 2017, but still nearly double the 1997–2017 average. “Core” filings—those excluding M&A filings—increased to the fifth-most on record.
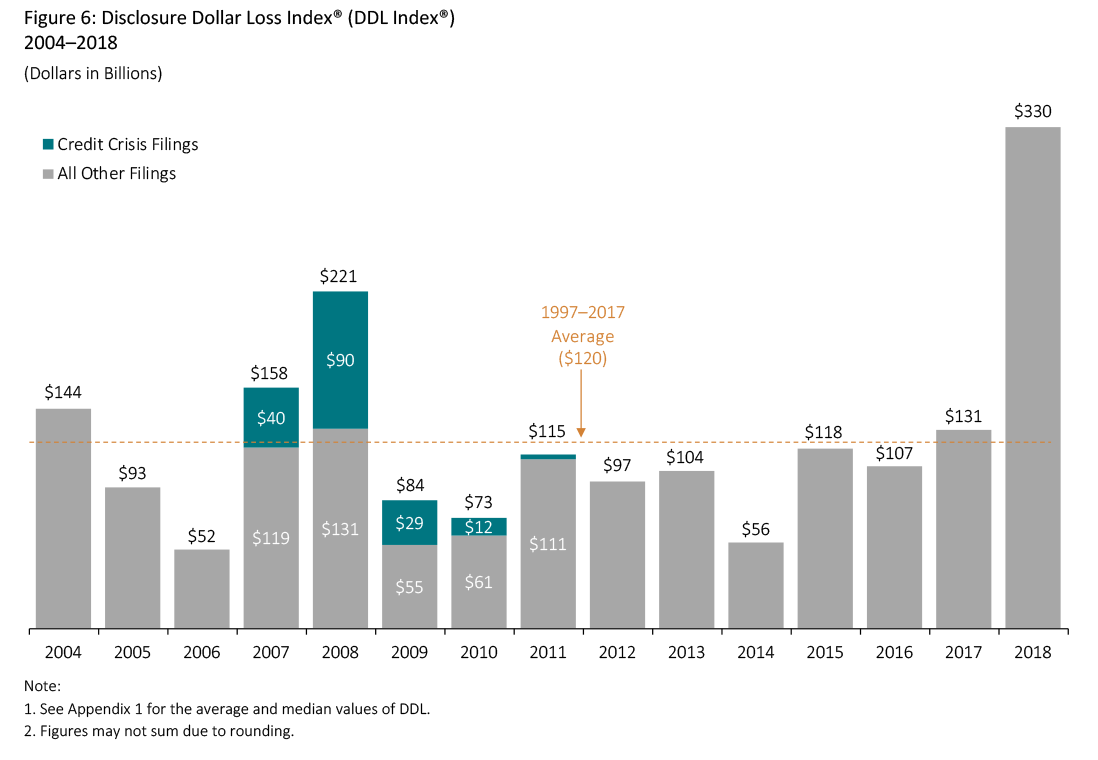
- Disclosure Dollar Loss (DDL) increased by 152 percent to $330 billion, the highest on record.
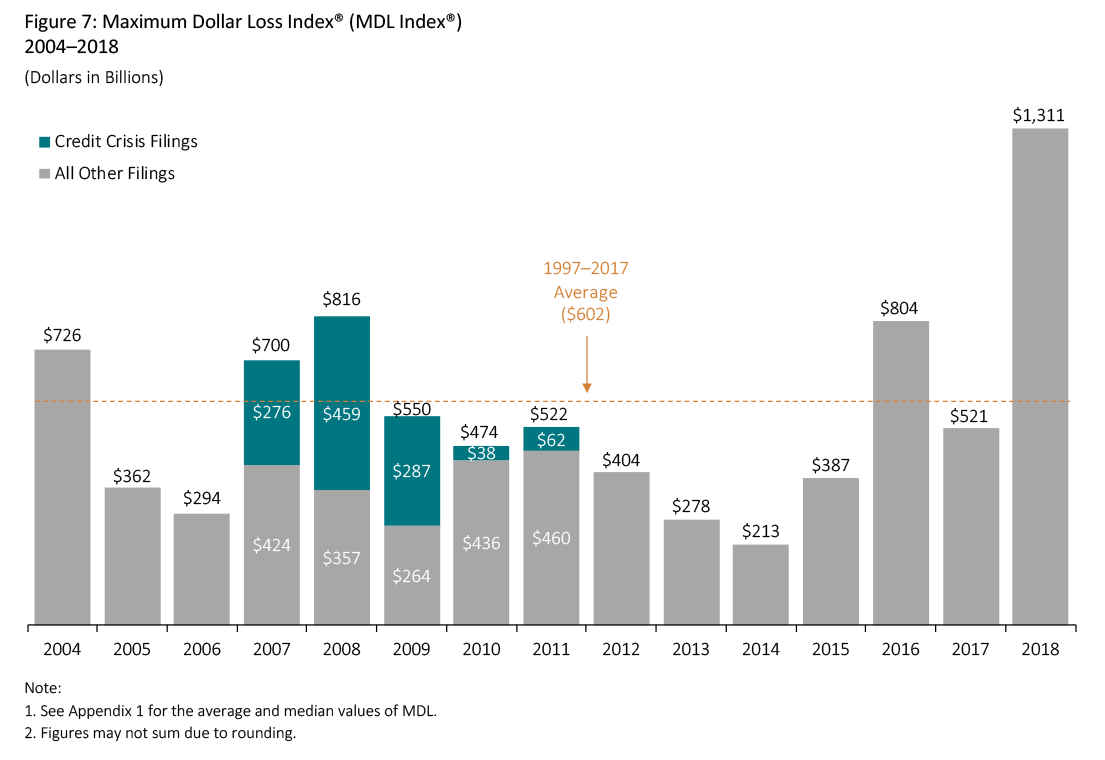
- Maximum Dollar Loss (MDL) also grew by more than 150 percent to $1,311 billion in 2018.
- In 2018, 17 mega filings made up 64 percent of DDL and 27 mega filings made up 73 percent of MDL. Both of these percentages are above historical averages. Filings with a DDL of at least $5 billion or an MDL of at least $10 billion are considered mega filings.
Other Measures of Filing Intensity
- In 2018, the likelihood of litigation involving a core filing for U.S. exchange-listed companies was greater than in any previous year. This measure reached record levels because of both the heightened filing activity against public companies and an extended decline in the number of public companies over the last 15 years.
- One in about 11 S&P 500 companies (9.4 percent) was sued in 2018. Companies in the Health Care sector were the most frequent targets of new core filings.
Key Trends
S&P 500 firms were twice as likely to be the subject of core filings than U.S. exchange-listed companies, even as companies on U.S. exchanges were more likely to be sued in 2018 than in any previous year. Although core filings against non-U.S. issuers dipped for the first time since 2013, their litigation rate exceeded the overall rate for all companies listed on U.S. exchanges.
U.S. Companies
- In 2018, 4.5 percent of U.S. exchange-listed companies were the subject of core filings.
- Core filings against S&P 500 firms in 2018 occurred at a rate of 9.4 percent, the highest percentage since 2002.
Non-U.S. Companies
- The number of core filings against non-U.S. companies decreased for the first time since 2013.
- However, the likelihood of a core filing against a non-U.S. company increased from 4.6 percent to 4.8 percent from 2017 to 2018.
By Industry
- Core filings against companies in the Technology and Communications sectors combined increased to 50 in 2018, up 56 percent from 2017.
- The Consumer Non-Cyclical sector again had the greatest number of filings, even after declining to 68 in 2018 from 85 in 2017. Within this sector, filings against biotechnology, pharmaceutical, and healthcare companies also decreased.
By Circuit
- There were 71 and 69 core filings in the Second and Ninth Circuits, respectively. Ninth Circuit core filings were at historically high levels.
- The number of core filings decreased in the Third Circuit to 26 in 2018 from 35 in 2017. Seventh Circuit core filings increased to 13 from four.
M&A Filings
- Federal filings of class actions involving M&A transactions with Section 14 claims but no Rule 10b-5, Section 11, or Section 12(2) claims decreased to 182 from 198.
- The Second and Third Circuits accounted for nearly half of all M&A filings in 2018, as each circuit experienced the highest number since this report began separately recording them in 2009.
- M&A filings had a much higher rate of dismissal (86 percent) than core federal filings (47 percent) from 2009 to 2017.
Filings by Lead Plaintiff
- For 2018 filings, individuals were appointed lead plaintiff more often than institutional investors, a pattern that has persisted since 2013.
Appointment of Plaintiff Lead Counsel
- The growth in core filings over the last six years has coincided with the activity of three plaintiff law firms that have increasingly been involved in securities class actions. (page 36)
New Developments
- U.S. Supreme Court decision in Cyan Inc. v. Beaver County Employees Retirement Fund
- Initial coin offerings (ICOs): SEC v. Blockvest LLC et al.
- Negligence standard in M&A filings: Varjabedian v. Emulex Corp. et al.
- Administrative law judge appointments: U.S. Supreme Court decision in Lucia v. Securities and Exchange Commission
Featured: Annual Rank of Filing Intensity
Filing activity continued unabated in 2018. On several dimensions, the last three years—particularly 2017 and 2018—have been more active than any previous year. The heightened levels of filings have occurred despite a lack of financial market turbulence that often accompanied substantial filing activity in prior years.
The total number of filings in 2018 was the second-highest on record after 2017. Filings against companies with large market capitalizations surged to near record highs. The combination of numerous filings and the frequency of filings involving larger companies led to higher amounts of market capitalization losses in dispute.
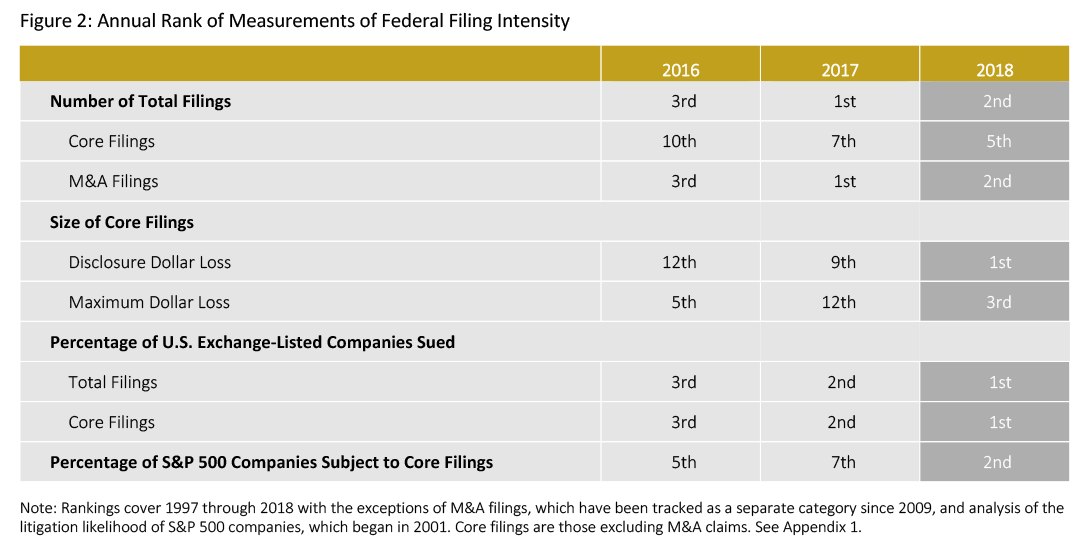
Note: Rankings cover 1997 through 2018 with the exceptions of M&A filings, which have been tracked as a separate category since 2009, and analysis of the litigation likelihood of S&P 500 companies, which began in 2001. Core filings are those excluding M&A claims. See Appendix 1.
Featured: State Court 1933 Act Filings
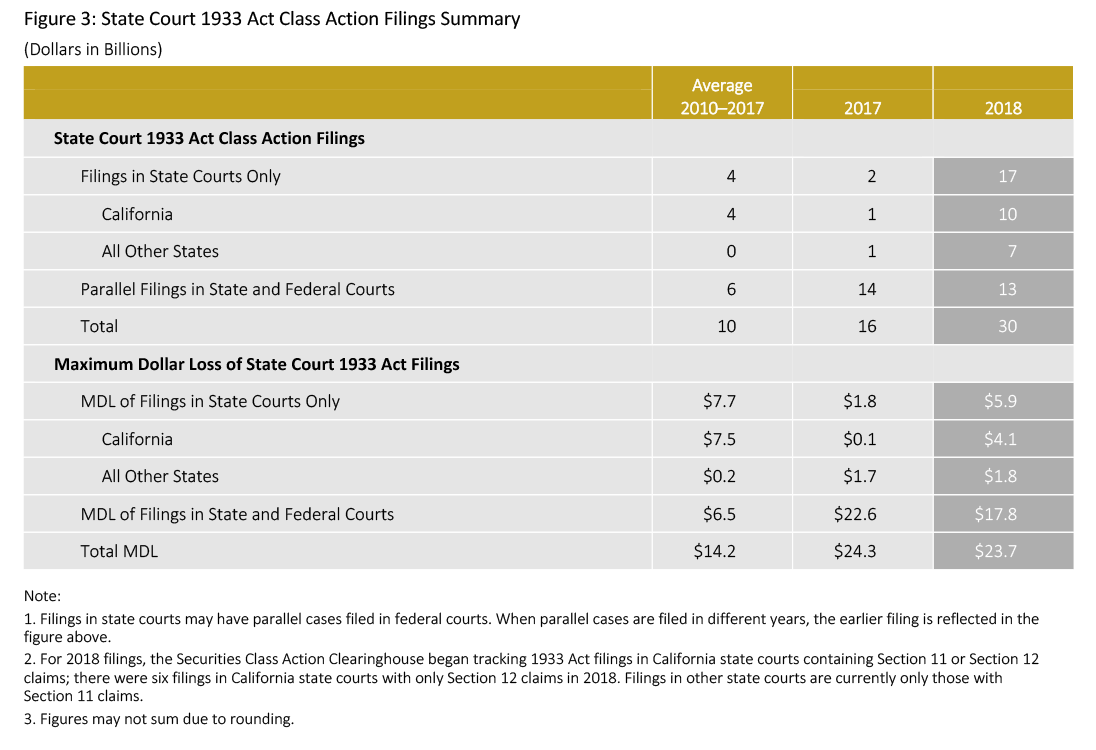
Securities class action filings with Securities Act of 1933 (1933 Act) claims have increased in state courts. Many of these filings have parallel federal court proceedings. Beginning with this report, 1933 Act filings in state courts other than California are also presented.
- From 2010 through 2018, plaintiffs filed at least 108 1933 Act cases in state courts (state 1933 Act filings).
- Although the number of state 1933 Act filings in 2018 increased substantially relative to 2017, the total MDL of state 1933 Act filings remained relatively flat.
- The changes seen in 2018 compared to previous years coincided with the U.S. Supreme Court’s ruling in March 2018 in Cyan Inc. v. Beaver County Employees Retirement Fund.
- About 43 percent of all state 1933 Act filings in 2018 had a parallel action in federal court.
- Among the 17 state 1933 Act filings in 2018 without a parallel action in federal court, 10 were in California state courts, five were in New York state courts, and two were in other state courts.
Number of Federal Filings
- Plaintiffs filed 403 new federal securities class actions last year, making 2018 the second-largest year on record, trailing only 2017.
- The number of filings in 2018 was 99 percent higher than the 1997–2017 average.
- The 182 M&A filings in 2018 were the second-largest number since 2009 (when this report began separately identifying these filings).
- Core filings—those excluding M&A filings—were the highest since 2008, when filings surged due to the volatility in U.S. and global financial markets.
- The growth in core filings over the last six years has coincided with the activity of three plaintiff law firms that have increasingly been involved in securities class actions. See additional discussion at page 36.
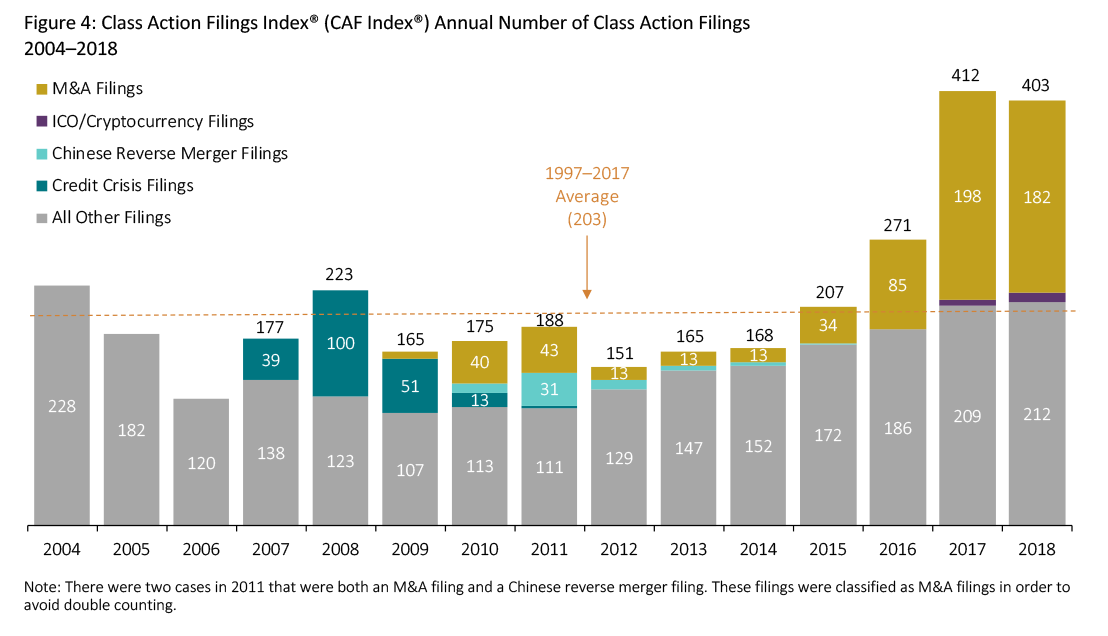
- Total filing activity decreased by 2 percent in the second half of 2018 compared to the first half.
- The pace of both M&A and core filings was comparable in the first and second halves of the year.
- ICO or cryptocurrency filings first appeared in the second half of 2017. There were nine such filings in 2018 with eight in the first half of the year and only one in the second half.
Market Capitalization Losses
Disclosure Dollar Loss Index® (DDL Index®)
This index measures the aggregate DDL for all filings over a period of time. DDL is the dollar value change in the defendant firm’s market capitalization between the trading day immediately preceding the end of the class period and the trading day immediately following the end of the class period. See the Glossary for additional discussion on market capitalization losses and DDL.
- The DDL Index reached a record $330 billion in 2018, 174 percent above the 1997–2017 average.
- The dramatic increase in DDL was driven by mega filings, which accounted for 64 percent of the DDL Index in 2018 compared with 36 percent in 2017.
- Both average and median DDL per filing in 2018 were also the highest on record. See Appendix 1 of the complete publication.
Maximum Dollar Loss Index® (MDL Index®)
This index measures the aggregate MDL for all filings over a period of time. MDL is the dollar value change in the defendant firm’s market capitalization from the trading day with the highest market capitalization during the class period to the trading day immediately following the end of the class period. See the Glossary for additional discussion on market capitalization losses and MDL.
- The increase in MDL was driven by mega filings, which increased to 27 in 2018, compared to 14 in 2017. In addition, the stock market decline in the latter part of the year magnified market value losses over class periods for many filings.
- The MDL Index reached over $1.3 trillion in 2018, surpassing 2008 to become the third-largest year on record. Relative to 2017, the MDL Index increased by 152 percent.
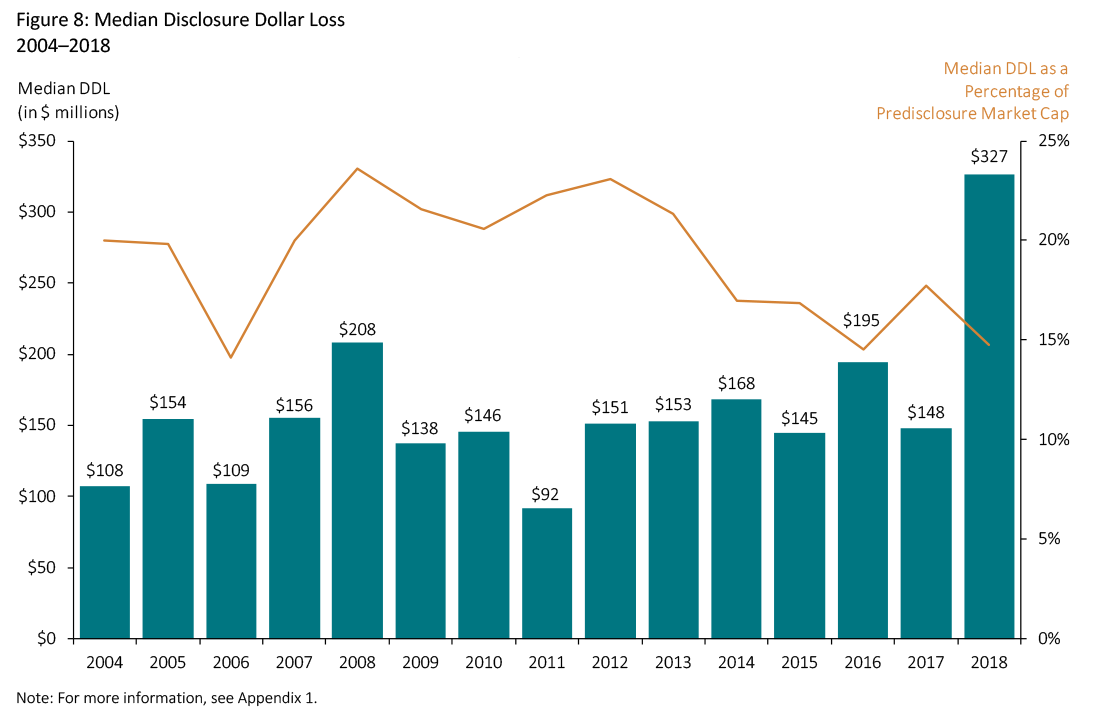
- The typical (i.e., median) percentage stock price drop at the end of the class periods has generally been decreasing since 2012 and reached one of its lowest levels in 2018.
- This trend coincided with more filings by the three plaintiff law firms discussed on page 36.
- At the same time, the median DDL increased dramatically in 2018, indicating that typical issuers had larger market capitalization prior to the drops at the ends of their class periods.
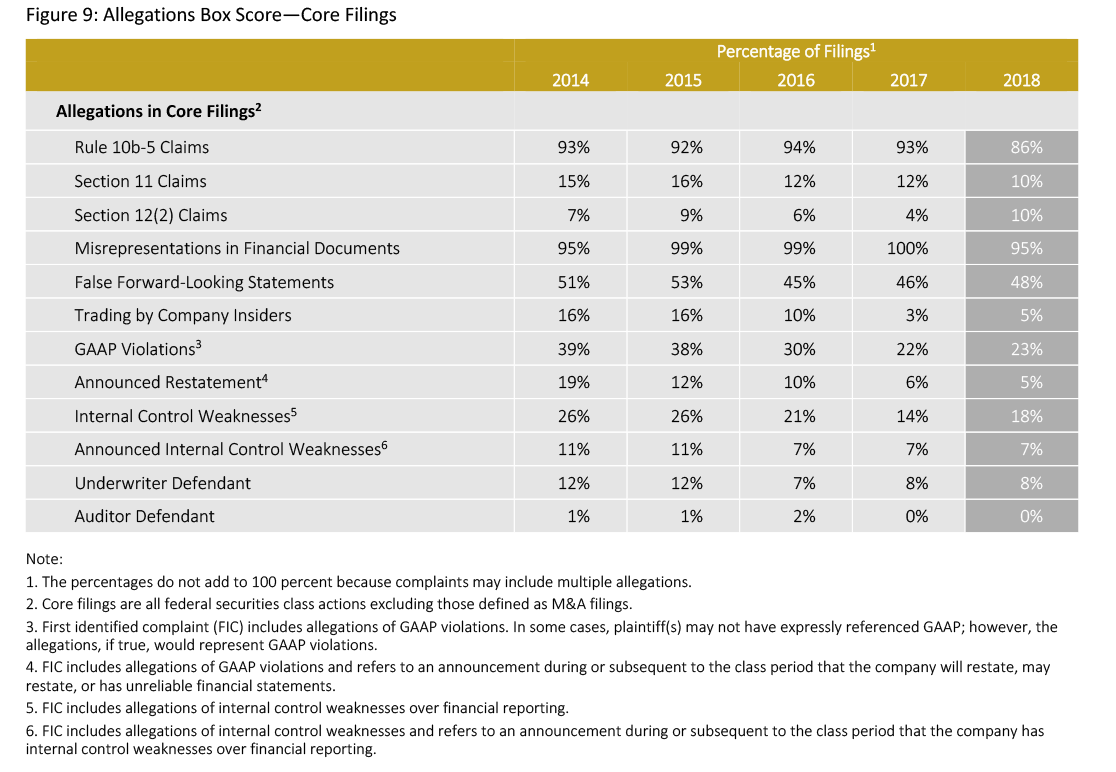
Classification of Complaints
- Section 11 claims decreased in federal courts as a portion of filing activity moved to state courts.
- Section 12(2) claims increased from 4 percent of federal filings in 2017 to 10 percent in 2018.
- Allegations of internal control weaknesses increased from 14 percent of core filings to 18 percent.
- Core filings involving restatements have declined for the last four years.
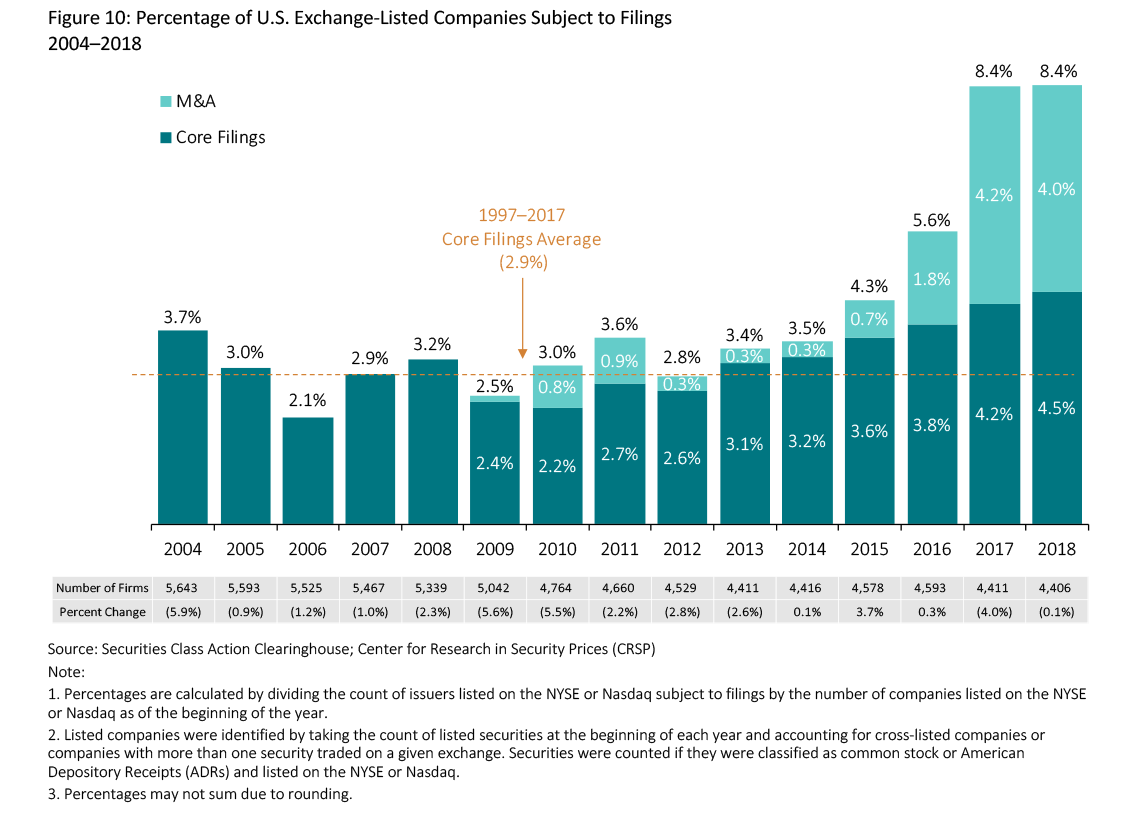
U.S. Exchange-Listed Companies
The percentages below are calculated as the unique number of companies listed on the NYSE or Nasdaq subject to federal securities fraud class actions in a given year divided by the unique number of companies listed on the NYSE or Nasdaq.
- The likelihood that U.S. exchange-listed companies were subject to core filings increased for a sixth consecutive year, from 2.6 percent in 2012 to 4.5 percent in 2018.
- Approximately one in 22 companies listed on U.S.
exchanges was the subject of a core filing in 2018. See Appendix 1 for litigation likelihood over a longer time frame. - Including M&A filings, a record 8.4 percent of U.S. exchange-listed companies were subject to filings in 2018, slightly above the rate in 2017.
Heat Maps: S&P 500 Securities Litigation™
The Heat Maps illustrate securities class action activity by industry sector for companies in the S&P 500 index. Starting with the composition of the S&P 500 at the beginning of each year, the Heat Maps examine two questions for each sector:
(1) What percentage of these companies were subject to new securities class actions in federal court during each calendar year?
(2) What percentage of the total market capitalization of these companies was subject to new securities class actions in federal courts during each calendar year?
- Of the companies in the S&P 500 at the beginning of
2018, approximately one in about 11 companies (9.4 percent) was a defendant in a core filing during the year. - The Consumer Staples and Industrials sectors were more active in 2018 than in the previous 17 years.
- Core filings activity in the Telecommunications/ Information Tech sector increased for the fourth consecutive year.
- The percentage of companies in the Consumer Discretionary sector subject to core filings (10 percent) was double the 2001–2017 average.

- The total market capitalization of S&P 500 companies subject to core filings more than doubled from 6.1 percent in 2017 to 14.9 percent in 2018. This represents the highest percentage since 2008.
- While the percentage of companies in the Health Care sector subject to core filings nearly doubled relative to 2017, the percentage of market capitalization subject to core filings increased more than ninefold.
- Nearly 20 percent of the market capitalization of each of the Industrials and Telecommunications/Information Tech sectors was subject to core filings.

The complete publication, including footnotes and appendix, is available here.
