 Print
PrintDavit Karapetyan is Regional Corporate Governance Lead for Latin America and the Caribbean at the International Finance Corporation (IFC); and Alexandre Di Miceli Da Silveira is professor at Alvares Penteado School of Business in Sao Paulo and partner at Direzione Management Consulting. This post is based on their IFC report.
Related research from the Program on Corporate Governance includes The Elusive Quest for Global Governance Standards by Lucian Bebchuk and Assaf Hamdani; Learning and the Disappearing Association between Governance and Returns by Lucian Bebchuk, Alma Cohen, and Charles C. Y. Wang (discussed on the Forum here); and What Matters in Corporate Governance? by Lucian Bebchuk, Alma Cohen, and Allen Ferrell.
Investors, including IFC and other development finance institutions, increasingly look at governance as an indicator of firm quality and a factor in investment selection. There is a strong business case for linking sound corporate governance practices to better firm performance. This proposition is based on the view that companies adopting governance best practices make better business decisions over time, better manage their risks, enjoy enhanced market reputation, and have improved access to capital. From a macro perspective, CG may also contribute to country-level social and economic development.
“Sound corporate governance helps businesses attract investment on better terms. Clients are more accountable to investors and responsive to stakeholder concerns. They also operate more efficiently and are able to better manage risks.”
—IFC website
Over the past two decades, numerous academic studies worldwide have investigated whether the link between CG quality and firm performance is supported by empirical data. Most research finds a positive relationship between following recommended CG practices and financial performance indicators, especially when using market value ratios such as Tobin’s Q, price-to-book value (P/ BV), and price-to-earnings (P/E). (See below.)
Because most research relies on publicly available information, it is tailored to CG and performance analysis of the largest companies and those that are publicly listed. As a result, there is a possible gap between the findings of CG studies, as they may not be relevant to unlisted, often family-owned, businesses—the ones that IFC typically invests in. Therefore, this study explores the empirical link between CG and performance with data from IFC’s investment portfolio, using a research methodology in line with other studies in the field but adapted to IFC’s investment environment. Specifically, it investigates the extent to which having good CG policies and practices—as defined by the CG Index specifically developed for this study based on IFC’s CG Methodology—is associated with better financial and nonfinancial performance of IFC’s portfolio clients during the investment period. [3] It reflects IFC’s nature as a development institution, where the success of an investee company is defined not only in financial terms but also by its contributions to a broader set of stakeholders and the economy in general, including environment and social aspects. The study’s methodology has been submitted to peer review by internal and external experts as well as investment professionals, and their feedback was considered.
Continuing Debate on the Real Impact of CG Practices on Performance
Several studies have concluded that companies with superior governance practices tend to exhibit better operating profitability and are traded at premium prices over their peers. However, an important caveat regarding these findings is this: A positive relationship between CG practices and better performance does not necessarily mean that the superior performance is a consequence of higher CG quality. It is the difference between correlation and causation. Best governance practices, for example, may be positively correlated with better performance due to other factors (such as firm size, market power, and so on) or because it is a consequence instead of a cause of better performance.
This causality issue is very difficult to solve from the econometric point of view due to three so-called endogeneity problems: omitted variables, simultaneity or reverse causality, and measurement error of the regressors (especially the construct validity of CG measures). Researchers are still trying to overcome these problems by resorting to increasingly complex econometric procedures, such as random and fixed effects procedures, instrumental variables based on changes in regulations, dynamic and systemic generalized method of moments (GMM), and so on. Thus the debate about the real impact of CG practices on performance is still not settled in the academic world.
Interestingly, the most robust results have been found using data from emerging markets. Thus it is likely that having sound CG practices is a more important factor for the performance of companies located in countries with the worst investor protection.
Examples of studies referred to above are Klapper and Love (2002), Gompers et al. (2003), Durnev and Kim (2005), Black, Jang, and Kim (2006), Brown and Caylor (2006), Silveira and Barros (2007), Leal and Carvalhal-da-Silva (2007), Chen, Chen, and Wei (2009), Renders, Gaeremynck, and Sercu (2010), Ammann, Oesch, and Schimd (2011), CLSA Group (2012), Black et al. (2013), and Hitz and Lehmann (2013). In addition, Claessens and Yurtoglu (2013) provide a recent review of research on corporate governance with a special focus on emerging markets.
The study sample comprised companies that IFC invested in during FY11 and FY12 (July 1, 2010, through June 30, 2012). The study period was selected to ensure that no external and extraordinary global events influenced CG or performance indicators on the firm level (for example, when the consequences of the 2007 financial crisis have likely subsided) and to allow for an extended period of five to six years of holding the companies in IFC’s portfolio so that the effects of the investment relationship between IFC and the clients could materialize.
CG data were collected directly from IFC’s portfolio companies, based on the CG Index questionnaire, which included information as of the date of the original investment and at the end date of the study (June 30, 2016). Performance data, on the other hand, were already available in IFC’s internal databases and comprised financial, economic, credit, E&S, and private sector development indicators.
The study did not seek to prove causality between CG and performance. Instead, it assessed the degree of the mutual relationship between the two and lessons to be drawn by IFC investment teams as they structure and manage IFC’s engagement with investee firms. Future improvements in standardizing CG and performance data collection may make possible significantly more data observations, which in turn may allow for a more robust analysis, including seeking to identify causality from CG to performance. While the study’s findings demonstrate statistically significant correlation between CG and performance, the relatively small size of the sample limited the ability to conduct more robust econometric analysis, such as multiple regressions.
Also, some other study limitations, often common in similar research studies conducted outside IFC, include
- reliance on companies as the source of CG information (even though the relevant portfolio officers reviewed and verified information to the best of their knowledge);
- recall bias of remembering CG policies and practices dating back to 2011;
- limited heterogeneity of the data sample of IFC clients that have been prescreened and are typically market leaders; and 4) absence of severely underperforming companies (due to financial distress or to lack of a strong relationship with IFC) from the study sample.
Despite these limitations, inherent to most empirical studies worldwide, the key findings of the study can inform IFC’s investment operations and its approach to private sector development. First, the study findings based on hard data reinforce the business case for improving governance practices of IFC investees. Integrating CG risk assessment into deal origination, structuring, and portfolio supervision may better enable financial and nonfinancial value to be extracted across a project’s lifecycle and, more significantly, for poor CG performance to be corrected before it is manifested in debt default or erosion of equity. Second, by identifying distinct governance factors that are strongly correlated to better performance, the study helps establish a practical framework for prioritizing governance improvements by firms. Third, the findings support IFC’s 3.0 strategy of building sustainable markets and providing support, including in the form of advisory services, to further increase the value add to its clients and investment portfolio.
The publication and dissemination of the findings of the study may have an effect that could go beyond IFC’s own investment operations and IFC’s investee companies and have a broader development impact in better articulating the relationship between CG and performance, both on the risk side and in value addition.
In addition to these internal objectives, this study makes important contributions to the discourse on CG and performance in emerging markets. First, the study adds to a body of academic research by including unlisted companies from emerging markets. Second, IFC can further leverage its strong relationships with other development finance institutions by encouraging them to conduct similar studies. Alternatively, future similar studies may include companies from other institutions and make market-level efforts to disseminate the findings of this study in their regions and priority countries, thus multiplying the effect of this report.
Methodology
The study’s overall goal was to determine whether IFC clients’ practice of better corporate governance is associated with better performance during the investment period. To accomplish this, the study team designed a research methodology in line with other studies in the field but tailored to IFC’s portfolio.
Objectives
First, the study aimed to find out whether better CG practices of IFC clients at the disbursement date are associated with better performance during the investment period. Second, it analyzed data to check whether companies with greater improvement of their CG practices from IFC’s disbursement date until the end of the study period performed better throughout this period. And finally, the study tested whether the average level of CG in IFC clients is associated with better firm performance.
This last objective was included in the study based on consideration that CG practices tend to be relatively stable over time (as demonstrated by the fact that about one-quarter of the sample did not report any variation of CG practices during the five years under analysis), and it allows for increasing of the number of firm-year observations of the sample. This methodological technique is widely accepted in the academic field for similar empirical studies.
These objectives are related to perspectives that are gaining general acceptance among CG as well as environmental, social, and governance (ESG) practitioners. If the first objective is supported by empirical data, then the results would reinforce the need for IFC and other similar investors to screen and select companies with high-quality CG practices at the disbursement date. If the second objective is supported by the analysis, then the findings would reinforce the case for IFC and the client companies to focus on improving their CG practices to maximize value
creation. If the third objective is empirically supported, the findings would demonstrate that attention to CG should be continuous rather than a one-time exercise.
Firm-Level Performance Variables
It is important to recognize that not all aspects of performance are interrelated; there are many ways to measure firm performance. Most external research on CG measures financial indicators from the perspective of shareholders via measures such as the ROE or market value ratios, such as Tobin’s Q, P/E, P/BV, and so on. Firm performance can also be understood from a broader perspective that includes outcomes to other relevant stakeholders, such as employees, customers, communities, and society.
A challenge in this study was to include relevant measurement parameters, which IFC actively and reliably tracked for the study period from July 1, 2010, to June 30, 2016. Accordingly, the study considers four well- established indicators that IFC tracked across its portfolio:
- Return on Equity/Return on Invested Capital: ROE and ROIC are measures of financial performance that reflect the returns to financiers. Annual ROE is calculated as net income for the most recent year, divided by average equity (average between the most recent year and the previous year). ROIC is computed as the ratio of net operating profits, less adjusted taxes (NOPLAT) to total invested capital. (NOPLAT reflects only profits from core operations, less related income taxes.)
- Economic Return on Equity/Economic Return on Invested Capital: EROE and EROIC are measures of economic performance that take into consideration returns not just to financiers but also to society as a whole. Annual EROE is calculated as net income for the most recent year, adjusted for costs and benefits to society (such as taxes paid, subsidies, interest caps, and free or not fully priced advisory services), divided by average equity (average between the most recent year and the previous year). Annual EROIC is computed as net operating profits, less NOPLAT, adjusted for costs and benefits to society, divided by invested capital.
- Credit Risk Ratings: IFC’s in-house CRRs used in this study range from 1 to 7, where 1 indicates the lowest risk, and 7 the highest risk level (commensurate with default). Additional modifiers (A and B) add further granularity in the CRR for categories 2 to 5, where A defines a higher credit quality than B within the category. The CRR categories are very good (1), good (2), average (3), watch (4), substandard (5), doubtful (6), and loss (7). For the purposes of this study, the team computed the CRRs converted into two different scales: from 1 to 7 (just removing the letters A or B from the credit risk assigned) or from 1 to 11 (by converting letters A and B into numbers). The study relied on CRR ratings per the methodology in 2011 and 2012, although this has since been replaced by the IRP (Investment Risk Platform) methodology, which adheres to a different scale.
- Development Outcome Tracking System and Overall Development Outcome (ODO) Ratings: IFC’s proprietary DOTS measures and monitors projects’ development impacts by assigning ratings to four performance areas, described below, with ratings on a
1–4 scale (excellent, satisfactory, partly satisfactory, and unsatisfactory). The ratings rely on a baseline, target, and actual results assessment and define qualitative and quantitative benchmarks to assess projects and thus complement analysis of raw financial or nonfinancial performance data (also analyzed separately in this study). DOTS also provides an aggregate synthesis rating, the ODO, on a 1–6 scale (highly unsuccessful, unsuccessful, mostly unsuccessful, mostly successful, successful, and highly successful). DOTS considers the following four dimensions of a project, with specific measurement metrics for Financial Markets and for nonfinancial sectors—Manufacturing, Agribusiness, and Services (MAS) and Infrastructure and Natural Resources (INR) firms, as relevant:- Financial performance (DOTS Fin) tracks project returns to determine whether they are sufficient to compensate financiers for risks taken. It uses ROE for Financial Markets and ROIC or financial rate of return (FRR) for nonfinancial sector projects.
- Economic performance (DOTS Econ) tracks the benefits accrued not only to financiers but also to stakeholders most directly affected by projects: customers, employees, suppliers, taxpayers, and government. ROE and EROE are compared with cost of equity (COE) for Financial Markets firms, and ERR or EROIC are reviewed for nonfinancial sector firms.
- Environmental and Social (DOTS E&S) performance assesses the benefits that accrue to the environment in which the project takes place. DOTS E&S also measures the extent to which IFC clients satisfy the environmental, social, and health and safety standards set forth in IFC’s sustainability policy and performance guidelines.
- Private Sector Development (PSD) impact captures the benefits accrued to actors beyond the IFC client that are influenced by the company project, such as its supply chain, industry, or country location.
- Environmental & Social Review Rating: ESSR indicates a company’s capability and/ or management of E&S issues in accordance with IFC’s Sustainability Framework: excellent (1), satisfactory (2), partly unsatisfactory (3), unsatisfactory (4)—taking into account the sector-specific and project-specific risks identified by IFC at the time of investment and implantation of E&S action plans agreed with the company.
These indicators were extracted from IFC internal systems or directly from the clients’ financial statements and annual reports.
Corporate Governance Score
Evaluating corporate governance is inherently a subjective and complex process. Most research measures CG through indices that focus on a company’s application of recommended best practices.
It is important to note that indices vary substantially across studies and there is no universally accepted instrument in the literature or among practitioners. Some practitioners argue that measuring CG quality via indices and scores may be potentially misleading.
One issue is the construct validity and whether CG indices are indeed able to segregate genuinely well-governed companies from those with poor governance. For instance, some firms, to please their external stakeholders, might create the perception of adopting good practices while their day-to-day practices do not truly reflect the standards presented. Moreover, there is no ideal CG model that can be implemented by all companies. Because firms differ in size, sector, life-stage, ownership structure, strategy, country of origin, and so on, it would not be practical to apply the same CG instrument to all firms. Indices are often unable to capture the country factor, because companies differ not only in their own practices but also in the requirements of the legal and regulatory frameworks of their home jurisdictions.
While acknowledging these limitations, much of the academic literature considers CG indices to be at least reasonable proxies of the firm’s corporate governance quality. Usually, these papers create indices composed of questions that are binary (yes or no), objective (based on a clear criterion), and based on publicly available information. This standard reduces the subjectivity of the instrument and facilitates replicability by third parties.
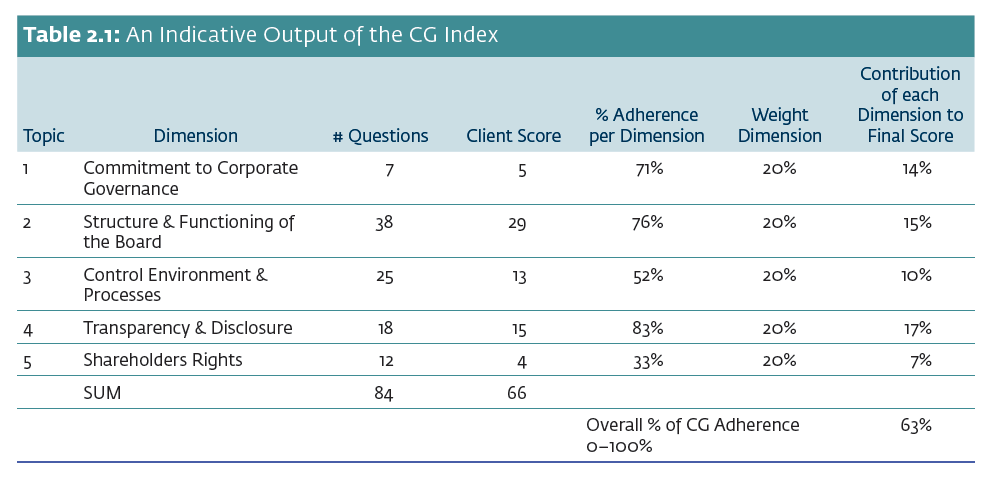
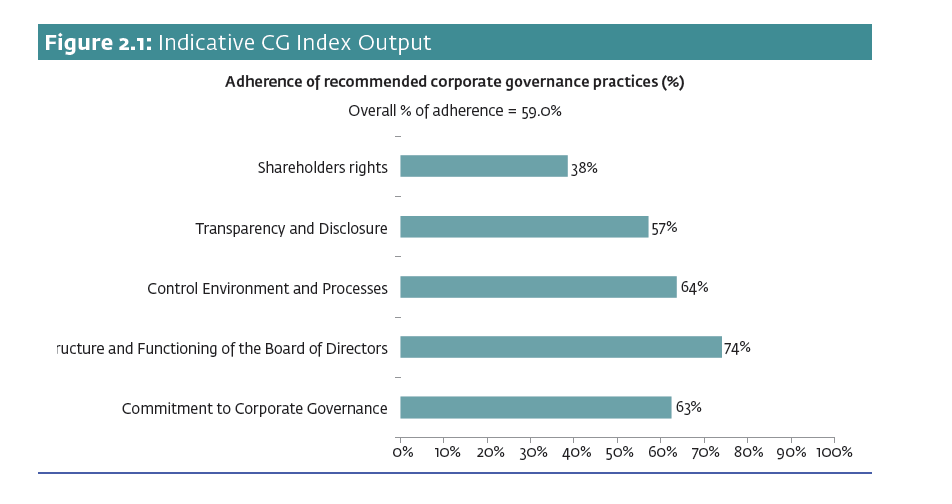
For this research, the study team constructed the CG Index and tailored it for use as the primary instrument for evaluating CG against performance indicators. The Index drew from the experience of previous research studies and G20/OECD Principles of Corporate Governance, and it relied heavily on IFC’s own CG Methodology and its five dimensions: 1) firms’ commitment to CG, 2) structure and functioning of the board of directors, 3) control environment and processes, 4) transparency and disclosure, and 5) shareholders’ rights. Incorporating these five dimensions aligns the CG Index with IFC’s existing approach for CG analysis in the investment process. Because the number of questions for each CG dimension and category differs, the scores obtained were standardized as a percentage to ensure that all dimensions have the same weight in the aggregate CG score.Table 2.1 and Figure 2.1 illustrate the output of the CG Index divided into its five dimensions.
The correlation analysis also used a reduced Core CG Index composed of 26 core questions (shortlisted from the total 84 questions in the Full CG Index). IFC corporate governance specialists selected the most important indicators from the Full CG Index to narrow the focus of CG on key indicators prior to undertaking the empirical analysis, to ensure that the results are not biased. The construction of the Core CG Index is important, because it may be easier to replicate it for subsequent studies with a larger sample of companies and for it to become part of a routine CG assessment for all new IFC clients.
Company Sample and CG Data Collection
The study identified an initial sample of about 330 portfolio companies with investments disbursed between July 1, 2010, and June 30, 2012, and where it was possible for IFC to review and oversee CG commitments of the company. The study period was selected to ensure that no external and extraordinary global events influenced the CG or performance indicators on the firm level (such as when the consequences of the 2007 financial crisis had likely subsided) and to allow for an extended period of five to six years of holding the companies in IFC’s portfolio so that the effects of the investment relationship between IFC and the clients could materialize.
All companies from the sample received invitations to complete the CG questionnaire, and 61 companies provided completed CG questionnaires with data on their CG practices at both the initial year of the disbursement (2011 or 2012) and the end of the study period (June 30, 2016). Tables 2.2 and 2.3 show the industry and region distribution.
Surveyed companies represent all regions and industries, but there is an industry concentration on financial institutions (49 percent of the sample). There also is a regional concentration in Latin America and the Caribbean companies (36 percent of the sample) due to the higher response rate. The total 61 respondents represent an aggregate disbursement of about $1.5 billion in debt and equity investment from IFC. Of the 61 respondents, 18 are listed entities, of which 13 are nonfinancial sector entities and 5 are financial institutions. Regarding classification, 5 respondents are Tier i, 42 are Tier ii, and 8 are Tier iii. Regarding the type of financing, 25 operations are only equity deals, 33 are only debt operations, and 3 are both equity and debt clients.
Findings
The database of CG and performance indicators constructed for the study facilitated two principal avenues for investigation:
- Subgroup comparisons—to test whether there is a significant difference of means between at least two subgroups (for example, companies belonging to the top 25 percent in improvement of CG practices versus the bottom 25 percent) on a performance variable of interest, such as ROE, by running two-sample difference of means tests.
- Data reduction analysis—to identify the most relevant CG questions, and to identify which specific CG questions are stronger predictors of performance indicators.
CG Score Analysis
The review of CG scores of the companies from the study sample at the time of IFC’s original disbursement shows some interesting findings:
On average, companies in the sample followed 60 percent of recommended CG practices at the time of IFC’s original disbursement. This shows that companies usually adopt more than half of the corporate governance practices assessed by the study instrument at inception of their relationship with IFC.
In the analysis of each CG dimension, the highest score is in the area of Transparency and Disclosure (73.4 percent) followed closely by Control Environment (71.1 percent), while the area with the lowest score is Shareholder Rights (58.9 percent) followed by Commitment to CG (62.6 percent).
- If reviewed through the industry lens, the CG scores of financial institutions overall are 14 percent better than those of real sector companies (67 percent against 53 percent). The largest differences are in the areas of Control Environment (26 percent) and Commitment to CG (25 percent), while in the area of Shareholder Rights the real sector companies displayed better CG practices by 4 percent than financial institutions. The outperformance of financial institutions in two dimensions could be due to higher regulatory requirements for the financial industry and because such companies are generally more mature in their life stage.
- Interestingly, CG scores of companies where IFC invested in equity or debt instruments are essentially the same. Moreover, while board practices are generally better in equity clients, debt clients outperform in the area of Shareholder Rights.
- Listed companies in the sample have on average 6 percent higher CG scores than those not listed on stock exchanges, with Transparency and Disclosure and Control Environment displaying the largest difference between the scores of the two groups. However, unlisted companies reported on average 16 percent better practices in the area of Shareholder Rights. Possibly, this is explained by simplicity of shareholder protections in unlisted companies where existing shareholders rely on private shareholder agreements to protect their interests.
- Finally, the size of IFC investments (Tier iii versus Tiers ii and i) did not appear to be associated with the CG scores of the companies.
The study then analyzed the CG performance of investee companies during the portfolio holding period. The analysis produced the following observations:
- On average, companies in the study sample improved their CG score by more than 7.0 percent from the time of IFC’s disbursement until the end of study period (June 2016). Largest improvements were in the dimensions of Commitment to CG (11.3 percent) and Board Practices (8.0 percent), while the least improvements were in Shareholder Rights (1.0 percent).
- Although real sector companies generally displayed lower CG scores at the time of disbursement compared with financial institutions, the improvements of the CG performance in these two groups were essentially the same overall. Financial institutions appeared to focus more on improvements in Commitment to CG by improving their CG policies as well as prioritizing improvements in their Control Environment. The real sector companies also improved their formal CG policies while also making relevant strides in Transparency and Disclosure.
- Companies with both equity and debt investments also improved their CG scores on average by the same 8 percent. The difference between variation of CG scores of listed and unlisted companies (6 percent versus 7) is negligible.
- Interestingly, although companies with large or small investments from IFC had similar CG scores at disbursement, companies with smaller investments improved more (8 percent versus 2 percent for larger investments).
The above description of CG scores at disbursement and CG improvements throughout the study period for different subgroups shows that the most striking differences are among the financial institutions and real sector companies, especially in the areas of Commitment to CG and Control Environment. In other aspects, such as type of investment product, size of investment, and companies’ listing on stock exchanges, material differences were not observed, thus making the results from the total sample applicable to each subgroup as well.
The complete publication, including footnotes, is available here.
