 Print
PrintJoseph Kieffer is a Senior Research Analyst at Equilar Inc. This post is based on an Equilar memorandum by Mr. Kieffer, Alex Knowlton, Amit Batish, Brianna Ang, Leah Wright and Charlie Pontrelli. Related research from the Program on Corporate Governance includes Paying for Long-Term Performance by Lucian Bebchuk and Jesse Fried (discussed on the Forum here) and Share Repurchases, Equity Issuances, and the Optimal Design of Executive Pay by Jesse Fried (discussed on the Forum here).
The optimization of pay structures for executives and upper-level management has played a prevalent role in the duties of compensation committees in recent years. From the restructuring of the compensation portion of the proxy statement to the introduction of Say on Pay and everything in- between, checks and balances regarding compensation have come in waves,
and shareholders have increasingly held boards more accountable because of it. As a result, board members—and specifically compensation committee members—have had to walk a thin line between attracting talent and overpaying executives, and the most effective strategy to achieve that has been basing rewards on company performance and the creation of shareholder value.
Designing an effective long-term incentive plan (LTIP) can be very difficult, as boards must be aware of the potentially high costs that come with an over- zealous LTI design. Similarly, boards must be privy to the gains associated with an effective plan, both for shareholders and the executives themselves. Consequently, compensation committees must work diligently to determine multiple factors in an LTI plan. Committees must select the correct metric(s) on which to base performance, the weighting of that metric compared to total performance, set the targets, thresholds and maximums for each award and lastly measure these goals to appropriate payouts.
Executive Long-Term Incentive Plans, an Equilar report, focuses on the trends associated with these performance awards and how they are implemented through the LTIP design process at companies in both the Equilar 500 and the Equilar 100. Decisions made in the LTI process affect the overall outcome of pay and performance, as well as the award values for executives and the values realized by shareholders.

Relative TSR Continues to Dominate Metric Usage
Despite an emerging trend to tie executive compensation to metrics that underlie relative total shareholder return (TSR), for the most part, companies continued to rely heavily on it as a performance metric in their long-term incentive plans. Approximately 54.7% of Equilar 500 companies included TSR as a metric in their CEO’s long-term incentive plan in 2017, while the second-most commonly used metric, return on capital (ROC), saw usage from 37.1% of companies. While a majority of the most frequently used metrics remained largely stagnant in usage from 2013 to 2017, the percentage of companies implementing relative TSR targets rose by 9.8 percentage points for CEO LTIP awards, 8.8 percentage points for CFO LTIP awards, and 9.6 percentage points for other officers’ awards. At the CFO award level, cash flow has risen slowly in usage over the last five years. While only 11.8% of Equilar 500 companies used this metric in 2013, 14.9% were using it in 2017, a 26.3% increase over the time period.
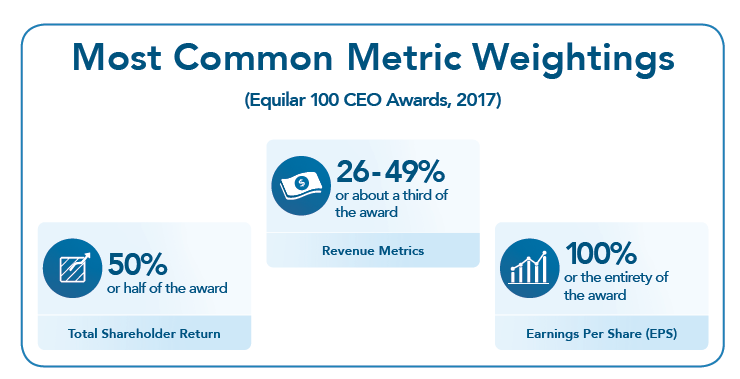
Similarly, the number of Equilar 100 companies using relative TSR in CEO LTIP awards mirrored that of the Equilar 500, with half of the companies doing so. Additionally, there seems to be evidence that compensation committees believe relative TSR functions well in tandem with another metric. 42.5% of Equilar 100 awards to CEOs that used relative TSR as a metric used it as 50% of the total performance weighting. Metric weighting in incentive plan awards varies greatly, depending on a multitude of things—for example a given company’s current financial standing or the objectives it sets for itself. In 2017, CEO performance awards at companies in the Equilar 100 saw EPS emerge as the metric most likely to stand alone, with 31% of awards using it alone. This is in contrast to 2016, when the most common standalone metric in performance awards to CEOs was relative TSR at 33.3% of all awards using that metric.
Three-Year Performance Periods Reign Supreme
The performance period of choice for LTIP awards in 2017 was three years, and, though it was the most popular throughout every year in the study, the prevalence has increased over each of the last five years. Between 2013 and 2017, the percentage of Equilar 500 companies that used three-year performance periods in their LTIPs increased by 12.9 percentage points among chief executive officers, topping out at 86.9% in 2017. All other performance period usage has dropped over the same period of time, with the exception of the five-year performance period, where the usage has hovered around a mere 2% of Equilar 500 companies.
While one-year awards have remained the second-most prominent choice for performance periods, they have also seen usage decline most significantly of any category. In 2013, approximately one of out every five companies used one- year performance periods. Yet, by 2017, that number was 7.6 percentage points lower among all chief executive officers.
Performance and Payout Ranges Maintain Consistency
Performance equity grants to CEOs have consistently required award recipients to achieve within 10% of metric targets to earn the threshold payout. This was even more so the case in 2017: 32 metrics in Equilar 100 long-term incentive plans specified that CEOs must reach at least 91% to 99% of target performance to achieve only the threshold of the metric. On the flip side, the most common maximum, again specified by 32 metrics, was between 101% and 110% of target performance. Unsurprisingly, maximum payouts associated with Equilar 100 CEO LTIP awards tended to be double that of target performance, as specified for 88 total metrics. A less frequent—though still heavily used—possibility was a maximum payout being 150% of the target payout, as it was for 38 performance metrics. The most frequent threshold payout was 50% of target payout, with 74 metrics. However, it was actually more common for threshold payouts to range from 0 to 49% of target payout, as was the case with 79 performance metrics in 2017.
For 2019, executive long-term incentive plan design will continue to be a challenge for compensation committees. At the very least, companies can remain pressured by activist shareholders, or need strategies in place for the aftermath of the Tax Cut and Jobs Act of 2017. The repercussions of this Act can be far reaching beyond simply corporate taxation, to potential brand reputation from the increased visibility of CEO pay in proxy statements. What’s more, the increased focus on executive gender pay will most certainly be at the forefront of most companies’ strategies. Notably, the Paycheck Fairness Act is a bill that is a proposed labor law that would require companies to report compensation amounts and promotion activities by gender, geography, and race. While this level of transparency is a welcomed solution to a serious problem, it will certainly have an impact on plan sponsors and plan design.
Methodology
Executive Long-Term Incentive Plans, an Equilar publication (available here), examines the performance metrics and periods associated with long-term incentive awards granted to CEOs, CFOs and other NEOs at companies in the Equilar 500. Year one was defined as all companies that filed a proxy statement between January 1, 2018 and December 31, 2018, and previous years were defined in a similar manner. Long-term incentive awards are defined as the summation of all equity awards, as well as any cash awards with a performance period contingent upon metrics that are measured over more than one year. The performance metric return on capital (ROC) includes all of return on capital, return on invested capital, return on capital employed, return on investment and return on equity, while cash flow includes free cash flows and cash from operations.
In addition, the study also includes a more in-depth examination of the most recent long-term incentive awards granted to CEOs at Equilar 100 companies—a subset of the Equilar 500. For this analysis, data includes performance metrics, weightings, performance ranges as a percentage of target performance and as a percentage of target payout.
The narrative portion of the complete publication delves into the trends revolving around the design and specific awards in incentive compensation for c-suite executives. E*TRADE Financial Corporate Services, Inc. added independent color and commentary to provide more detail into the structure of incentives and awards associated with performance.
Key Findings
- Relative TSR continues to be the most prominent long-term incentive plan (LTIP) performance metric among all executive officers. In 2017, 7% of companies utilized it in their equity grants to CEOs, and a total of 54 individual equity awards to Equilar 100 CEOs included relative TSR as a metric.
- Return on capital and earnings per share (EPS) were the second- and third-most common LTIP performance metrics, respectively. A total of 1% of companies used return on capital in LTIP awards granted to CEOs, while 29.7% used EPS in their 2017 equity grants.
- EPS was the most common, standalone performance metric with 31% of usage weighted at 100%, while revenue was most likely to be used in conjunction with other metrics.
- By far, the most prevalent performance thresholds for LTIP awards granted to CEOs were between 90% to 100% of the total award, while the most common maximums for those same awards fell between 100% and 110% of the target.
- Approximately 87% of performance awards granted to named executive officers in 2017 had three-year performance periods.
The complete publication, including footnotes, is available here.