 Print
PrintJohn Roe is Head of ISS Analytics, the data intelligence arm of Institutional Shareholder Services, Inc; and Kosmas Papadopoulos is Managing Editor and Executive Director with ISS Analytics. This post is based on an ISS Analytics memorandum by Mr. Roe and Mr. Papadopoulos. Related research from the Program on Corporate Governance includes The Growth of Executive Pay by Lucian Bebchuk and Yaniv Grinstein; and Paying for Long-Term Performance by Lucian Bebchuk and Jesse Fried.
As we enter the peak of proxy season, we review executive compensation trends in the U.S. based executive pay disclosures so far this year. Our key findings include:
- Compensation disclosures so far suggest continued increases in CEO pay across all market segments and almost all industries.
- The proportion of stock-based compensation as a percentage of total pay continues to increase, crossing the threshold of 50 percent of total pay for large companies for the first time this year.
- Performance-based equity compensation also continues to increase despite concerns of a potential reversal in the aftermath of the repeal of 162(m).
- CEO pay ratios remain relatively unchanged on aggregate, despite some fluctuations observed at individual companies.
More than two-thirds of S&P 500 companies and approximately half of all Russell 3000 companies have filed proxy statements containing executive pay information for the previous fiscal year. Same-store CEO pay levels show a healthy increase, with a median change in same-store S&P 500 CEO pay of approximately 6 percent compared to the previous fiscal year. These are companies that had the same CEO for the most recent two fiscal years. Non-S&P 1500 companies in the Russell index demonstrate the highest increase in same-store CEO pay with a median increase of 7.4 percent compared to the previous year.
| As of April 11, 2019 |
S&P 500 |
S&P 400 |
S&P 600 |
Russell 3000 |
|---|---|---|---|---|
| Reporting Companies | ||||
| # Companies Reporting FY 2018 pay* |
346 |
260 |
325 |
604 |
| Same-store companies** |
288 |
212 |
267 |
491 |
| Median CEO Pay $ (Total SCT Disclosed) |
12,214,523 |
6,180,516 |
3,693,084 |
2,725,666 |
| Average CEO Pay $ (Total SCT Disclosed) |
14,222,113 |
7,706,890 |
4,180,288 |
4,407,771 |
| Median Pay Change (Same-store) |
6.0% |
4.5% |
5.9% |
7.4% |
* FY 2018 pay defined as pay for any complete fiscal year ending on/after July 1, 2018
** “Same-store” means companies with the same CEO for the most recent two fiscal years.
Quantum of Pay
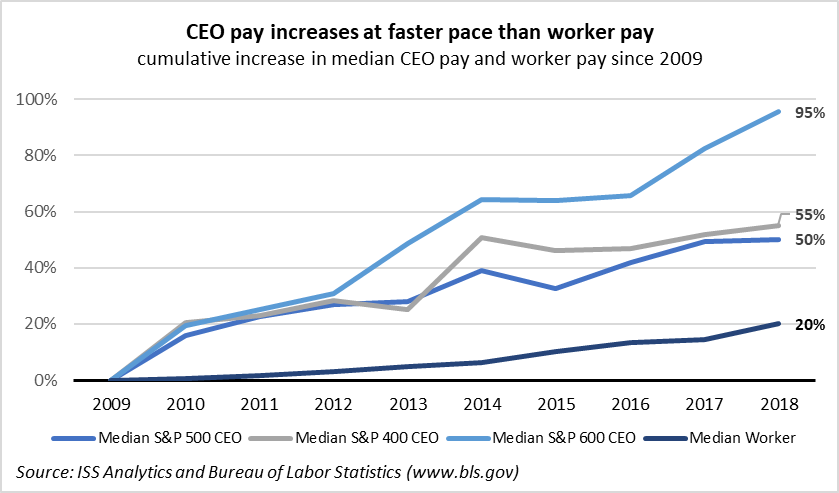
During the past decade, CEO pay increased at a relatively fast pace. Median pay for S&P 500 CEOs rose to $ 12.2 million, showing an increase of 50 percent since 2009. The figure almost doubled for S&P 600 CEOs, with an increase of 95 percent since pay fiscal year 2009. For all our analyses in this article, we define “pay fiscal year” as any fiscal year ending in the period between July and June of each year. Therefore, companies with fiscal year ending from July 2017 to June 2018 fall within the 2017 pay fiscal year. The 2018 pay fiscal year covers companies with fiscal year ending on or after July 1, 2018.

According to the Bureau of Labor Statistics, the cumulative consumer price index has increased by approximately 19 percent from January 2009 to December 2018, while median worker earnings increased by approximately 20 percent during the same period. The compound annual growth rate for median worker pay equals approximately 2 percent per year, compared to 4.6 percent for median S&P 500 CEO pay, 5 percent for median S&P 400 CEO pay, and 7.7 percent for median S&P 600 CEO pay. The chart below compares the cumulative increases in CEO pay and U.S. worker pay in the period since the financial crisis.
Components of Pay
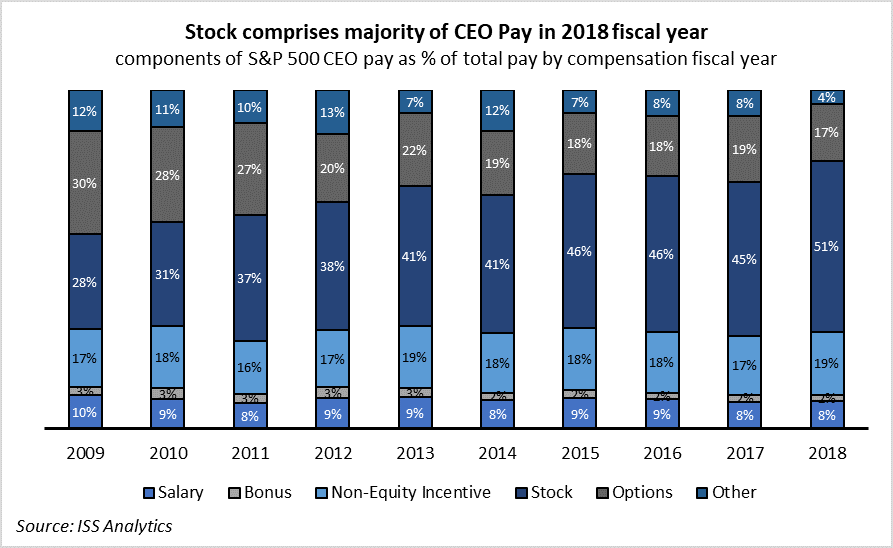
Increases in compensation are primarily driven by greater portions of pay paid in stock. So far in pay fiscal year 2018, the average stock grant to S&P 500 CEOs amounts to $7.2 million, compared to $3 million in pay fiscal year 2009. Stock-based compensation continues to increase, while the aggregate of all other components of pay remains relatively unchanged.

In fiscal year pay 2018, stock-based compensation comprises the majority of CEO pay at S&P 500 and S&P 400 companies for the first time. The trend is the same for smaller companies with stock-based compensation reaching 49 percent and 42 percent of total CEO pay for S&P 600 companies and Russell non-S&P 1500 companies, respectively.
CEO Pay Mix
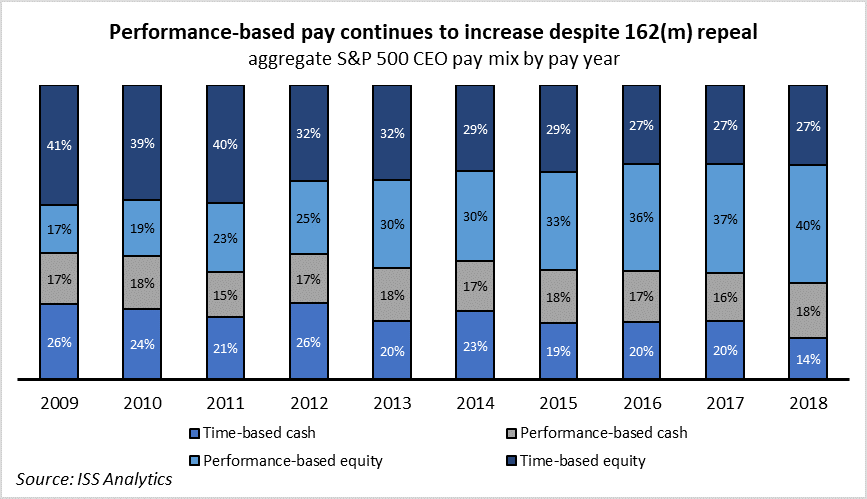
The advent of say on pay and the increased engagement between companies and shareholders about executive compensation brought a focus on performance-based compensation. Equity-based compensation became increasingly performance-based in the past decade. As a percentage of total equity compensation, performance-based equity almost doubled between 2009 and 2018. Cash performance-based compensation has remained relatively unchanged. Overall, cash and equity performance-based compensation now make up approximately 58 percent of total pay, compared to 34 percent in 2019.
The increase in performance-based pay continued this year, despite concerns about a potential reversal. The 2017 U.S. tax reform removed tax deductions on performance-based pay previously allowed under provisions of Section 162(m) of the Internal Revenue Code. The repeal of these provisions raised concerns that companies would change course and increase the non-performance portion of executive payouts.
Performance Metrics
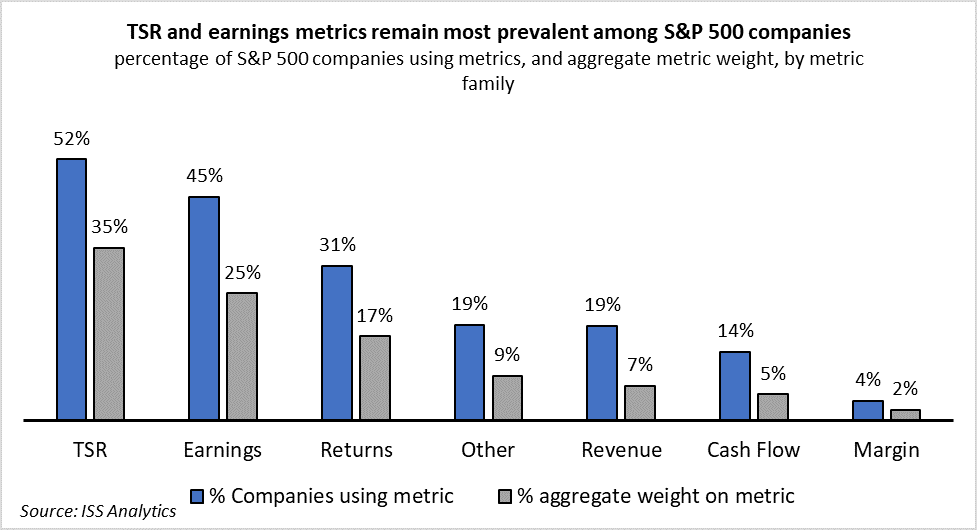
With the prevalence of performance-based compensation, companies have evolved their selection of performance criteria. Long-term incentive plans use a wide variety of performance metrics at different weights, with TSR, earnings, and returns being the most popular performance measure categories. For short-term incentives, companies tend to use earnings, revenue, and “other” company-specific criteria.
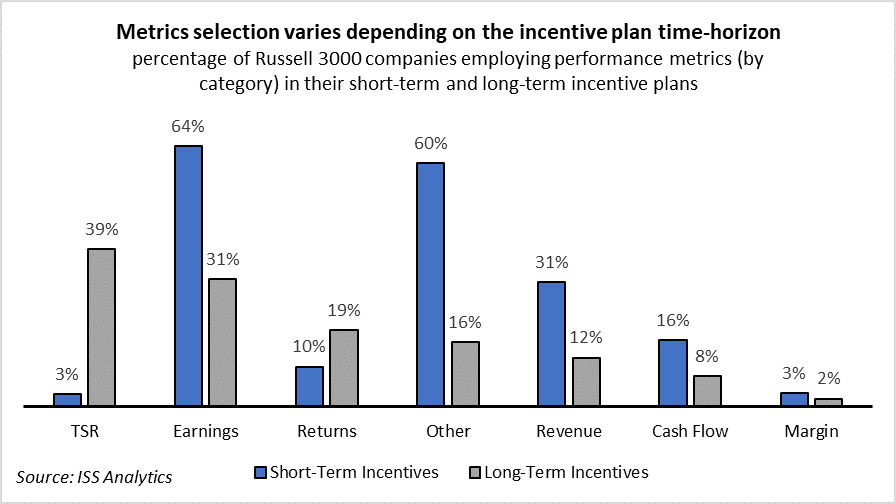
Taking a closer look at the S&P 500 universe, we observe a higher percentage of companies employing performance metrics, as large companies are more likely to have long-term incentive plans in place. Similar to the Russell 3000 universe, TSR, earnings, and returns are the most prevalent metrics categories used among S&P 500 companies.
CEO Pay Ratios
The 2010 Dodd-Frank Act mandated disclosures of CEO compensation relative to the pay of the median employee. The rule was adopted in 2015 and was implemented in last year’s proxy disclosure filings for the first time. Companies maintain a level of discretion on the definition of median employee. So far, while one may observe a few significant fluctuations in the definition of median employee disclosures, on aggregate, the data indicates no changes in CEO pay ratios compared to last year. Median employee compensation levels remain similar to last year.

ISS will continue to monitor and report on trends in company disclosures on executive compensation.
