 Print
PrintAlexander “Sasha” Aganin is senior vice president and John Gould is senior vice president at Cornerstone Research. This post is based on a report by Cornerstone Research and the Stanford Law School Securities Class Action Clearinghouse.
Executive Summary
Led by a spike in core filings, federal class action securities fraud lawsuits continued at near-record levels in the first half of 2019. Plaintiffs filed more than 1,000 federal securities class actions in the last five semiannual periods—over 20 percent of all filings since 1997.
Core filings in the first half of 2019 increased to 126, one fewer than the historical high. Filings involving merger and acquisition (M&A) transactions decreased but remained well above historical levels.
Six mega DDL filings (at least $5 billion) and 11 mega MDL filings (at least $10 billion) propelled aggregate market capitalization losses to the highest and fourth-highest levels on record, respectively.
Number of Filings
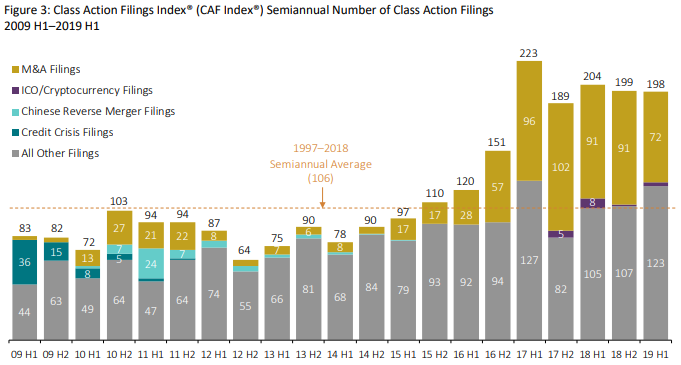
- Plaintiffs filed 198 new federal class action securities fraud lawsuits (filings) in the first six months of 2019, 87 percent higher than the 1997–2018 semiannual historical average.
- “Core” filings—those excluding M&A filings—increased 17 percent in the first half of 2019.
- M&A filings decreased almost 21 percent in the first half of 2019, from 91 to 72.
Size of Filings
- Disclosure Dollar Loss (DDL) was $180 billion, the highest on record and almost three times larger than the historical average.
- In the first half of 2019, Maximum Dollar Loss (MDL) rose by 17 percent to $781 billion, a level more than double the historical average.
- Six mega DDL filings (DDL of at least $5 billion) made up 67 percent of DDL, and 11 MDL mega filings (MDL of at least $10 billion) made up 81 percent of MDL. Both percentage figures are above their respective historical averages because of a handful of very large DDL and MDL filings.

Key Trends
While filings involving European issuers increased to their second-highest level, filings against non-U.S. companies remained steady overall in the first half of 2019.
The Communications sector had 19 filings—all against internet and telecommunications companies. After setting record lows in recent semiannual periods, the median filing lag reversed course and returned to levels slightly higher than the historical median.
U.S. Companies
- In the first half of 2019, 5.2 percent (annualized) of S. exchange-listed companies were the subject of core filings.
- Core filings against S&P 500 firms in the first half of 2019 occurred at an annualized rate of 6.4 percent.
Non-U.S. Companies
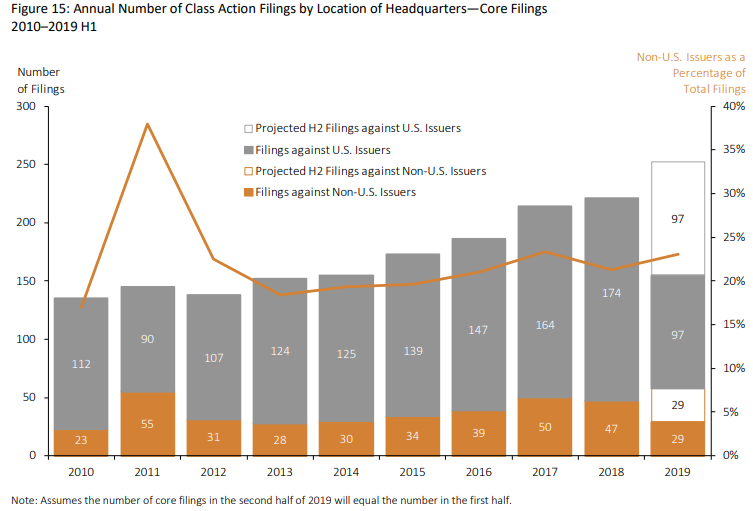
- On an annualized basis, core filings against non-U.S. issuers as a percentage of total core filings remained relatively stable at 23 percent.
- Filings against European firms increased by 63 percent relative to the second half of 2018.
By Industry
- Core filings in the Communications sector increased by 73 percent to 19.
- Core filings in the Industrial sector were the highest since 1999.
- The Consumer Non-Cyclical sector again had the greatest number of filings with 47. Of these, 32 were against biotechnology, pharmaceutical, or healthcare companies.
By Circuit
- There were 52 and 29 core filings in the Second and Ninth Circuits, respectively.
- The Second Circuit had the highest number of core filings of any circuit on record.
M&A Filings by Circuit
- With 50 filings, federal M&A filings continued to be most common in the Third Circuit, while M&A filings in the Ninth Circuit slowed to four.
Initial Coin Offerings
- A small number of core filings, three, involving initial coin offerings (ICOs) or cryptocurrencies reappeared in the first half of 2019. There was one such filing in the second half of 2018, after a flurry of ICO and cryptocurrency filings at the end of 2017 and beginning of 2018.
Featured: State Court 1933 Act Filings
Over the last decade, securities class action filings with Securities Act > of 1933 (1933 Act) claims have increased in state courts. Many of these filings have parallel federal court proceedings. This report tracks state filings with 1933 Act claims, which have primarily been Section 11 claims.
In March 2018, the U.S. Supreme Court issued a unanimous opinion in Cyan Inc. v. Beaver County Employees Retirement Fund allowing plaintiffs to assert 1933 Act claims in state court.
- Between 2010 and the first half of 2019, plaintiffs filed 77 class actions with 1933 Act claims in California state courts, compared to 51 in all other state courts.
- In the first half of 2019, 19 cases alleging 1933 Act claims were brought in state courts. Over one-third of these cases had a parallel federal filing alleging similar claims.
- All of the cases filed in California were concentrated in the San Francisco Bay Area during the first half of 2019, as they had been for the prior three years.
There were more 1933 Act filings in New York state courts than in California state courts in the first half of 2019.

Number of Filings
The pace of filing activity in 2019 has been only marginally slower than the last two record years.
- There were 198 filings in the first half of 2019, one fewer than in the second half of 2018. The number of semiannual filings is the fourth-highest since enactment of the PSLRA. See Appendix 1 of the complete publication.
- M&A filings declined 21 percent to 72 in the first half of 2019 after holding constant at 91 in each semiannual period of 2018.
- There were 126 core filings in the first half of 2019, one shy of tying the first half of 2017 for the most core filings in a semiannual period. This was a 17 percent increase from the second half of 2018.
- There were three core filings related to ICOs and cryptocurrencies in the first of half of 2019 and one in the second half of 2018, a slowdown from eight in the first half of 2018.
The number of semiannual filings remained in line with post-2016 activity, with core filings increasing to offset a downturn in M&A filings.
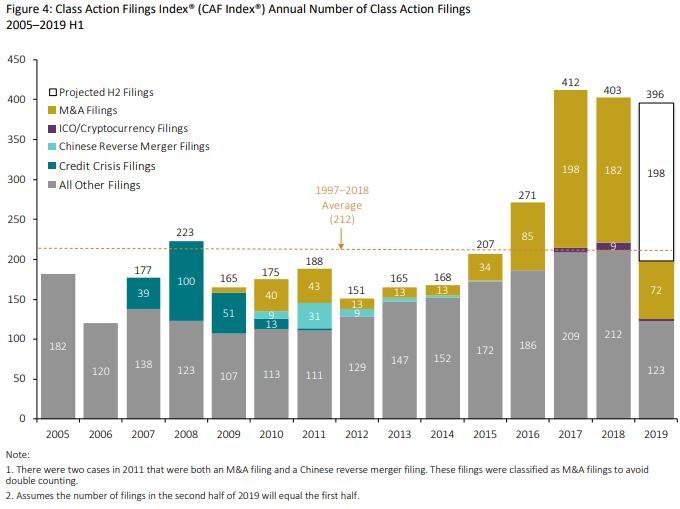
- An annualized number of 396 filings would represent an 87 percent increase over the 1997–2018 historical average of 212 filings, and a decrease of 2 percent from 2018.
- If filings continue at the same rate for the remainder of 2019, there will be a considerable shift in the ratio of M&A to core filings compared to recent years, and core filings may reach their highest mark on record.
The pace of filing activity in 2019 has been only marginally slower than the last two record years.
Market Capitalization Losses
Disclosure Dollar Loss Index® (DDL Index®)
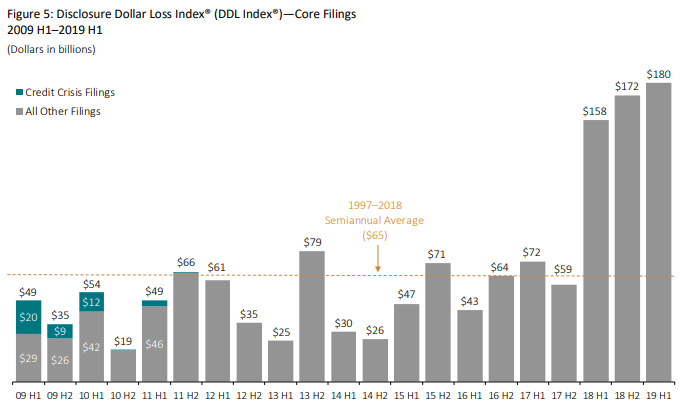
This index measures the aggregate DDL for all filings over a period of time. See the glossary for additional discussion on market capitalization losses and DDL.
- The DDL Index increased by 5 percent from the second half of 2018 to $180 billion, the highest semiannual amount on record.
- The DDL Index has remained at historically high levels since the first half of 2018. DDL in the first half of 2019 was 177 percent greater than the 1997–2018 semiannual historical average.
- The average DDL per filing remained substantially higher in the first half of the year compared to pre-2018 levels, but fell 8 percent compared to the second half of 2018. However, the median DDL per filing fell dramatically from $476 million to $211 million, indicating an influx of filings with smaller DDL values masked by a handful of filings with very large DDL values. See Appendix 1 of the complete publication.
- The largest contributors to DDL were in the Technology (48 percent), Consumer Non-Cyclical (26 percent), and Communications (9 percent) sectors. See Appendix 2 of the complete publication.
- A higher-than-average number of large filings contributed to the high DDL Index. The percentage of filings with DDL greater than or equal to $3 billion was 9 percent, and these filings accounted for 76 percent of total DDL, compared to historical averages of 6 percent and 63 percent, respectively.
The DDL Index reached a record high due to a handful of very large filings.
Maximum Dollar Loss Index® (MDL Index®)
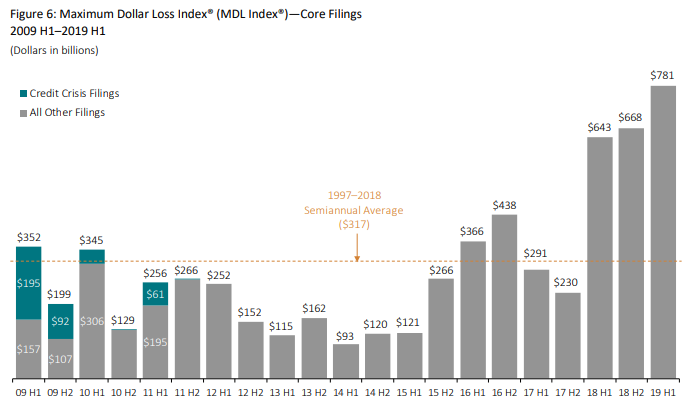
This index measures the aggregate MDL for all filings over a period of time. See the glossary for additional discussion on market capitalization losses and MDL.
- The MDL Index of $781 billion in the first half of 2019 increased by 17 percent from $668 billion in the second half of 2018.
- MDL in the first half of the year was more than double the 1997–2018 semiannual historical average of $317 billion.
- Average MDL per filing remained above $6 billion for the third straight semiannual period, and was 76 percent above the historical average. See Appendix 1 of the complete publication.
- Despite the large total MDL amount, median MDL per filing was 51 percent lower than the second half of 2018, and just 18 percent above the historical average. When compared with the second half of 2018, this pattern reflects an influx of smaller filings supplemented by a handful of very large ones. See Appendix 1 of the complete publication.
The last three semiannual periods have produced MDL totals eclipsed only by periods in the midst of the dot-com crash.
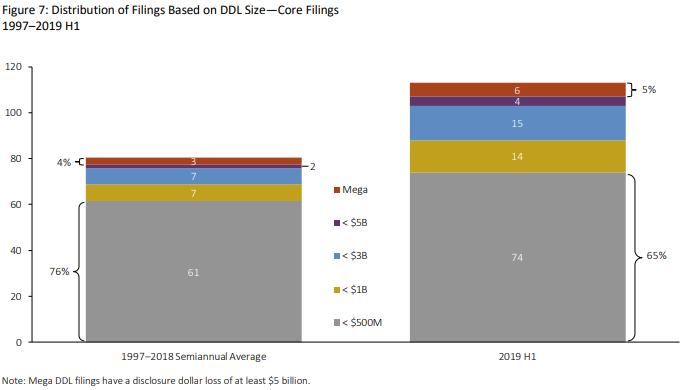
Mega Filings: Distribution of DDL Values
Mega DDL filings have a disclosure dollar loss of at least $5 billion.
- Historically, mega DDL filings have accounted for 4 percent of total filings and 53 percent of total DDL.
- In the first half of 2019, there were six mega DDL filings, double the semiannual historical average but well off the pace of 17 for 2018.
- Mega DDL filings represented 5 percent of total core filings with DDL values, down from 9 percent in 2018, but accounted for 67 percent of total DDL, up from 64 percent in 2018.
- In the first half of 2019, 65 percent of core filings with DDL values had DDL of less than $500 million, below the historical average of 76 percent. Filings with DDL of less than $500 million accounted for 5 percent of total DDL, less than half of the historical average.
Six mega DDL filings made up almost 70 percent of DDL ($120 billion of total DDL of $180 billion).
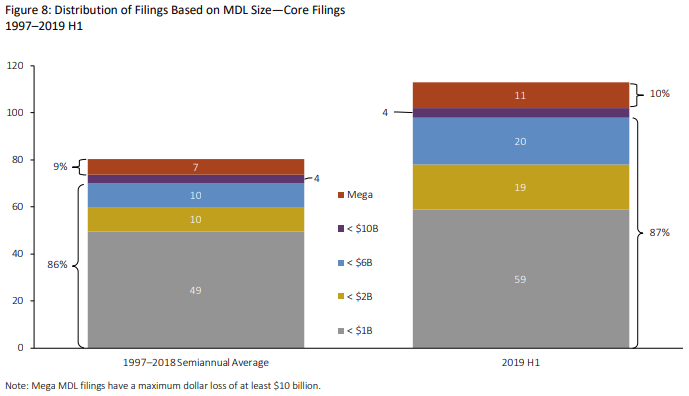
Mega Filings: Distribution of MDL Values
Mega MDL filings have a maximum dollar loss of at least $10 billion.
- There were 11 mega MDL filings in the first half of 2019 compared to the 1997–2018 semiannual historical average of seven.
- In the first half of 2019, 87 percent of filings had small- to mid-sized MDL (MDL of less than $6 billion)—a percentage comparable to the historical average, but up from 76 percent in 2018.
- The MDL of mega MDL filings was 81 percent of total MDL, which would be the third-highest mark of any full year, trailing only 2002 and 2001. The last time MDL from mega filings eclipsed 80 percent of total MDL (2002), mega filings were 21 percent of filings, compared to just 10 percent in the first half of 2019.
Mega MDL filings accounted for 81 percent of total MDL. If this pattern continues, 2019 would have the largest share of total MDL since 2002.
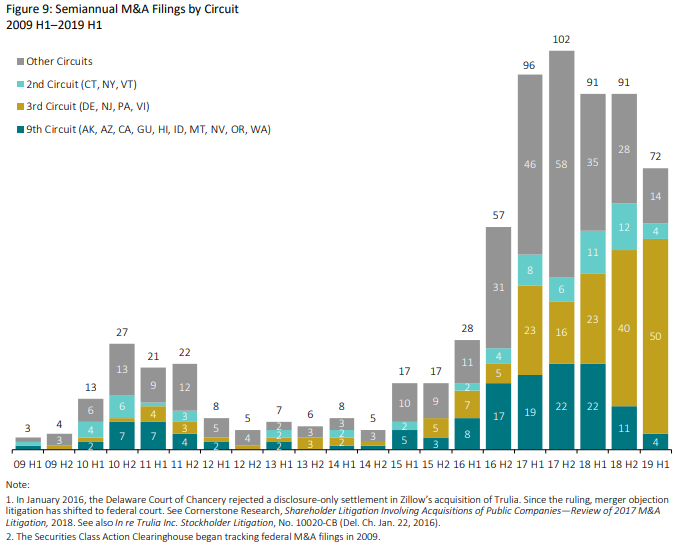
M&A Filings by Circuit
- There were 72 federal M&A filings in the first half of 2019, the fewest since the second half of 2016.
- Filings in the Third Circuit accounted for 69 percent of all M&A filings. The number of filings in all other circuits decreased relative to the second half of 2018.
- M&A filings represented 76 percent of total filings in the Third Circuit, which was the highest percentage of any circuit.
- For additional analysis of M&A filings and related litigation, see Shareholder Litigation Involving Acquisitions of Public Companies—Review of 2017 M&A Litigation.
M&A filings in the Third Circuit continued to grow while the overall number of M&A filings fell substantially.
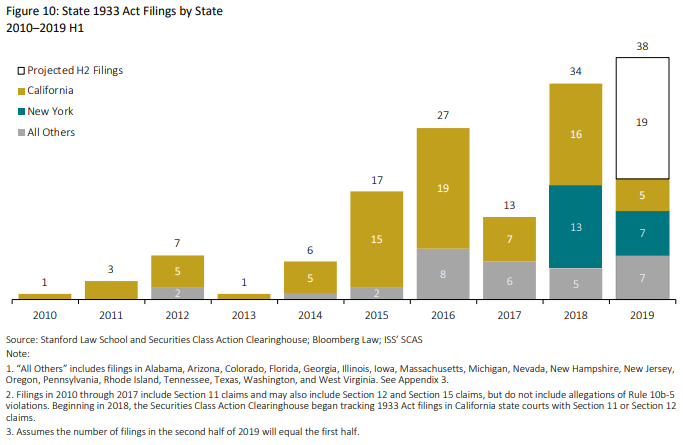
1933 Act Cases Filed in State Courts
In Cyan Inc. v. Beaver County Employees Retirement Fund, the U.S. Supreme Court ruled in March 2018 that 1933 Act claims may be brought to state venues and are not removable to federal court.
- The number of 1933 Act cases filed in state courts (state 1933 Act filings) has trended upward over the last six years, taking into account some year-to-year variation.
- The largest sector subject to state 1933 Act filings in both 2018 and the first half of 2019 was the Communications sector.
- The number of state 1933 Act filings in states other than California and New York is on track to be the highest on record.
Filing activity of 1933 Act claims in New York state courts outpaced California state courts.
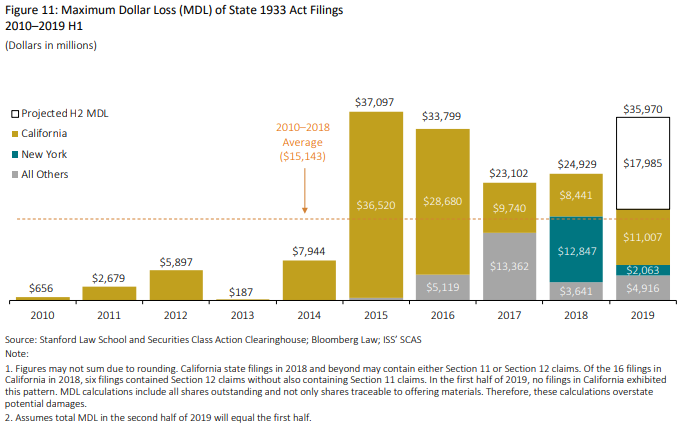
1933 Act Cases Filed in State Courts—Size of Filings
- MDL for state 1933 Act filings is on track to remain well above the historical annual average.
- Although fewer state 1933 Act filings were brought in California than in New York, California filings’ total MDL was more than five times the total MDL in New York in the first half of 2019.
Over one-third of MDL in the first half of 2019 came from a single filing.
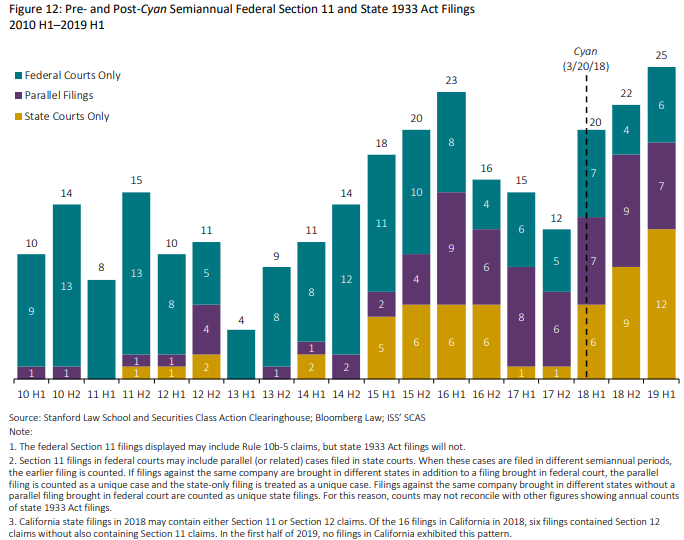
Comparison of Federal Section 11 Filings with State 1933 Act Filings: Pre- and Post-Cyan
Cyan confirmed that state courts may adjudicate 1933 Act claims, which could signal a shift in the jurisdiction in which these claims are predominantly filed. It is becoming apparent that more state-only filings have appeared post-Cyan.
- To date, 61 new 1933 Act filings appeared post-Cyan: 23 parallel filings, 12 filings in federal courts only, and 26 filings in state courts only.
Of the 61 post-Cyan 1933 Act filings, almost half were filed solely in state courts.
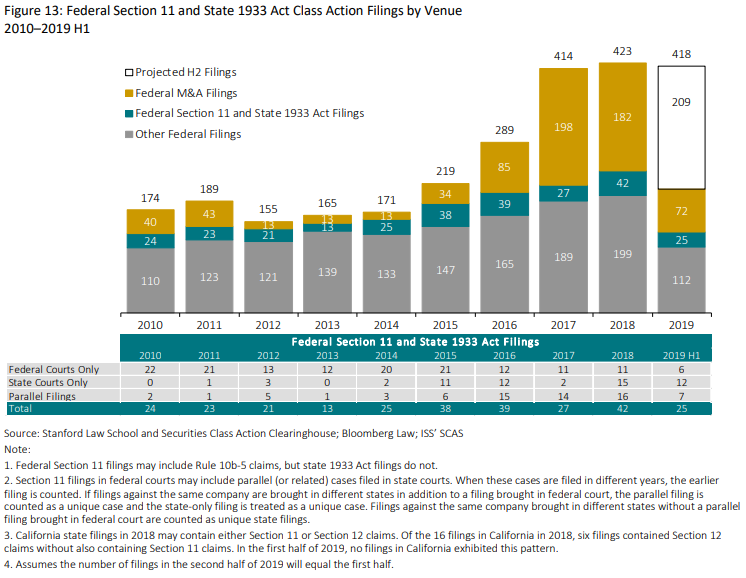
Combined Federal and State Filing Activity—Highlighting Federal Section 11 and State 1933 Act Filings
This analysis highlights federal Section 11 claims, state 1933 Act filings, and the extent to which parallel actions have been filed.
If 1933 Act filings continue at the current rate, there will be more state 1933 Act filings than federal Section 11 filings for the second consecutive year.
- There were 25 combined federal and state 1933 Act filings in the first half of 2019.
- Seven state 1933 Act filings from the first half of 2019 had a parallel federal Section 11 filing.
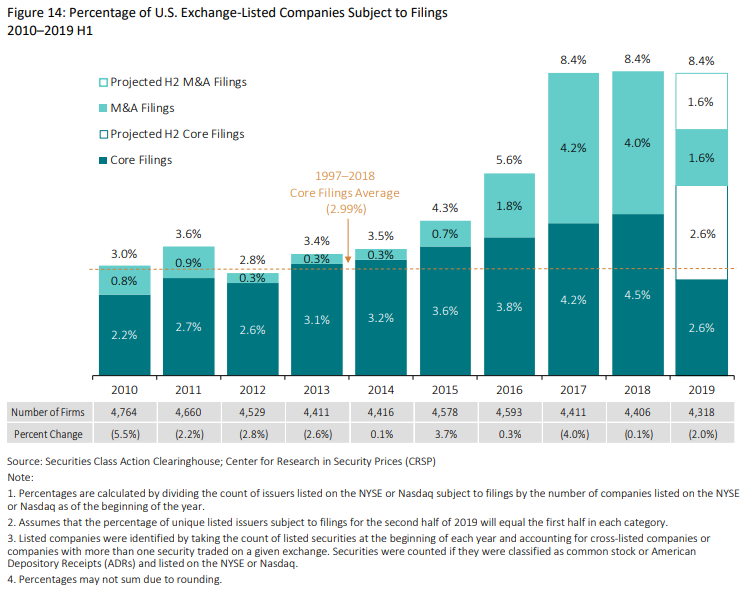
U.S. Exchange-Listed Companies
The percentages in the figure below are calculated as the unique number of companies listed on the NYSE or Nasdaq that were subject to federal securities fraud class actions in a given year divided by the unique number of companies listed on the NYSE or Nasdaq.
- Annualizing data from the first half of 2019, 8.4 percent of companies listed on major U.S. exchanges may become subject to a filing this year. This rate is significantly above the historical average and equal to the 2017 and 2018 rates.
- Of U.S. exchanged-listed companies, 2.6 percent, or 5.2 percent on an annualized basis, were the subject of a core filing in the first half of 2019. This increase in exposure is particularly notable.
- The percentage of companies subject to M&A filings is on pace to decline for the second straight year, after generally increasing between 2012 and 2017.
If the number of core filings in the second half of 2019 equals the first half, the percentage of firms subject to a core filing will increase for the seventh consecutive year.
Non-U.S. Filings
This index tracks the number of core filings against non-U.S. issuers, defined as companies headquartered outside the United States, as a percentage of total core filings.
- In the first half of 2019, core filings against non-U.S. issuers as a percentage of all core filings increased to 23 percent, making it the third-highest percentage on record.
- Over the last nine years, filings against non-U.S. issuers have trended upward, despite year-to-year variation.
The number of core filings against non-U.S. issuers is on pace to be the highest on record.
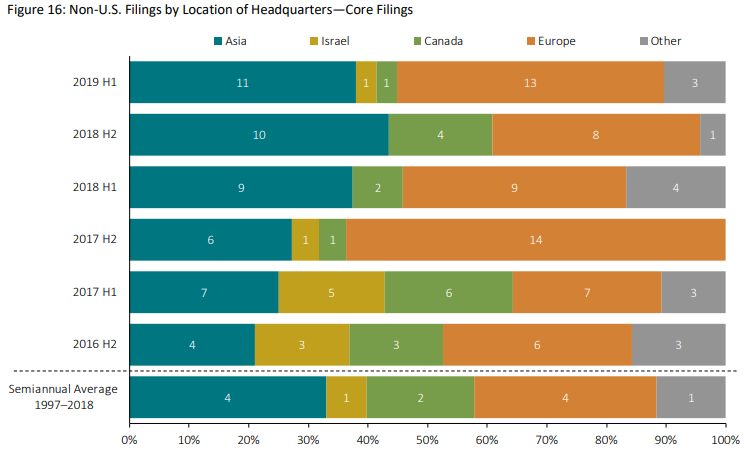
- There were 11 core filings against Asian firms in the first half of 2019. The number of filings against Asian firms has remained high since the first half of 2018. Ten of the 11 filings involved Chinese companies and one was against a Taiwanese company.
- Core filings against European firms increased by 63 percent to 13 filings, just one shy of the record 14 core filings in the second half of 2017.
- For the first time on record, there are filings against firms in Monaco and Bulgaria.
- Of firms headquartered in European countries, only United Kingdom and Irish firms have been the subject of filings in every semiannual period since the first half of 2016. Ireland has seen the most or second-most number of filings among European countries during that time period.
Core filings against European firms were the second highest for a semiannual period.
Status of Securities Class Action Filings
This analysis compares filing groups to determine whether filing outcomes have changed over time. As each cohort ages, a larger percentage of filings are resolved—either through dismissal, settlement, remand to state courts, or trial outcomes.
- For filings from 1997 to 2018, 48 percent of core filings have settled, 42 percent have been dismissed, 8 percent are ongoing, and 1 percent have been remanded to state courts. Less than 1 percent of core filings since 1997 have reached a trial verdict.
- Dismissal rates are higher in the more recent annual cohorts. In three of the six years between 2010 and 2015, at least 50 percent of core filings have been dismissed.
Of years prior to 2018, filings in 2014 have the lowest dismissal rate since 2002.

Filing Lag
This analysis reviews the number of days between the end of the class period and the filing date of the securities class action.
- The median lag for core filings was 24 days in the first six months of 2019. This number has increased significantly from the second half of 2018.
- The median filing lag surpassed the historical median for the first time in the last six years (i.e., since the first half of 2013).
- In the first half of 2019, only 24 percent of core filings were filed within 10 days of the end of the class period. This is the lowest percentage since the first half of 2012.
There was a reversion to the historical median filing lag in the first half of 2019.

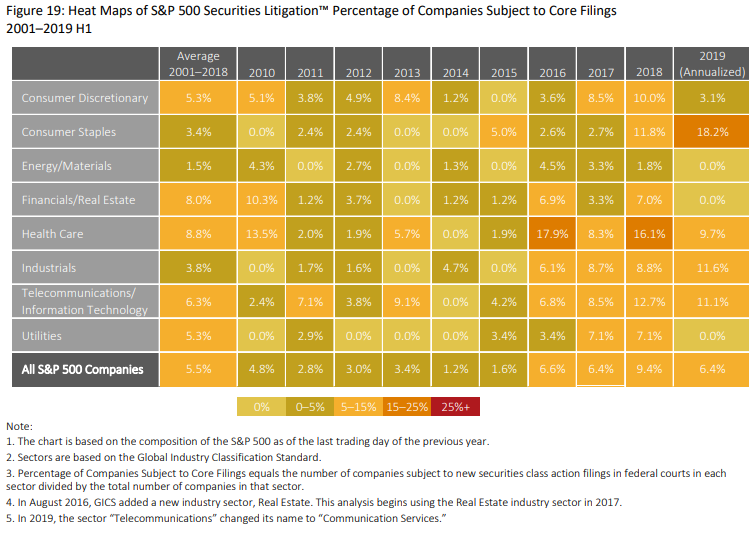
Heat Maps: S&P 500 Securities LitigationTM
The Heat Maps show securities class action activity by industry sector for companies in the S&P 500 index. Starting with the composition of the S&P 500 at the beginning of each year, the Heat Maps address two questions for each sector:
- What percentage of companies were subject to new core securities class actions in federal court during each calendar year?
- What percentage of the total market capitalization was subject to new core securities class actions in federal court during each calendar year?
- On an annualized basis, 6.4 percent of S&P 500 companies were defendants in a core securities class action in the first half of 2019.
- On an annualized basis, the rate of core filings against companies in the Consumer Staples sector of the S&P 500 is on track to be the highest on record at 18.2 percent, a 54 percent increase from last year’s record-setting high.
- On average each year from 2001 through 2018 approximately 5.5 percent of S&P 500 companies, or about one in 18, were the subject of a core filing.
Based on the first half of 2019, the annualized rate of core filings against S&P 500 companies was down from 2018, but above the historical average.
- On an annualized basis, 14.3 percent of the S&P 500 market capitalization in the first half of 2019 was subject to new core filings.
- Over the past three years, the Industrials sector has had at least 19.4 percent of its market capitalization subject to new core filings (on an annualized basis), compared to the historical average of 8.4 percent. The 2019 annualized rate (29.4 percent) is on track to be the highest on record in this sector. See Appendix 4B of the complete publication.
- The percentage of market capitalization in the Telecommunications/Information Technology sector subject to core filings reached 31.0 percent (on an annualized basis), on track to be the highest since 2001.
- In keeping with historical trends, S&P 500 companies subject to core filings are typically larger companies. The proportion of S&P 500 market capitalization subject to litigation in the first half of 2019 was more than double the proportion of S&P 500 companies subject to litigation.
The Telecommunications/Information Technology sector of the S&P 500 was the most common target, as measured by market capitalization.

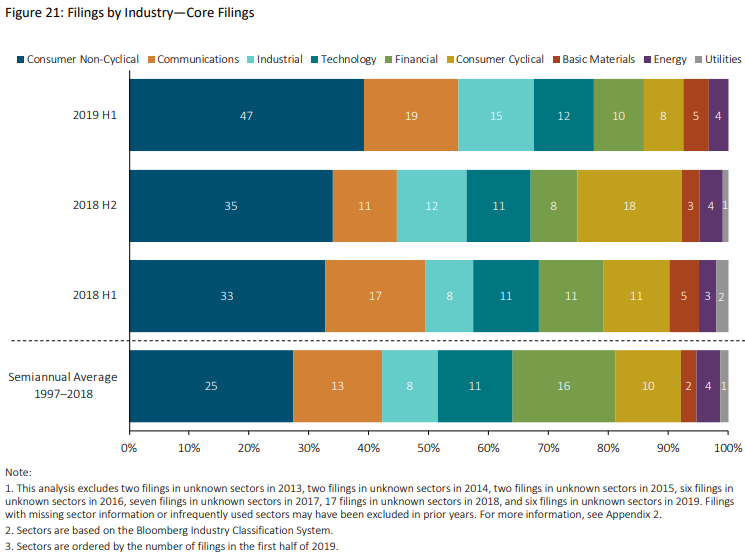
Industry
This analysis encompasses both the large capitalization companies of the S&P 500 and smaller companies.
- The Industrial sector had 15 core filings in the first half of 2019, the most in this sector since the first half of 1999.
- There were 47 core filings in the Consumer Non-Cyclical sector—12 more than in the second half of 2018—but the DDL for this sector dropped by $16 billion, a decline of approximately 25 percent. See Appendix 2 of the complete publication.
- The Communications sector had the second-highest number of core filings, rising 73 percent from 11 in the second half of 2018 to 19 in the first half of 2019.
The Communications sector had 19 filings—all against internet and telecommunications companies.
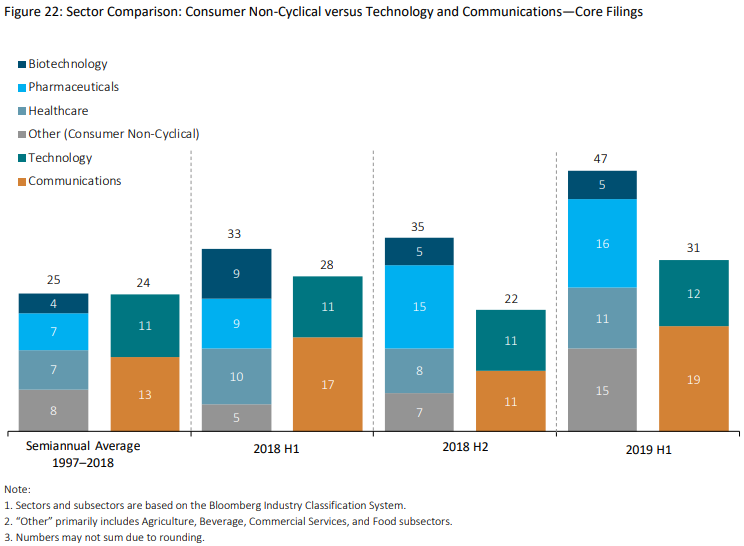
Sector Comparison: Consumer Non-Cyclical versus Technology and Communications
- Core filings involving biotechnology, pharmaceutical, and healthcare companies totaled 32 in the first half of 2019, while core filings involving technology and communications companies totaled 12 and 19 filings, respectively.
- While the number of core filings in the Biotechnology and Pharmaceuticals subsectors remained essentially unchanged, Healthcare subsector filings increased from eight in the second half of 2018 to 11 in the first half of 2019.
- Filings against non-Biotech/Pharma/Healthcare subsector companies increased from seven filings in the second half of 2018 to 15 in the current period.
- The number of core filings involving technology companies in the first half of 2019 was slightly above the semiannual average for this sector, but the DDL associated with these filings was almost nine times higher than the semiannual average. This was largely due to a single filing that accounted for more than 84 percent of the Technology sector’s DDL. See Appendix 2 of the complete publication.
Pharmaceuticals and Healthcare were the most commonly targeted Consumer Non-Cyclical subsectors.
Circuit
- After a spike in the first half of 2018, filings in the Ninth Circuit fell back toward the historical average in the second half of 2018 and first half of 2019. However, the MDL for this circuit remained at elevated levels, with values representing more than three times the historical average in the second half of 2018 and nearly five times the historical average in the first half of 2019. See Appendix 5 of the complete publication.
- The Second Circuit once again had the highest number of core filings with 52. Filing activity in this circuit was more than double the historical average.
- In the Seventh Circuit, core filings fell from six in the second half of 2018 to five in the first half of 2019, but the DDL for this circuit ($21 billion) more than doubled the second half of 2018 figure and was seven times higher than the historical average. See Appendix 5 of the complete publication.
The Second Circuit had the highest number of core filings in any circuit on record.

* * *
The complete report, including glossary and appendices, is available here.