 Print
PrintRebecca Burton is a lead associate and Peter Kim is an associate at Willis Towers Watson. This post is based on a Willis Towers Watson memorandum.
Director pay programs are under greater scrutiny, and S&P 500 companies are striving to anticipate and adapt to this significant change. Compensation limits are at the forefront of this keen interest, with advisory firms Institutional Shareholder Services and Glass Lewis, and shareholders, becoming more vocal and taking direct action. This activism is framed by trends that include avid internal and external interest in board diversity and a shift in board compensation with greater emphasis on equity than on cash pay.
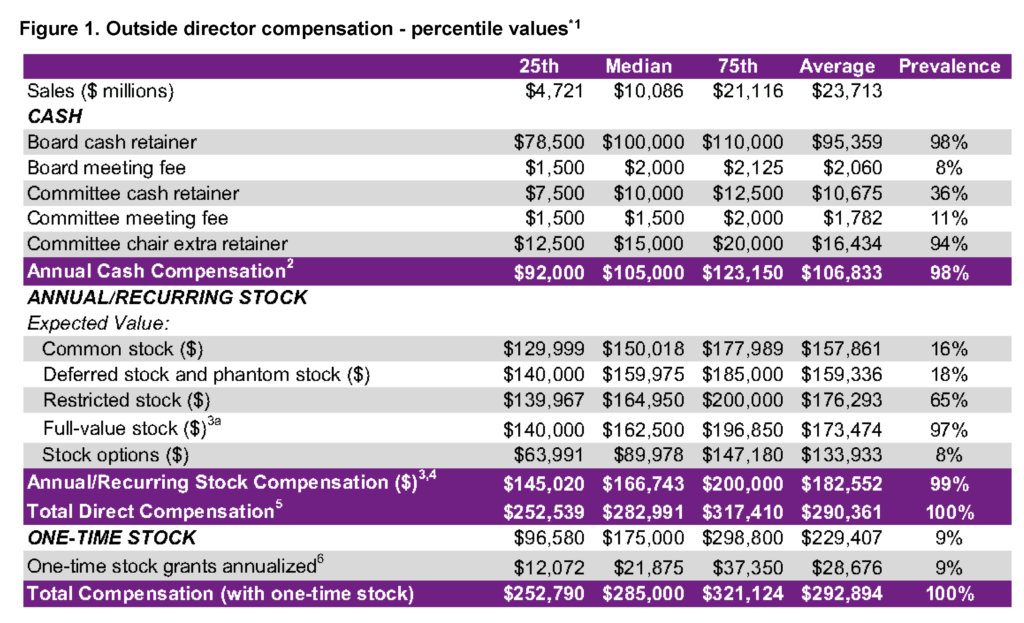
Willis Towers Watson’s Global Executive Compensation Analysis team (GECAT) reviewed and compared S&P 500 director pay program results in 2019 with data from 2018. Figure 1 is an overview of director pay elements with a focus on percentiles and prevalence. Figure 2 breaks out year-over-year changes of the same director pay elements at the median.

[1][2][3][4][5][6]
Key findings
- Pay mix settled at 60% equity and 40% cash, a minute change from last year’s 41% and 59%, respectively. Nearly two-thirds (65%) of companies delivered all or a portion of the annual equity value through restricted stock grants. One-year cliff vesting was favored (64%) followed by immediate vesting (13%).
- Per-meeting fees for attendance at board and committee meetings continued to drift downward, with board meeting fees declining from 9% to 8% and committee meeting fees from 14% to 11%. In contrast, the use of committee member retainers continued to rise, with cash member retainers edging up from 33% to 36%. Even so, median values for these pay elements remained steady.
- The annual board cash retainer increased 5% at the median, from $95,000 to $100,000. The retainer changes combined with the aforementioned meeting fee and member retainer adjustments kept median annual cash compensation static at $105,000. Annual stock compensation went up by 4% (from $160,828 to $166,743) which helped drive overall total direct compensation increases of 3%.
- More than half (55%) of companies made changes to their pay programs in the most recent fiscal year. Exactly half of those companies made changes to the annual cash retainer, while 59% adjusted the annual equity grant. Slightly over one-third of companies (34%) made changes to their annual pay programs that include an adjustment to both the cash retainer and stock grant. Of the companies that made a change to just one component of the cash retainer or equity grant, 25% changed the equity component of their pay program and just 16% adjusted only the cash retainer.
- An uptick (12%) in the median one-time award value was fueled by higher stock prices year-over-year at companies with share-based initial grants. The total value of share-based initial grants increased 35% for the 32% of companies that offered them. Companies using value-based initial grant structures also contributed to the observed year-over-year adjustment, although to a lesser extent than their share-based counterparts. Twenty percent of companies with value-based initial grants made changes to their grant values last year.
Threshold meeting fees
While companies continue to move away from variable pay elements such as board and committee meeting fees, a handful of companies have established meeting policies that trigger payment in extraordinary cases. Our review finds that 8% of companies maintain a threshold board or committee meeting fee policy under which meeting fees are paid out after attendance at a designated number of meetings (threshold) attended per year. The large majority of companies (89%) that have threshold meeting contingencies in place did not otherwise pay meeting fees, but 38% of those companies did maintain committee member retainers.
Annual compensation limits
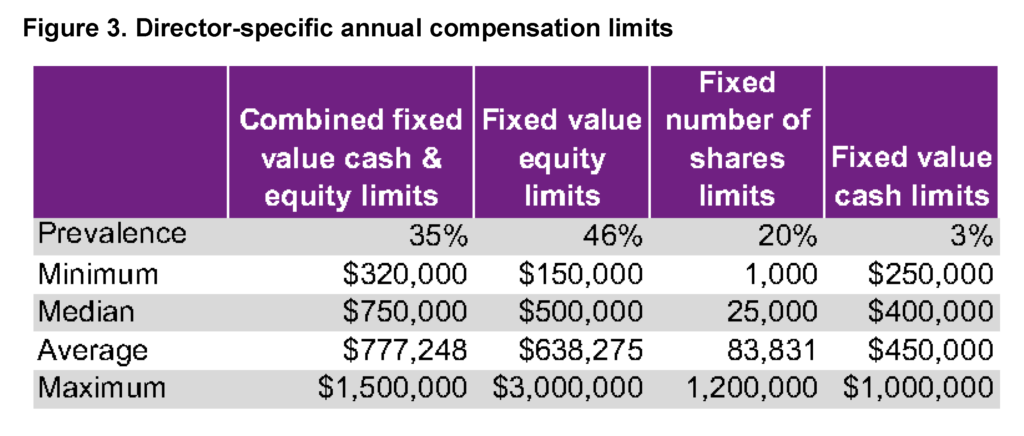
The number of companies with an annual compensation limit continued to grow (63% vs. the previous 55% of the index). There were 16 newly-established limits in the 2019 S&P 500; of these new limits, three-fourths were created as a combined fixed value cash and equity limit. Additionally, there were 18 compensation limits updated in the most recent fiscal year. Seventy-five percent of those updated limits were changed to include cash compensation as part of an overall compensation limit. That information correlates to Figure 3 below, which shows combined fixed-value based cash and equity limits are in greater use. Four-fifths of companies now maintain a value-based limit (up 3% from last year’s 77%). The remaining 20% of limits are share-based. The values at the median continue to hold steady.
Board leadership
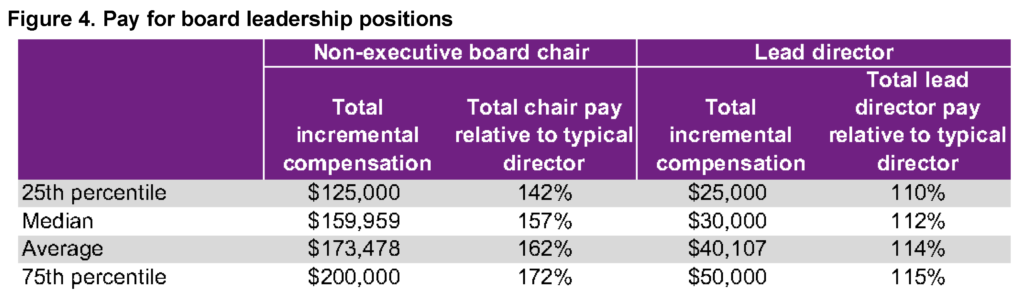
A minor shift shows 53% of companies separate the positions of board chair and chief executive officer, up from 52% in the prior year. Nearly three quarters (74%) of stand-alone board chairs serve in a non-executive capacity (40% of the full S&P 500). Ninety-six percent of companies with a non-executive board chair provide additional pay for such service, with the median value reaching to $160,000, a jump of 7% at the median. Non-executive board chair compensation shifted slightly, and these chairs are now nearly twice as likely to receive an extra cash retainer versus additional equity compensation (88% and 45% respectively) compared with 87% and 46% last year.
As the prevalence of separate board chairs continues to rise, the number of companies which identify a separate lead or presiding director role fell from 71% to 68%. In contrast, 86% of companies with a lead director pay an additional fee for serving in this position, up from 84% last year. As shown in Figure 4, there was no significant shift in pay level for lead directors. Nearly all (97%) companies that pay an additional fee to a lead director use an additional cash retainer, while just 10% grant an additional stock award.
Share ownership and retention
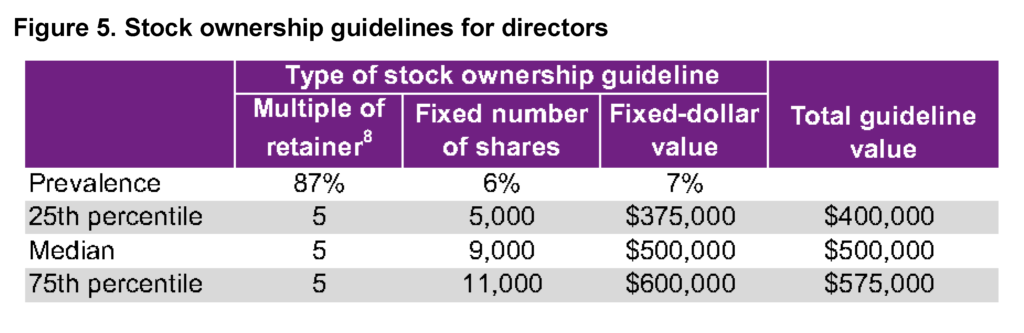
Stock ownership guidelines (Figure 5) and retention requirements are nearly universal, with 95% of companies having one or both. Eighty-two percent of companies have equity ownership guidelines based on a multiple of particular pay elements, and the overwhelming majority (92%) requires a multiple of the annual cash retainer. Multiples using the annual equity grant or a combination of cash and stock tie at 4% each. Meanwhile, 59% of retention requirements mandate a holding period lasting until the stock ownership guidelines are met.
Looking ahead
Equity pay drove increases in director pay programs last year. It will be interesting to observe whether upcoming pay decisions focus on cash elements of pay to balance the traditional pay mix provided to directors as companies compete with peers. Companies must continue to review and adapt their pay programs to reflect board committees’ shifting responsibilities and the potential impact of decisions in external governance and litigious communities to establish reasonable compensation limits for directors.
Endnotes
1The 2019 S&P 500 sample consisted of 498 publicly owned companies in the S&P 500 as of December 31, 2018. The 2018 S&P 500 sample consisted of 499 publicly owned companies in the S&P 500 as of December 31, 2017.(go back)
2Annual cash compensation is calculated as follows:
- Values reported for fees earned or paid in cash in the Director Summary Compensation Table are identified for each director.
- Directors who did not serve the entire fiscal year, as well as directors in leadership positions receiving supplemental compensation (e.g., board chair, lead director) and chairs of the three primary committees (audit, compensation and nominating/governance) are removed.
- The median value is identified for the remaining directors to determine the total cash compensation for “typical” directorial duties.
- The value of the retainer is eliminated from the total cash compensation for the “typical” director to determine the value, if any, of total variable cash fees.
- Annual cash compensation is the combined value of the annual cash retainer and the median value of variable cash fees.(go back)
3Stock compensation is determined using ASC 718 values reported in company proxy statements.
a. Full-value stock represents the combined value of all full-value grants, regardless of the form of the award.(go back)
4All board/committee meeting fees and retainers that are paid in stock are included under annual/recurring stock compensation.(go back)
5Total direct compensation includes annual cash compensation plus annual/recurring stock compensation.(go back)
6One-time stock includes initial and discretionary stock-based grants. The values reflect the incremental additional value above that of the annual grant.(go back)
7Prevalence is inclusive of all compensation limits disclosed by each company. Companies are not limited to only one type of limit per company.(go back)
8Multiple of retainer is inclusive of the following categories: annual cash retainer; annual stock retainer; annual cash and stock retainer; annual equity grant; and annual compensation.(go back)
