 Print
PrintDavid A. Bell is partner in the corporate and securities group at Fenwick & West LLP. This post is based on portions of a Fenwick report titled 2019 Proxy Season Results in Silicon Valley and Large Companies Nationwide.
In the 2019 proxy season, 143 of the technology and life sciences companies included in the Fenwick – Bloomberg Law Silicon Valley 150 List (SV 150) and 99 of the S&P 100 companies held annual meetings that typically included voting for the election of directors, ratifying the selection of auditors of the company’s financial statements and voting on executive officer compensation (“say-on-pay”).
Annual meetings also increasingly include voting on one or more of a variety of proposals that may have been put forth by the company’s board of directors or by a stockholder that has met the requirements of the company’s bylaws and applicable federal securities regulations. [1]
This companion supplement to the Fenwick survey, “Corporate Governance Practices and Trends: A Comparison of Large Public Companies and Silicon Valley Companies,” provides insight into the results of stockholder voting at annual meetings in the 2019 proxy season, [2] allowing directors, executives and practitioners to analyze company results with relevant peers.
Significant Findings
Among the key findings are:
Annual Meeting Participation
- An average of approximately 88.2% of shares of SV 150 companies was represented in person or by proxy at company annual meetings during the 2019 proxy season. However, in addition to the approximately 11.8% not represented, an additional 14.2% were represented via proxy by brokers who did not receive instructions on voting for the bulk of matters for which broker discretionary voting is not permitted. This compares to 12.6% not represented and 15.3% broker non-votes in the S&P 100 in the same period.
- The ranges of representation and voting, though, were somewhat broader in the SV 150 than the S&P 100 (e.g., 55.6% – 98.8% voting in the SV 150, compared to 56.8% – 94.2% voting in the S&P 100).
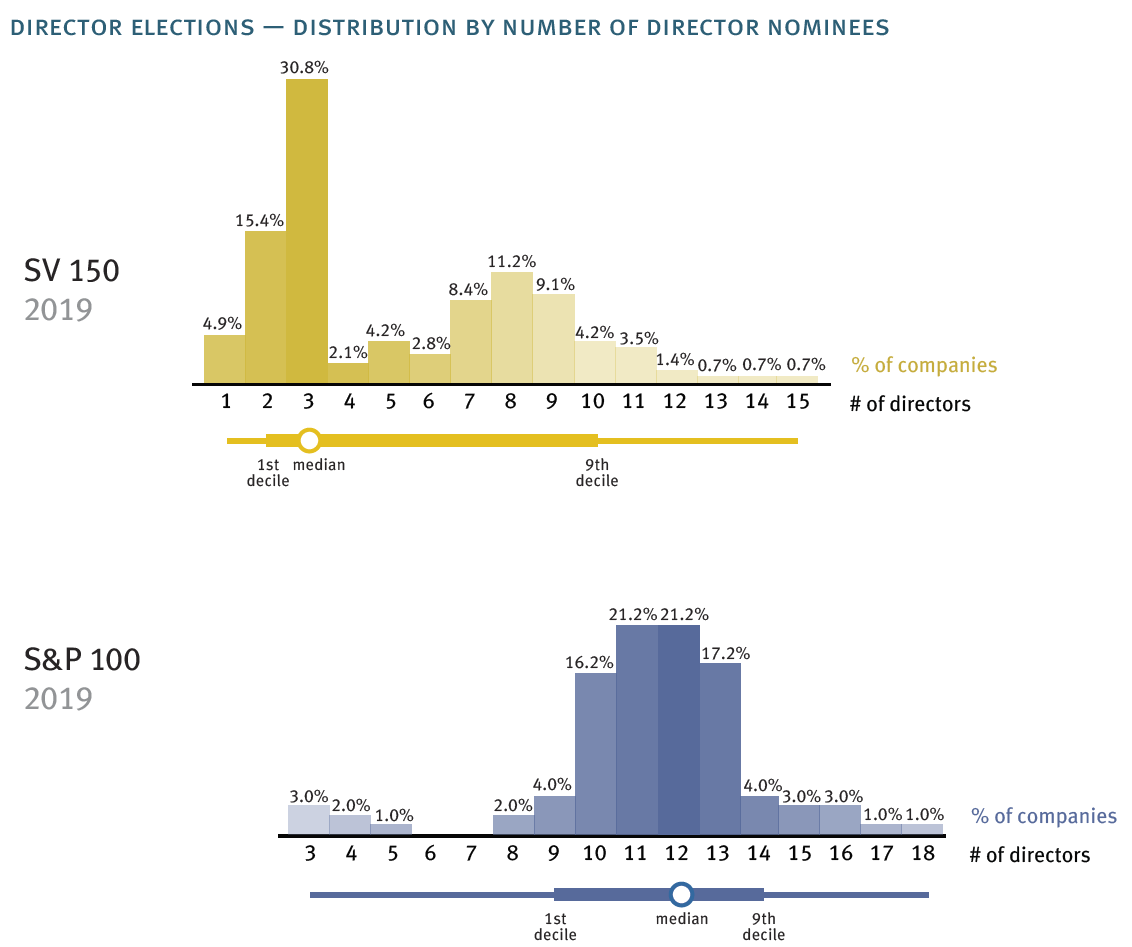
Director Elections
- For the first time in a number of years, there were no contested elections in the SV 150 or the S&P 100 (compared to one SV 150 company and two of the S&P 100 companies in 2018).
- In the 2019 proxy season, all directors in the SV 150 and S&P 100 received more “for” votes than “against” or “withheld” in uncontested elections (compared to one in the SV 150 that did not and none in the S&P 100 in 2018).
- There were 143 uncontested elections of directors in the SV 150 (and 99 in the S&P 100). Since they were uncontested, election of the board-nominated candidates was generally not in doubt, subject only to any applicable majority voting policy.
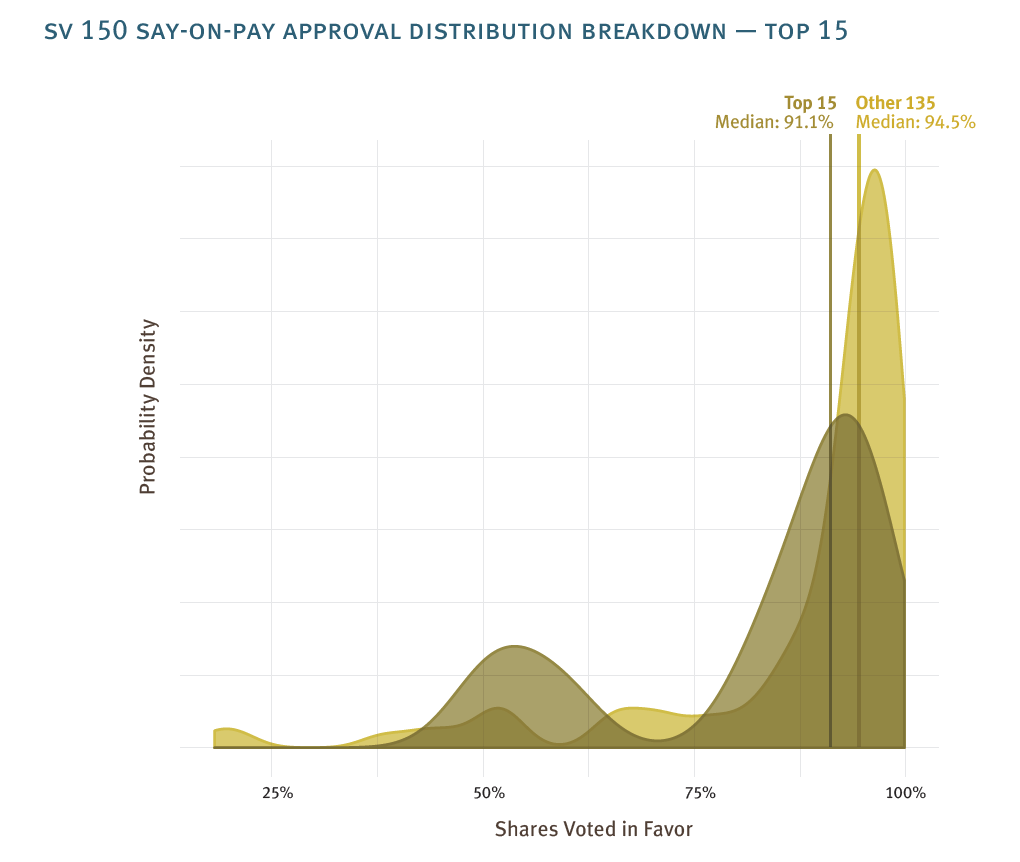
Say-on-Pay
- Opposition to named executive officer compensation reached 15% or more of votes cast (ignoring abstentions and broker non-votes) at 20.9% of SV 150 companies (compared to 17.9% of S&P 100 companies). Within those SV 150 companies with relatively lower levels of support, opposition reached 30% or more at 16 companies (of which 11 had opposition of 40% or more, including six companies where opposition exceeded 50%).
Other Proposals Voted On
- Setting aside director elections, say-on-pay (as well as say-on-frequency) and auditor approval voting, stockholders at SV 150 companies were asked to vote on 127 proposals, while stockholders at S&P 100 companies voted on 223 proposals. The difference is primarily driven by the fact that stockholder proposals are primarily a large company phenomenon. There were only three such proposals voted on by stockholders outside of the top 50 companies in the SV 150.
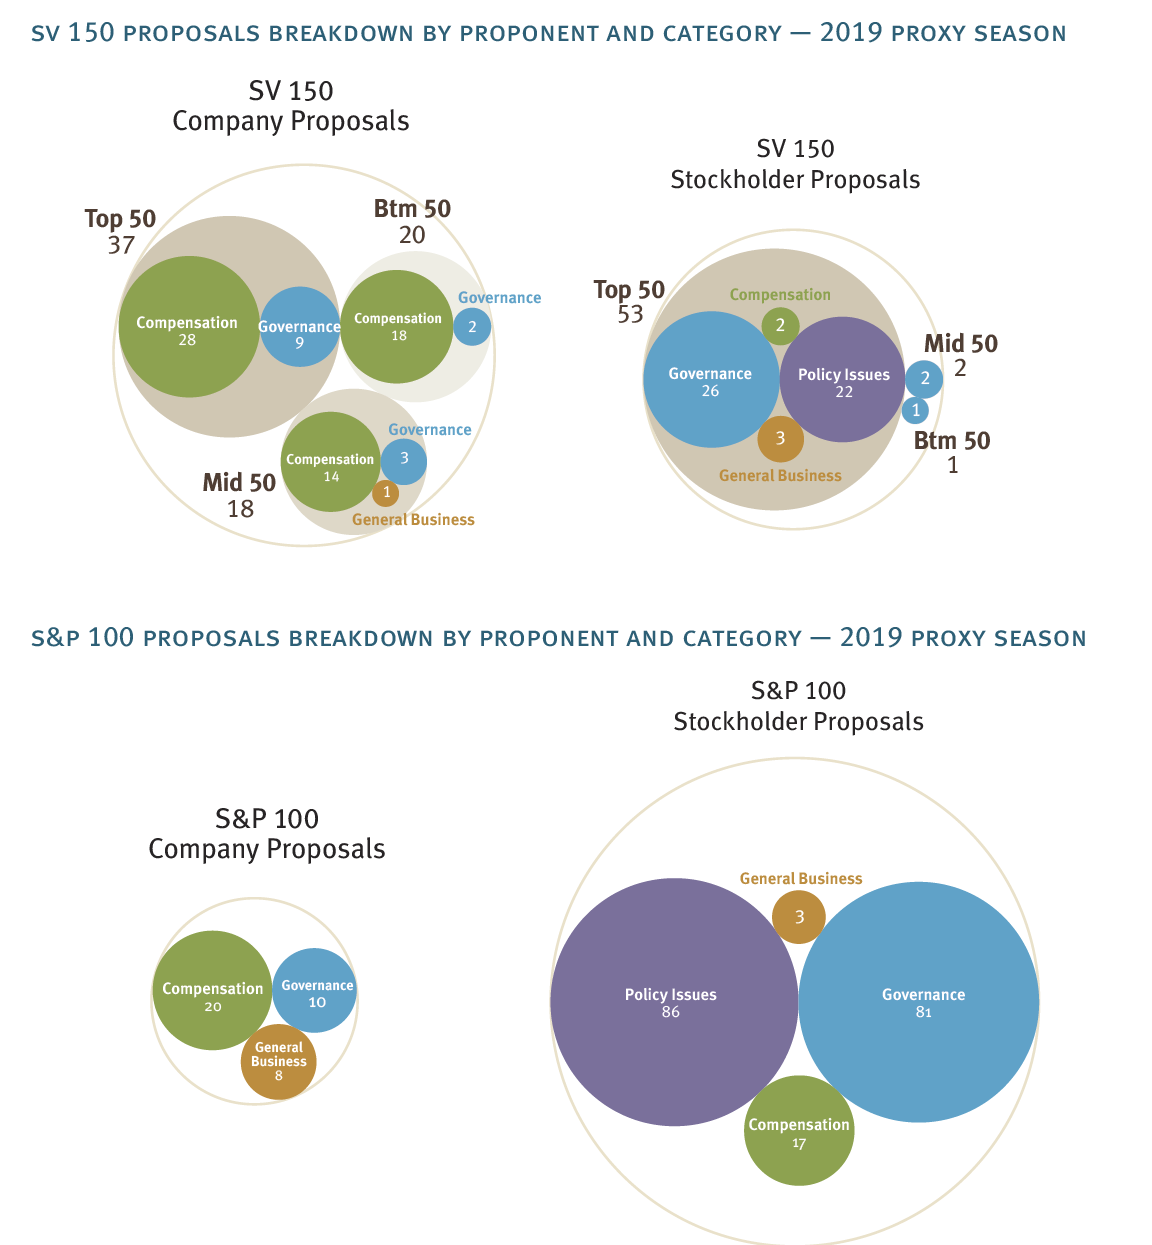
Company Proposals
- Excluding director elections, say-on-pay (as well as say-on-frequency) and auditor approval voting, stockholders at SV 150 companies voted on 75 company-sponsored proposals in the 2019 proxy season, primarily in compensation-related subjects, as well as some governance matters (compared to 38 such proposals at S&P 100 companies).
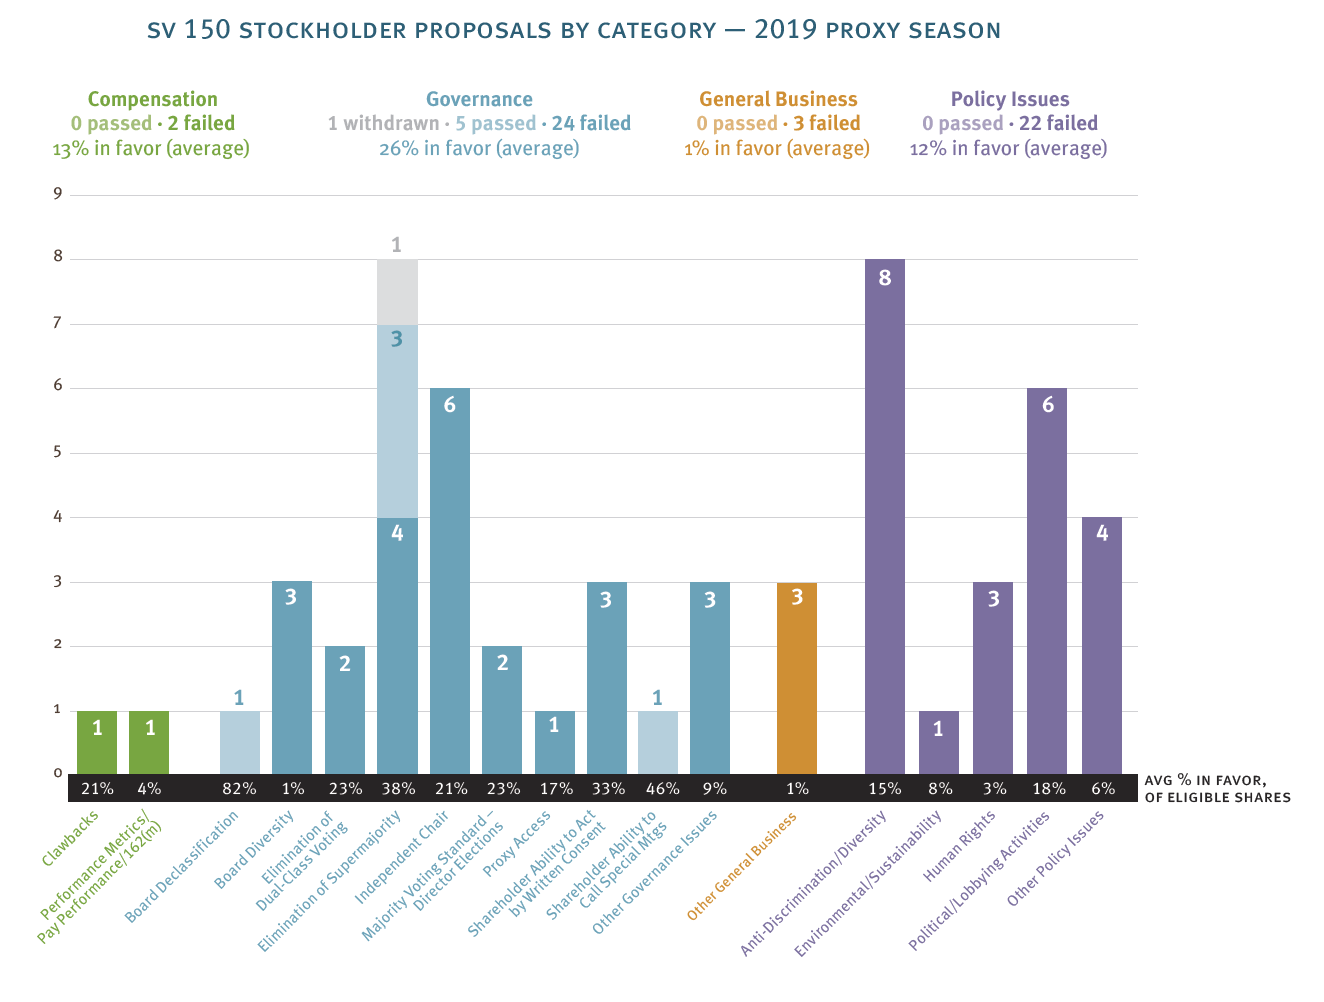
Stockholder Proposals
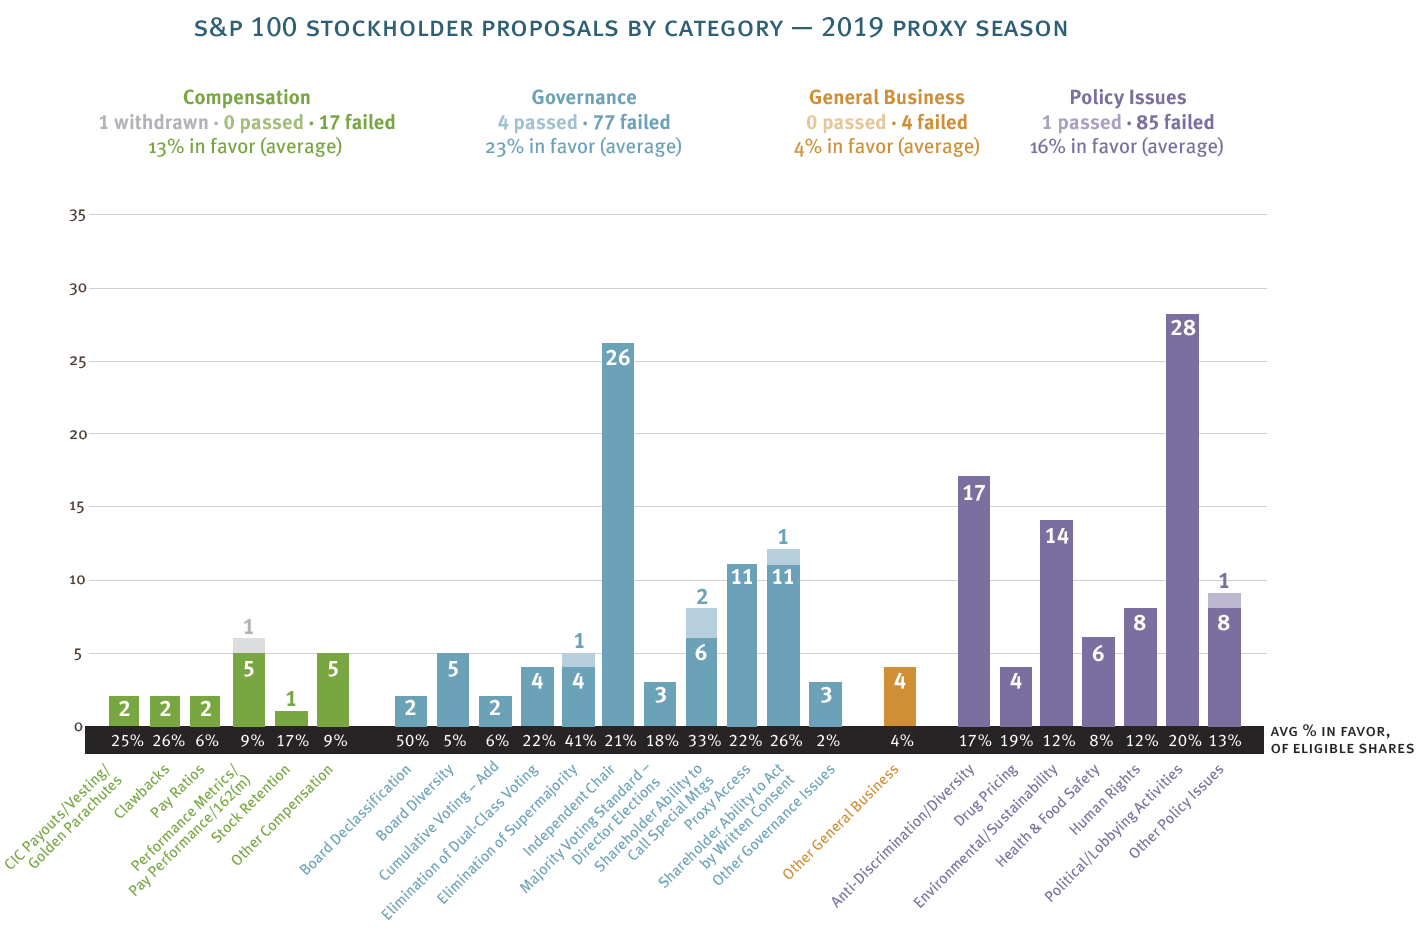
- The stockholder-sponsored proposals voted on in the SV 150 generally focused on governance matters or policy issues (this was also true in the S&P 100).
- The average support for stockholder-sponsored proposals was approximately 25.7% at the SV 150 companies (compared to approximately 25.8% at S&P 100 companies).
- The most common topic for stockholder-sponsored proposals in the SV 150 were anti-discrimination/diversity (eight proposals, none of which were successful) and elimination of supermajority (seven proposals, three of which succeeded).
- The most common such topic in the S&P 100 was regarding political/lobbying activities (28 proposals, none of which succeeded).
In a number of instances the report also presents data showing comparison of the top 15, top 50, middle 50 and bottom 50 companies of the SV 150 (in terms of revenue), [3] allowing for a more carefully tailored view of the activity and results as they are impacted by company size or scale, as well as more relevant comparison to peers (i.e., the S&P 100 compared to their peers in the top 15 of the SV 150).
The complete publication is available here.
Endnotes
1Director elections at each company were treated as a single matter, irrespective of the number of directors being elected.(go back)
2To be included in the data set for a particular “proxy season,” the definitive proxy statement for a company’s annual meeting generally must have been filed by the company with the Securities and Exchange Commission (SEC) during the twelve months ended June 30 of that year (i.e., the proxy statements included in the 2019 proxy season survey were generally filed with the SEC from July 1, 2018 through June 30, 2019 for the 2019 proxy season), irrespective of when the annual meeting was actually held (the annual meetings were usually held about two months following the filing of the proxy statement).(go back)
3The top 15, top 50, middle 50 and bottom 50 companies of the SV 150, include companies with revenue in the following respective ranges: $16B or more, $1.8B or more, $445M but less than $1.8B, and $113M but less than $443M. The respective average market capitalizations of these groups are $191B, $76B, $3.7B and $1.5B.(go back)