 Print
PrintJim Rossman is Head of Shareholder Advisory, Kathryn Hembree Night is Director, and Quinn Pitcher is an analyst at Lazard. This post is based on a Lazard publication. Related research from the Program on Corporate Governance includes The Long-Term Effects of Hedge Fund Activism by Lucian Bebchuk, Alon Brav, and Wei Jiang (discussed on the Forum here); Dancing with Activists by Lucian Bebchuk, Alon Brav, Wei Jiang, and Thomas Keusch (discussed on the Forum here); and Who Bleeds When the Wolves Bite? A Flesh-and-Blood Perspective on Hedge Fund Activism and Our Strange Corporate Governance System by Leo E. Strine, Jr. (discussed on the Forum here).
Key Observations on the Activist Environment in 2019
1. Activist Activity Returns to Multi-Year Trend After Record 2018
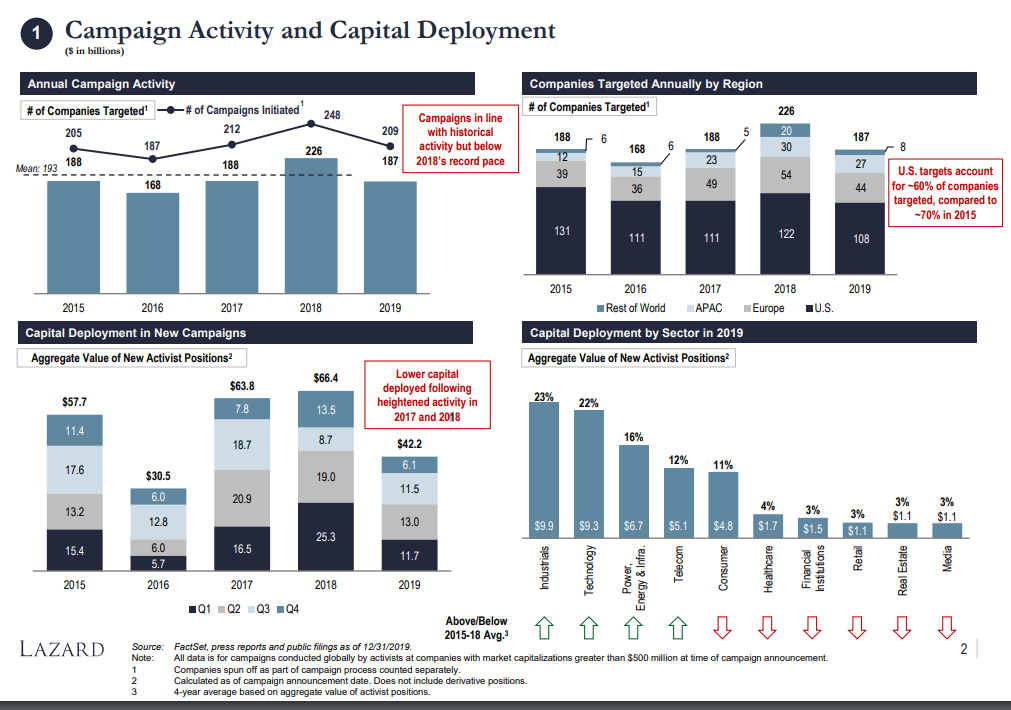
- 187 companies targeted by activists, down 17% from 2018’s record but in line with multi-year average levels
- Aggregate capital deployed by activists (~$42bn) reflected a similar dip relative to the ~$60bn+ level of 2017/2018
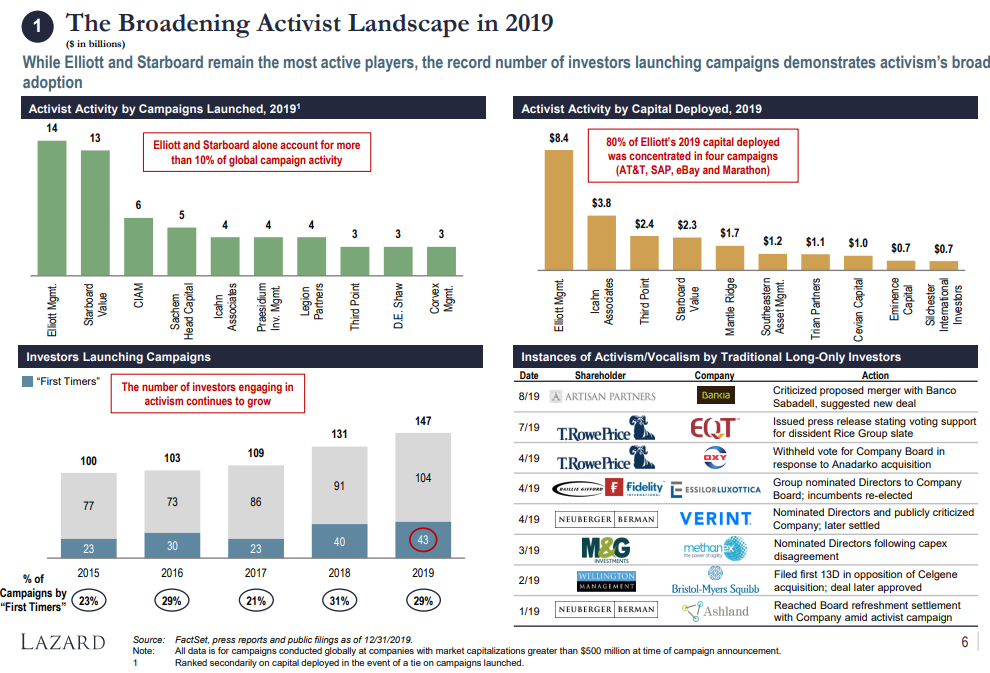
- A record 147 investors launched new campaigns in 2019, including 43 “first timers” with no prior activism history
- Elliott and Starboard remained the leading activists, accounting for more than 10% of global campaign activity
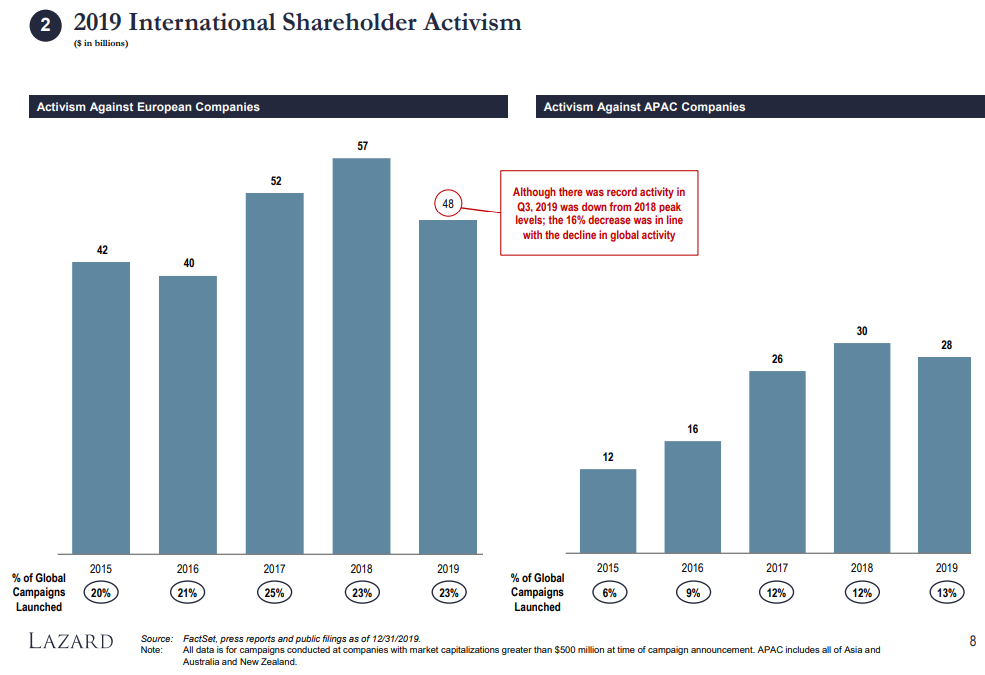
2. Activism’s Continued Influence Outside the U.S.
- Activism against non-U.S. targets accounted for ~40% of 2019 activity, up from ~30% in 2015
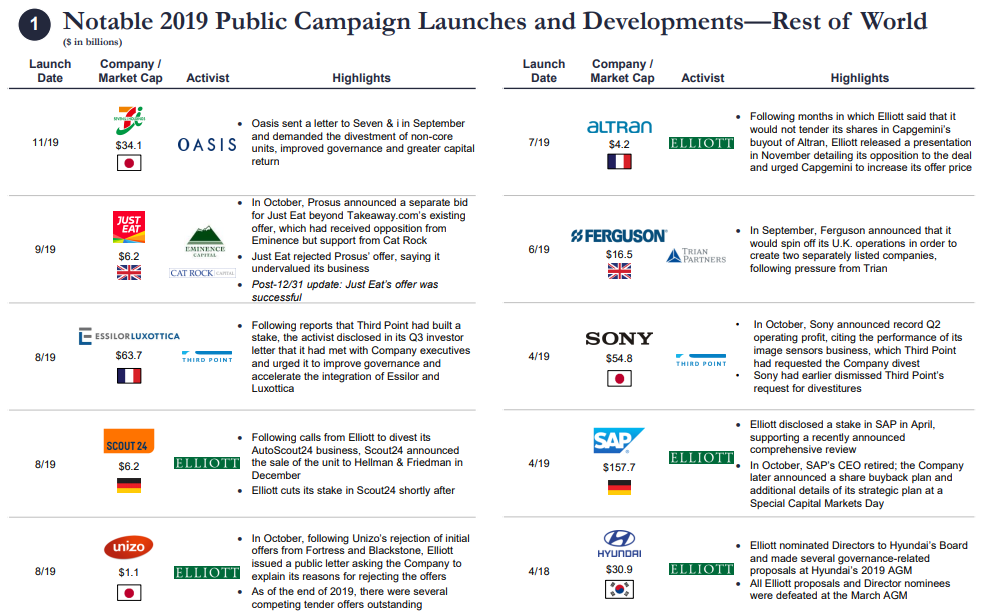
- Multi-year shift driven both by a decline in S. targets and an uptick in activity in Japan and Europe
- For the first time, Japan was the most-targeted non-U.S. jurisdiction, with 19 campaigns and $4.5bn in capital deployed in 2019 (both local records)
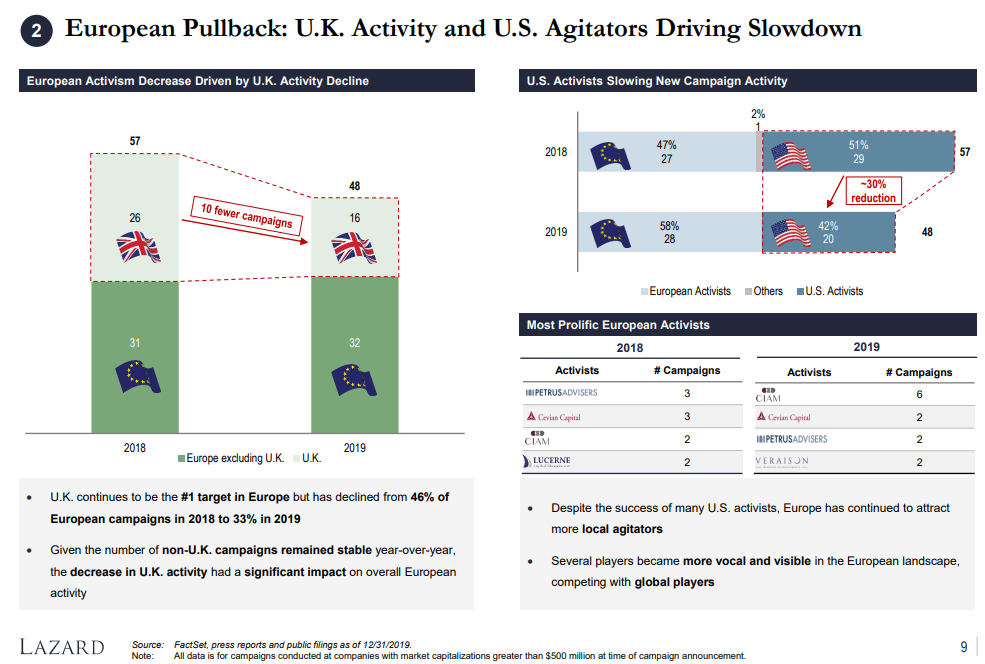
- Overall European activity decreased in 2019 (48 campaigns, down from a record 57 in 2018), driven primarily by 10 fewer campaigns in the K.
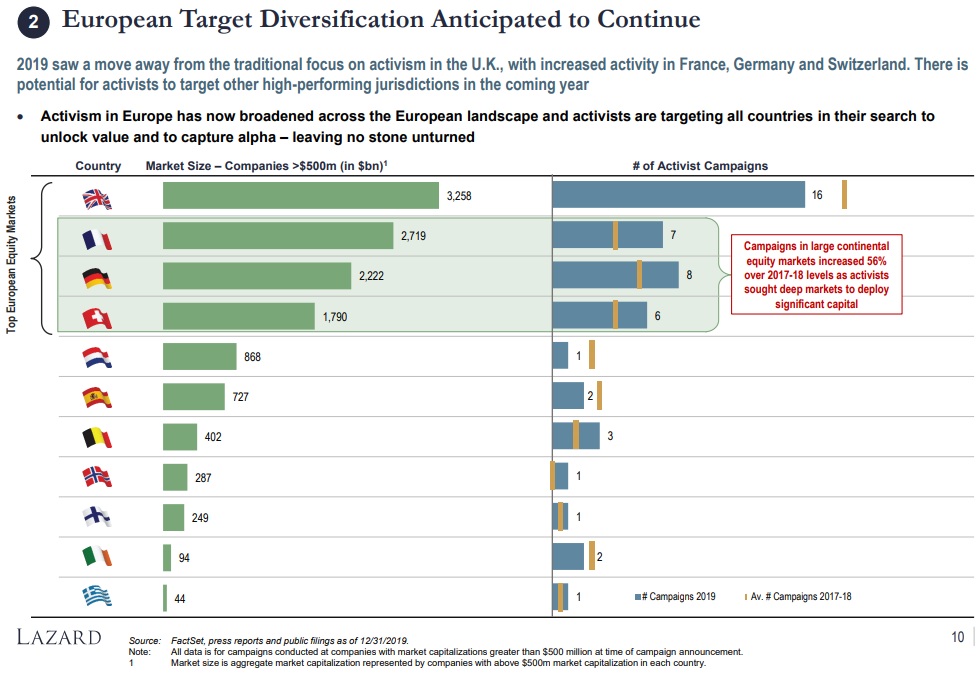
- Expanded activity in continental Europe—particularly France, Germany and Switzerland—partially offset this decline
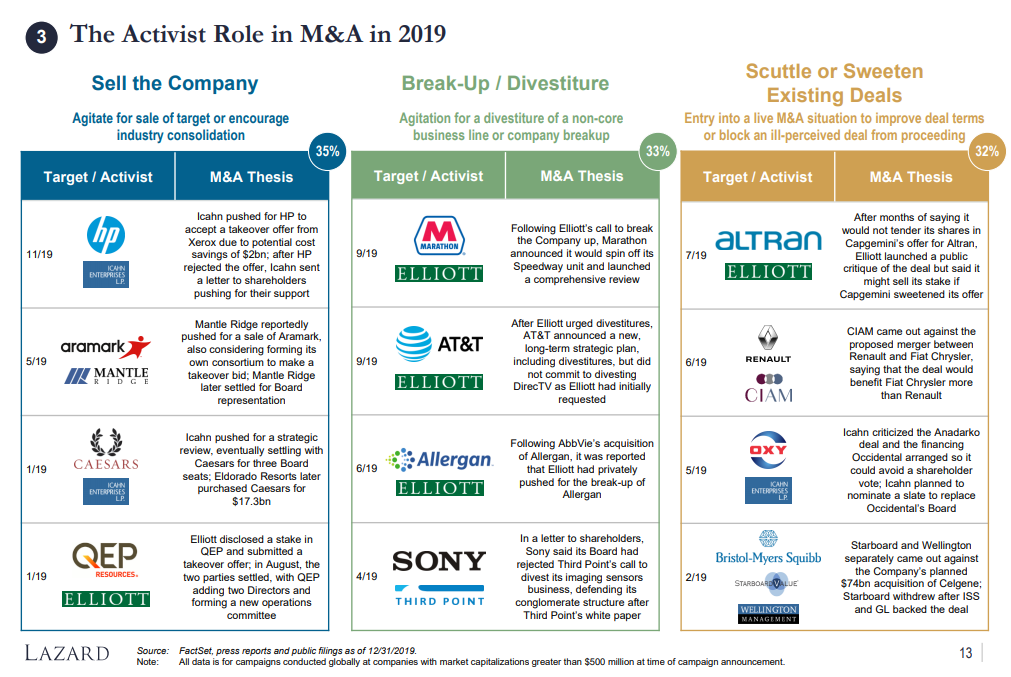
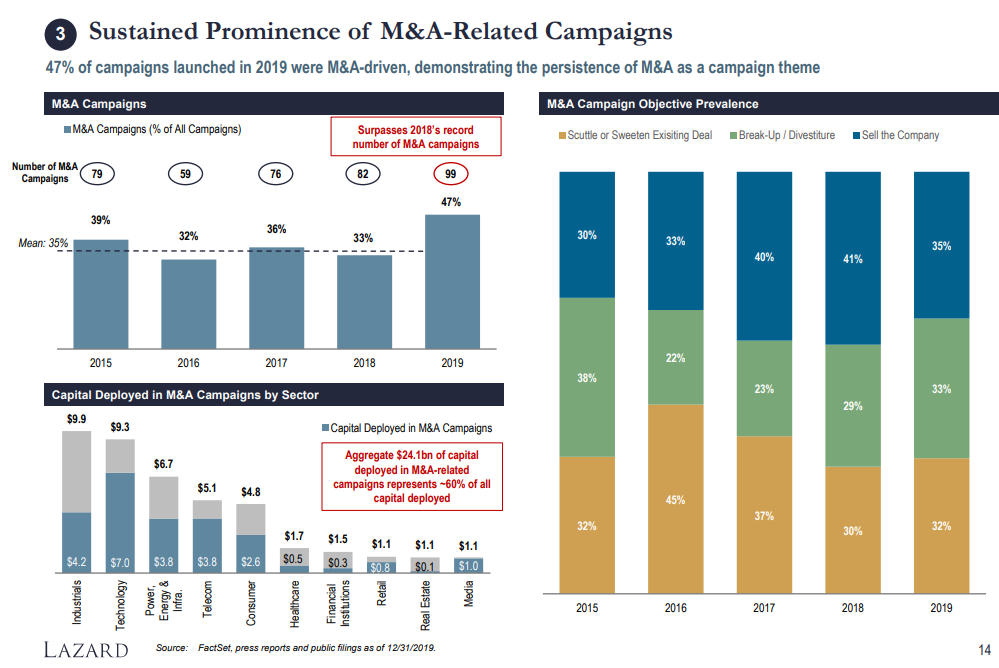
3. Record Number of M&A-Related Campaigns
- A record 99 campaigns with an M&A-related thesis (accounting for ~47% of all 2019 activity, up from ~35% in prior years) were launched in 2019
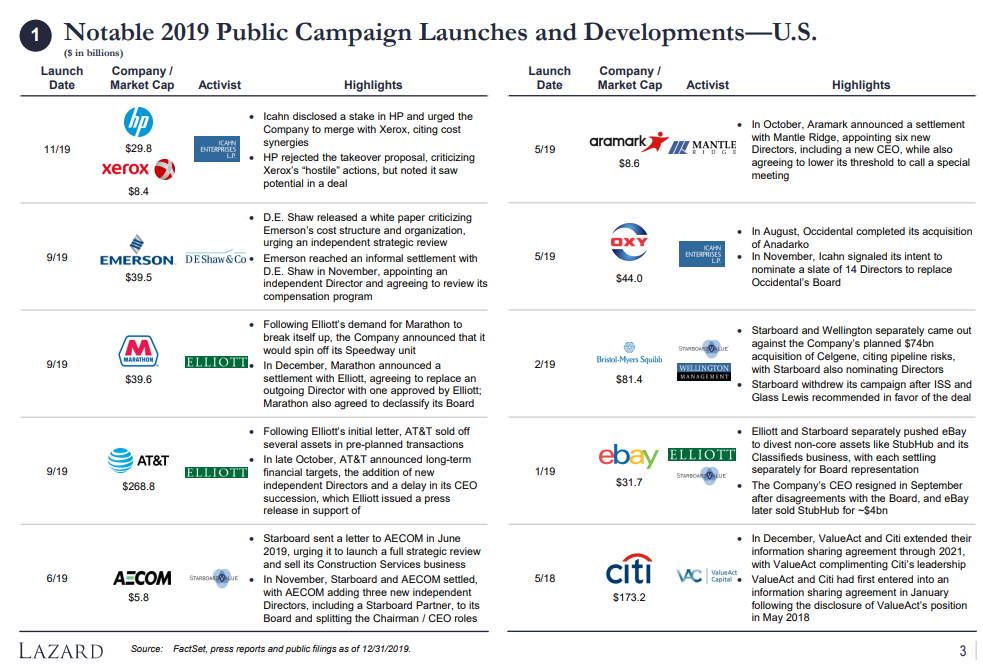
- As in prior years, there were numerous prominent examples of activists pushing a sale (HP, Caesars) or break-up (Marathon, Sony) or opposing an announced transaction (Occidental, Bristol-Myers Squibb)
- The $24.1bn of capital deployed in M&A-related campaigns in 2019 represented ~60% of total capital deployed
- The technology sector alone saw $7.0bn put to use in M&A related campaigns
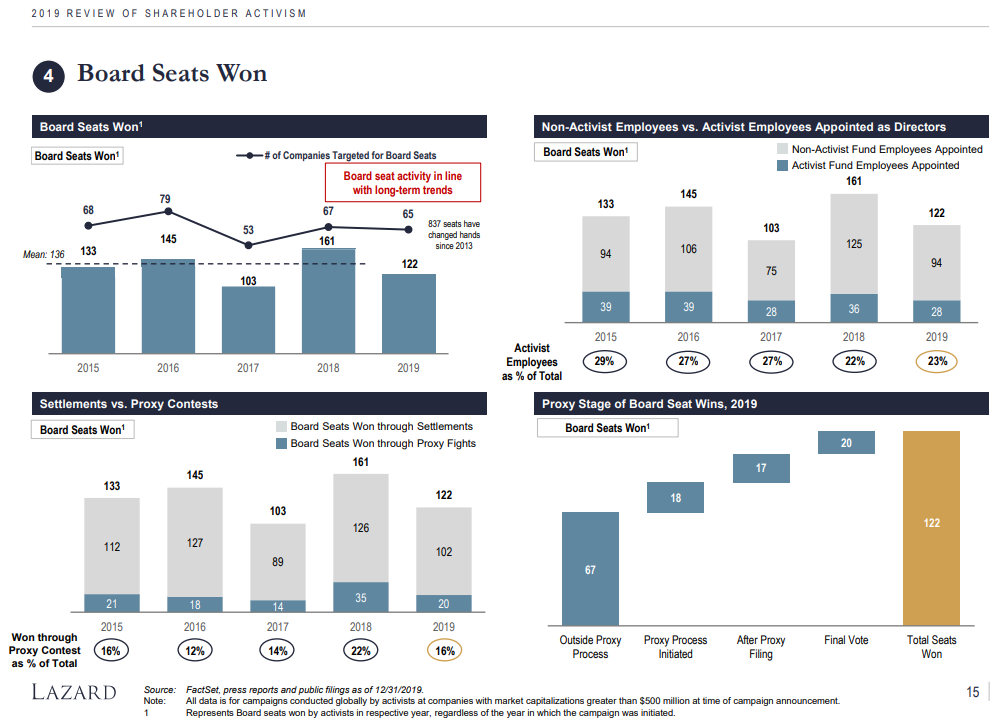
4. Activist Influence on Boards Continues
- 122 Board seats were won by activists in 2019, in line with the multi-year average [1]
- Consistent with recent trends, the majority of Board seats were secured via negotiated settlements (~85% of Board seats)
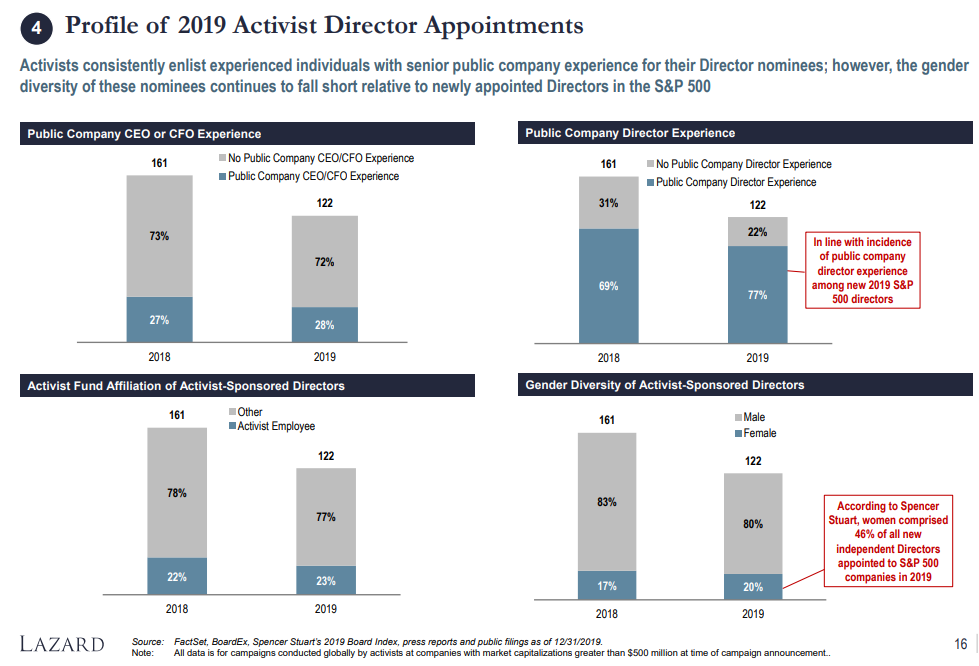
- 20% of activist Board seats went to female directors, compared to a rate of 46% for all new S&P 500 director appointees [2]
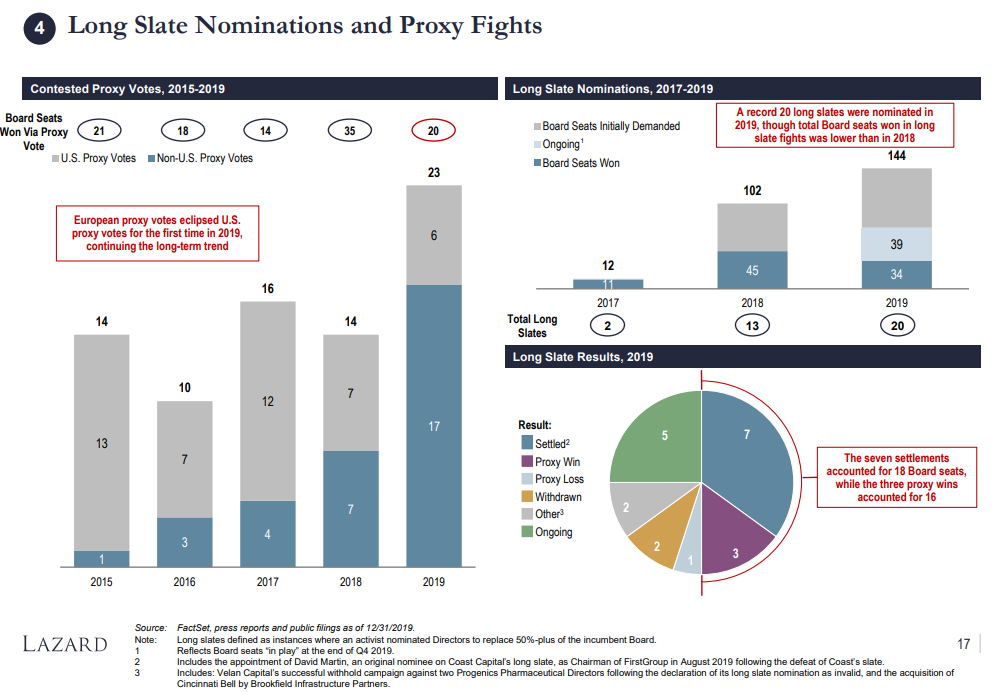
- Activists nominated a record 20 “long slates” seeking to replace a majority of directors in 2019, securing seats in two-thirds (67%) of the situations that have been resolved
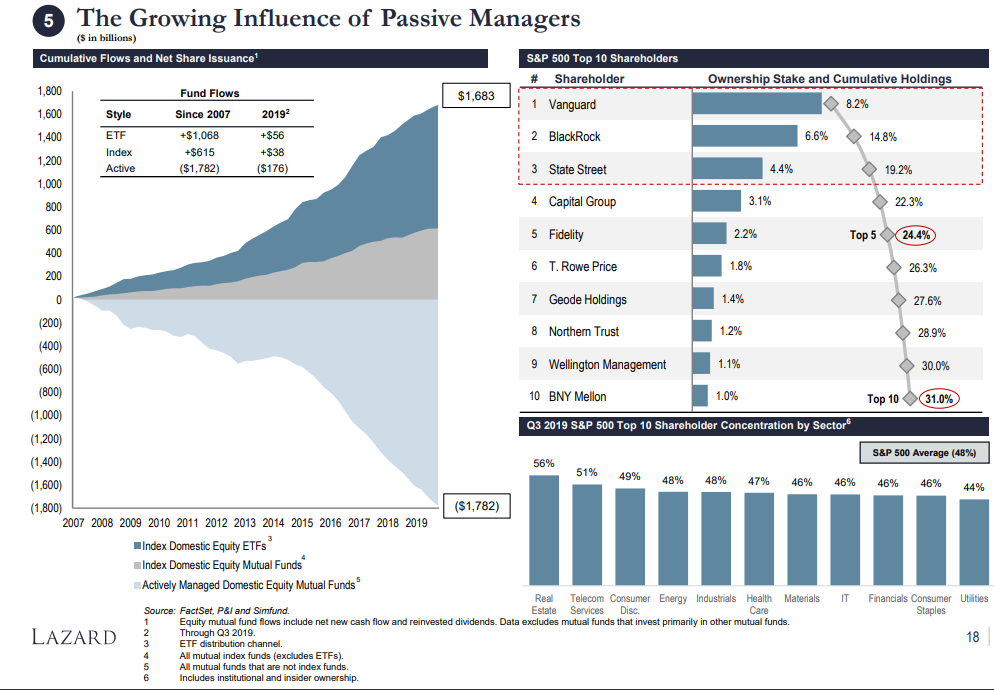
5. Outflow Pressure on Active Managers Intensifies
- Actively managed funds saw ~$176bn in net outflows through Q3 2019, compared to ~$105bn in 2018 over the same period
- The “Big 3” index funds (BlackRock, Vanguard and State Street) continue to be the primary beneficiaries of passive inflows, collectively owning ~19% of the S&P 500—up from ~16% in 2014
6. Other Noteworthy Observations
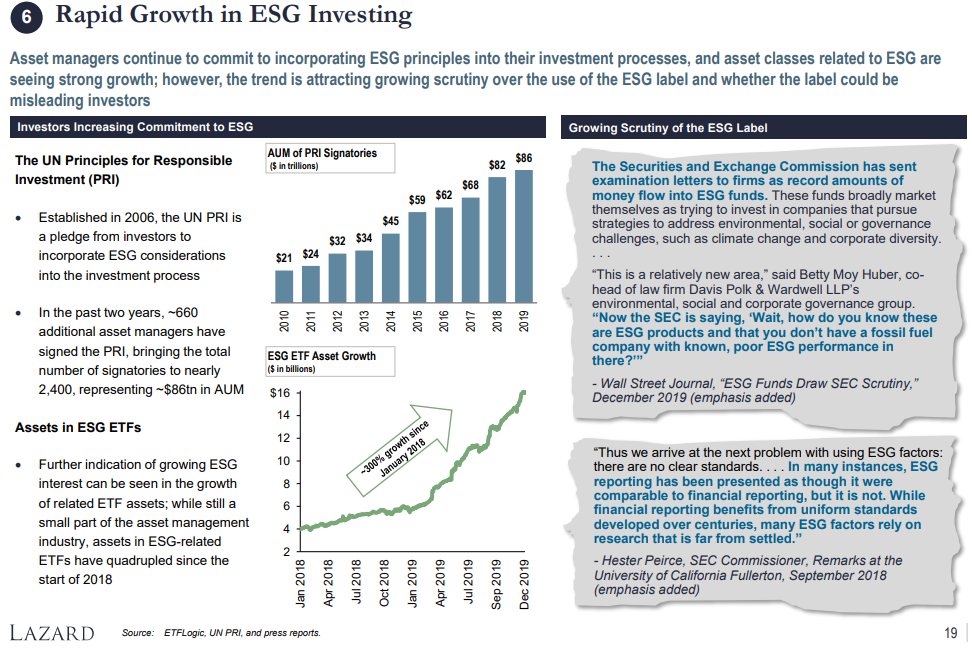
- ESG focus continues to grow: over the past two years, the AUM represented by signatories to the UN’s Principles for Responsible Investment increased ~26% to ~$86tn, and the number of assets in ESG-related ETFs increased ~300%
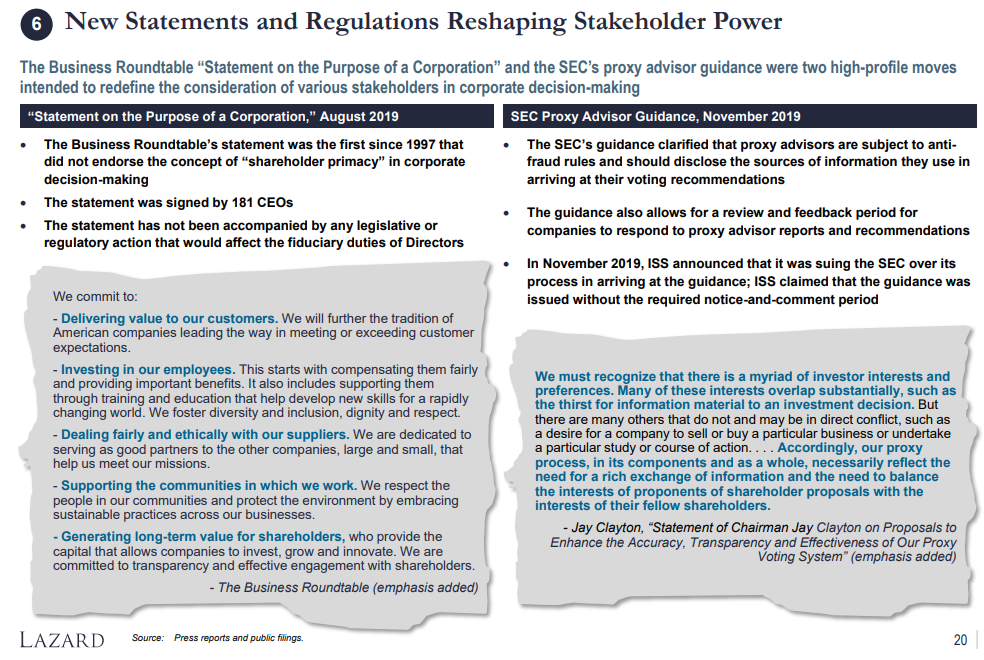
- The Business Roundtable’s “Statement on the Purpose of the Corporation” emphasized the importance of companies incorporating the interests of all stakeholders, not just shareholders, into their decision-making processes
- The SEC’s guidance on proxy advisors sought to increase accountability and oversight standards in their company evaluations
Source: FactSet, ETFLogic, UN PRI, Simfund, press reports and public filings as of 12/31/2019.
Note: All data is for campaigns conducted globally by activists at companies with market capitalizations greater than $500 million at time of campaign announcement.
The complete publication, including Appendix, is available here.
Endnotes
1Represents Board seats won by activists in the respective year, regardless of the year in which the campaign was initiated. (go back)
2According to Spencer Stuart’s 2019 Board Index. (go back)