 Print
PrintAubrey Bout is a Managing Partner, and Brian Wilby and Perla Cruz are consultants at Pay Governance LLC. This post is based on their Pay Governance memorandum. Related research from the Program on Corporate Governance includes The Growth of Executive Pay by Lucian Bebchuk and Yaniv Grinstein; Paying for Long-Term Performance by Lucian Bebchuk and Jesse Fried (discussed on the Forum here); and The CEO Pay Slice by Lucian Bebchuk, Martijn Cremers and Urs Peyer (discussed on the Forum here).
Introduction and Summary
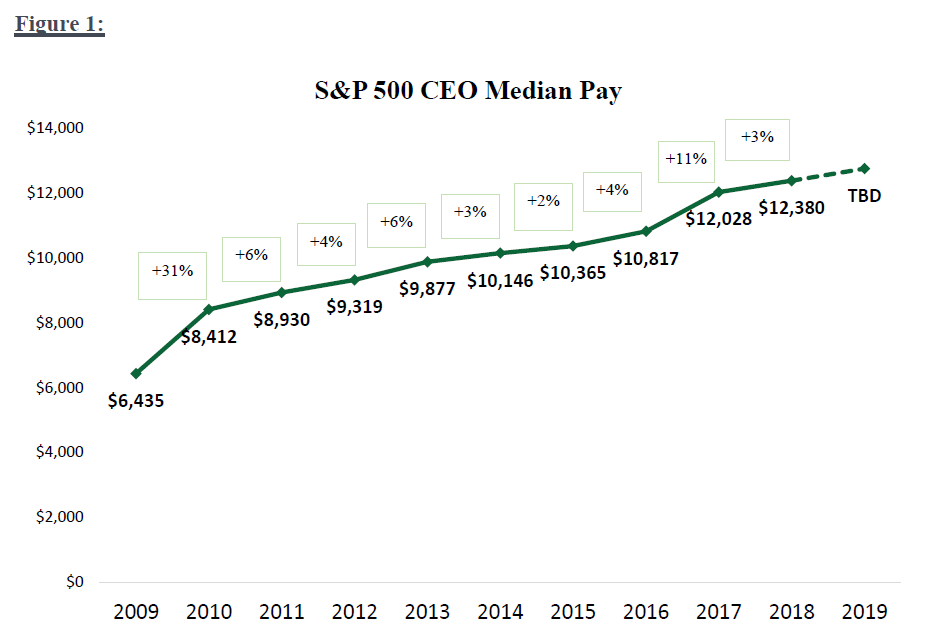
CEO pay continues to be discussed extensively in the media, in the boardroom, and among investors and proxy advisors. CEO total direct compensation (TDC; base salary + actual bonus paid + grant value of long-term incentives [LTI]) increased at a moderate pace in the first part of the last decade —in the 2-6% range for 2011-2016. CEO pay accelerated with an 11% increase in 2017, likely reflecting sustained robust financial and total shareholder return (TSR) performance, before returning to 3% in 2018, which is more in line with historical rates. Our CEO pay analysis is focused on historical, actual TDC, which reflects actual bonuses; this is different from target TDC or target pay opportunity, which uses target bonus and is typically set at the beginning of the year.
As proxies are filed in early 2020, we expect to find that 2019 CEO TDC increases will be modestly higher (in the low single digits) due to low 2018 TSR (-4% S&P 500 TSR) and economic uncertainty during Q1 2019 when LTI grants were made. Increases in 2019 actual pay will be primarily driven by higher cash bonuses as most companies had strong financial performance in 2019 and exceeded annual goals.
With regard to 2020 CEO target pay, however, we are expecting increases to be in the mid- to upper-single digits as a result of strong 2019 performance and substantially positive TSR in 2019 (S&P 500 TSR was +31%). Executives in industries with favorable economic conditions and higher growth (e.g., technology) will likely see more significant pay increases than those in slow-growth industries.
Key Findings
- CEO actual pay among S&P 500 companies has increased in the 2-6% range over the last several years; it accelerated to 11% in 2017 and decelerated to 3% in 2018.
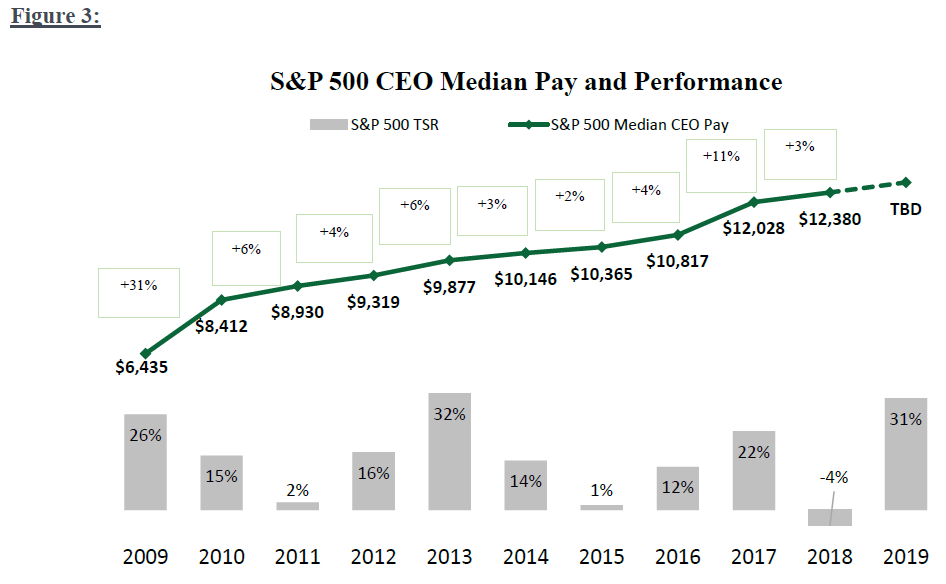
- Historical CEO pay increases have been supported by total shareholder return (TSR); in fact, annualized pay increases have been 6 percentage points lower than TSR performance.
- We expect median CEO target pay increases in early 2020 to be in the mid- to upper-single digits due to strong company performance and high TSR (+31% S&P 500 TSR in 2019). Individual CEO pay increases will continue to be closely tied to overall company performance and peer group compensation increases.
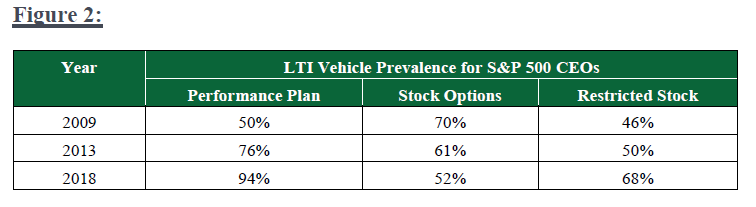
- Performance share plan usage seems to have peaked with 94% of S&P 500 companies employing them (an increase from 88% in 2018) while restricted stock has cemented its position with 68% prevalence in LTI vehicles.
- Stock options have continued their steady decline but are still prevalent in 52% of LTI vehicles; there could be an uptick in stock option usage in the future (2021), especially if a recession were to occur and companies begin to struggle to set long-term goals in their performance share plans.
Historical Trends in CEO Pay and LTI Vehicles
CEO pay rebounded 31% in 2010 after -9% and -13% decreases during the financial crisis of 2008 and 2009, respectively. Since then, year-over-year pay increases have been moderate—in the 2-6% range—except for the 11% increase in 2017 (Figure 1).
Over the last several years, LTI vehicle use has shifted away from stock options, mostly in favor of
performance-based plans. From 2009 to 2018, performance plan and restricted stock prevalence increased, and stock option prevalence decreased (Figure 2). The rise in performance-based plans can largely be attributed to the introduction of Say on Pay and the preferences of proxy advisors and some shareholders toward LTI systems that they consider to be “performance-based” (note: the proxy advisors do not consider stock options to be performance-based). This being said, we would not be surprised to see stability in the use of stock options—or even an uptick in usage in the future given the stock market’s current volatility. We noticed that many companies made stock option grants during the depth of the Great Recession in early 2009: this is likely because stock options provided a direct linkage to share price improvements and an opportunity for significant upside leverage, as well as the difficulty in setting multi-year goals at the time.
Trends in CEO Pay versus S&P 500 Index Performance
In recent years CEO pay increases have been supported by strong TSR. In fact, pay increases over the last 8 years have trailed TSR performance by ~6% when examining the compound annual growth rates of compensation and shareholder return (TSR CAGR was 11% while CEO pay grew at 5%). In every year marked by outsized TSR since 2009, CEO pay increased by a greater than average growth figure (Figure 3). These increases were not always proportionate: from 2010-2018, CEO annual pay increases were between 2% and 11%, while the S&P 500 TSR ranged from -4% to 32%.
There is a positive correlation between share price performance and CEO pay. In a positive stock price environment, Compensation Committees are often more supportive of CEO pay increases, typically delivered via larger LTI grants, while CEO base salaries increase modestly or periodically (i.e., less frequently than an annual basis) and comprise a small portion of the executive pay package. Annual actual bonuses, though not as significant as the LTI portion of total compensation, can have a meaningful impact on whether compensation grows year over year. When a company is having a good year and is exceeding budget goals and investor and analyst expectations, the CEO bonus often pays above target and increases year over year (often, the share price also increases as company performance is strong). That said, there will be some years where a CEO’s bonus pays above target when the company exceeded its budgeted goals, while the share price goes down due to stock market volatility or correction and sector rotation. The opposite can also happen: goals are not met, resulting in lower bonuses, while the stock market goes up.
CEO Pay Projections
- We expect 2019 CEO TDC increases to be in the low single digits due to low TSR (-4% S&P 500 TSR) in 2018 and economic uncertainty during the first part of Q1 2019 that impacted Q1 2019 target pay decisions. Increases in 2019 actual pay will be primarily driven by higher cash bonuses as most companies had strong financial performance in 2019 and exceeded annual goals.
- Aggregate S&P 500 Index year-over-year revenue and operating income for 2019 are forecasted to increase by 3-5% and 0-2%, respectively (S&P Capital IQ).
- We expect median CEO target pay increases in early 2020 to be in the mid- to upper-single digits as a result of strong performance and large increases in TSR (+31% S&P 500 TSR) in 2019.
- Looking into the future, likely slower earnings growth, a high CEO pay ratio, proxy advisor scrutiny, an election year where income equality will be highlighted as a societal problem, and media coverage of it all could exert negative pressure on executive pay.
- in certain high-growth industries (e.g., technology) and high-performing companies, executives may experience continually increasing growth in total compensation in 2020, while executives in slow-growth industries or low-performing companies might see minimal or no increases.
The above projections do not account for major market shocks (e.g., geopolitical or trade uncertainty, dramatic changes in the economic or political environment, significant and unanticipated modifications to the Federal Reserve’s interest rate policies, or significant drops in the overall stock market).
Methodology
The CEO pay analysis consists of S&P 500 companies led by CEOs with a ≥3-year tenure. Pay data includes base salaries and bonuses paid for each year as well as the reported grant date fair value of LTI awards. Our analysis of consistent incumbent CEOs was designed to highlight true changes in CEO compensation (as opposed to changes driven by new hires or internal promotions, which typically involves ramped-up pay over a period of 1-3 years).
Note on Realizable Pay
Our methodology used year-over-year CEO actual pay and was based on the accounting value of LTI as reported in proxy summary compensation tables. These amounts are more akin to pay opportunity than realizable pay, which includes in-the-money value of stock options, ending period value of restricted stock, and estimated value of performance shares. Our past research has strongly correlated realizable pay and TSR performance. While we have shown there is a positive correlation between CEO annual pay increases and TSR performance, we are confident the correlation is not as significant as that between realizable pay and TSR increases.
