 Print
PrintBennett Stewart is Senior Advisor at Institutional Shareholder Services Inc. This post is based on his ISS memorandum.
In recent months, critics have emerged with claims that Economic Valued Added (EVA) is a less effective judge of corporate performance than other metrics, particularly in comparison to EBITDA. The assertions are based on studies that purport to show that EVA is less correlated to shareholder returns than EBITDA. These critics also express concern over the complexity of EVA as an impediment to its adoption. Some cite academic research that suggests that EVA does not help investors to value stocks or enhance portfolio returns.
We beg to differ on all counts. Indeed, the studies we have examined are so deeply flawed that any conclusions drawn from them cannot be taken seriously.
An Impostor Unmasked
The biggest deficiency is that the measure of EVA used in the published studies is not the measure ISS computes and uses in its assessments of company performance and pay plans. The critics are guesstimating their own version of EVA based on accounting data inputs. But without access to the proprietary adjustments that ISS makes, estimates of EVA can be off by a factor of 50 percent or more. In short, EVA is being mis-framed by impostors.
ISS computes EVA as profit net of a capital charge, or specifically, as NOPAT (or Net Operating Profit After Taxes), less a capital charge determined by applying a weighted-average cost of capital (or WACC) times the amount of Capital in the business. The formula itself is straightforward, but the estimates for NOPAT, Capital, and WACC are crucial, and errors in those can make a world of difference. Let’s review a few of the typical ways the critics have gone off track.
The Cost of Capital is Wrong
A key cost-of-capital ingredient is the so-called “market risk premium” (or MRP), which is the extra annual return investors require for buying the stock market instead of the bond market.
ISS uses a 4 percent MRP, based on solid evidence and logic. It is common, however, for others to use an MRP of between 5.5 and 6 percent, which we see as unrealistic as a long-term premium, and in any event, it is not the premium ISS uses. This difference alone tends to overstate cost of capital estimates by 1.5 to 2 percent.
Another common mistake is using market values to weight the cost-of-capital components. The correct technique, which is the one ISS uses, is to weight the capital costs by the adjusted book values of the capital components [1] . Because most companies today trade for significant premiums to book value, using market value weights puts an unwarranted emphasis on the cost of equity capital and too little on the cheaper debt that companies are using. This is a second reason the cost of capital estimates are generally way too high.
Another cost-of-capital ingredient is beta, a measure of the volatility and risk in a company’s common stock returns. A typical approach uses a company’s individual beta, as measured from its stock price. ISS, by contrast, determines each company’s cost of capital using a sector-average risk reading. In practice, betas for individual companies are measured with such large errors using the typical approach that ISS deems it more reliable to use the median beta across a sector of business peers for each company in the sector.
In sum, the conventional methods used to estimate the cost of capital tend to overstate it, and by quite a lot, which materially understates EVA and unduly penalizes the EVA of companies that are investing capital to grow their businesses. There are in addition many company-specific errors in cost of capital estimates that introduce noise and further reduce the measured correlation between EVA and TSR.
Profits and Capital are Mis-Measured
The ISS calculation of EVA is based on applying a tested set of rules that systematically adjust NOPAT and Capital and tend to fix or at least sharply mitigate distortions introduced by following GAAP accounting rules. It is beyond the scope of this memo to discuss all of them, but a few will suffice to indicate just how far off the mark an estimate of EVA can be without incorporating the ISS adjustments.
For example, rather than expensing a company’s R&D and advertising spending as is required by re ported accounting, ISS treats the spending like an investment in plant and equipment. ISS adds the spending to Capital and amortizes it as a charge to NOPAT over a pre-set period (generally, five years for R&D and three for advertising). In this way, companies that are stepping up investments in innovation and brands are not penalized up front – they have the time needed to demonstrate a return on the investments – and those that unwisely cut back this type of spending to hit a near-term earnings goal are not rewarded with an increase in profit.
Take Amazon as an example. Over the five years from 2014 to 2018, Amazon tripled its R&D and ad spending from a combined budget of $12B to $36B. The accumulated sum of those investments clearly positioned the company to boost sales and profits for years to come—and that seems to have been recognized by investors in Amazon’s stock price. That is why the ISS EVA calculation deducts only the five-year average of that spending, which amounted to $22B in 2018, converting it into a strategic expense that is far lower than the reported expense of $36B that year. For this reason alone, Amazon’s EVA as ISS measures it is $14B higher than raw accounting numbers suggest [2]. Estimates of EVA that don’t make this adjustment are, as a rule, significantly understated for high-tech growth companies.
Taxes are another minefield. ISS’ EVA implementation recognizes that effective tax rates in any one period can be subject to one-time adjustments, settlements, and credits. Our research shows it is generally more accurate to apply a single, smooth, normalized tax rate on operating profit rather than the apparent effective rates measured year by year. ISS currently applies a uniform 25 percent rate to all U.S. companies (21 percent for federal plus 4 percent for state and local), which eliminates another source of noise in the calculation. Others do not bother or are unable to apply a tax smoothing technique such as the one ISS uses. [3]
Another typical pitfall is a failure to recognize the value of tax deferrals, but deferring taxes is, in fact, valuable. It enhances cash flow, and leaves interest-free capital in the business that, at least for a time, reduces the need to raise debt or equity capital.
Amazon is instructive here, too. By pouring significant amounts of capital into server farms and data centers for its cloud computing business, Amazon writes off massive amounts of money each year for tax purposes that must be depreciated over time for book purposes. The company thus defers a colossal amount of tax each year compared to its book tax provision, which means its cash flow strength is much greater than its book income or EBITDA suggests it is. Its EVA is also much stronger, because ISS credits EVA with the cost of capital saved on the accumulated balances of deferred taxes – yet another reason Amazon’s true EVA is much different from, and in this case much greater than, what it is commonly measured to be.
These are just two examples of the range of adjustments ISS makes. Others also can be critically important but will not, for brevity purposes, be discussed here.
In sum, recent critics of EVA are guilty of false advertising. The data set they used to represent EVA in the correlation analysis was not in fact the EVA that ISS uses or advocates. As a result, no reliable conclusions can be drawn from their research.
EVA Correlates With, and Drives, Wealth Creation, Not TSR
As a technical matter, it is also incorrect to correlate EVA directly with TSR, as many consultants have done. By design, EVA explains something more important than shareholder returns, which is the creation of shareholder wealth.
As it turns out, the present value of a business case or business plan forecast for EVA is mathematically identical to the net present value of the free cash flows to be generated by the plan or investment. This is always true because EVA sets aside the profit that must be earned to recover the value of the capital that has been or will be invested in the business. EVA always discounts to the value added to, or subtracted from, the invested capital base.
To be specific, EVA is expected to discount to, and thus to correlate with, a sister measure called MVA (or Market Value Added). MVA is the dollar difference between the overall Enterprise Value that investors see coming out of a business, from its discounted cash flows, and the Capital that they have put into it. MVA, in short, measures the aggregate wealth of the owners. It’s the value they get back compared to the money they have put in. Increasing MVA is thus the key to creating shareholder wealth.
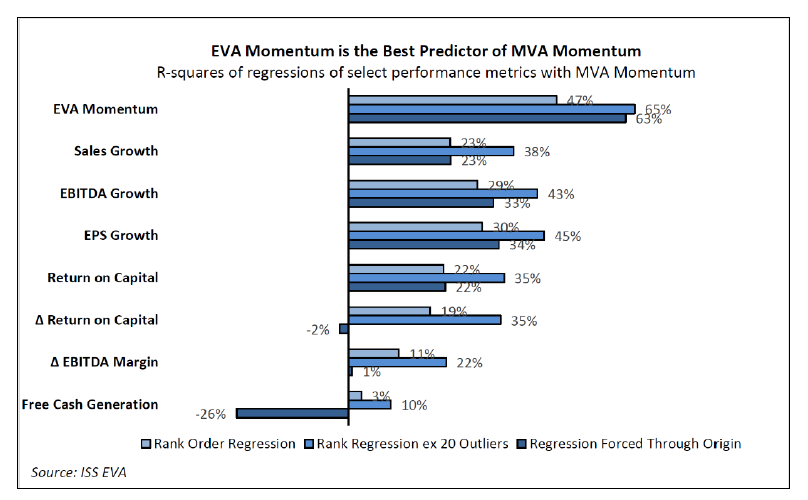
The mathematical connection between EVA and wealth creation has been the subject of two recent validation studies by ISS. The first, appearing in What Determines TSR [4], shows that the change in EVA over five years is by far the best metric to explain the creation of shareholder wealth and is generally 20 percent greater than it is for EPS or EBITDA growth.
A second more recent test was featured in an ISS memorandum entitled, EVA, not EBITDA [5]. In it, we examined whether a capitalization of EVA or EBITDA was better at explaining market values across Russell 3000 stocks by running these two regressions. [6] [7]
Enterprise Value = a + EBITDA x Multiple
Enterprise Value = a + Capital + EVA x Multiple
(where “a, a constant, and Multiple, a “beta” coefficient, are solved for in the regression)
It is important to note that EVA is not expected to explain Enterprise Value by itself. EVA accounts for the value added to, or deducted from, the firm’s Capital, which must be added back to determine the overall Enterprise Value.
The EBITDA regression explained 9 percent of variations in Enterprise Value across all the stock universe and EVA explained 22 percent. Neither result is impressive, but still, as expected, EVA is much better.
To refine this analysis, we examined the values of companies within distinct sectors, one sector at a time, rather than forcing all companies into one regression model. EVA’s explanatory power soared. The median r-squared in explaining Enterprise Value within the 43 industry groups we examined was 57 percent for EVA, versus 38 percent for EBITDA. The difference, again, is about 20 percent in favor of EVA.
Taken as a whole, these tests are evidence that the market follows economic logic and prices stocks based on discounted cash flows, net of investment spending, or what is the same thing, based on generating economic profit above the cost of capital, and not on the basis of the gross cash flows from operations such as EBITDA represents.
Misspecification of the Equation
Given the above, why is it difficult to establish a strong statistical link between EVA and TSR? The simple answer is, it’s a mathematical mismatch. EVA explains MVA and increasing EVA propels increases in MVA. EVA is, as Fortune magazine aptly put it years ago, “The Real Key to Creating Wealth.” It’s a dollar to dollar connection. But TSR is a measure of the rate of wealth creation relative to an initial valuation base. It’s a ratio.
TSR also is dependent on forecast expectations coming into and out of a measurement period, which EVA over the period cannot measure. And because market cap is in the denominator, TSR can look great for a poor performing company that manages to achieve a modest rebound from a depressed valuation.
TSR is distorted by debt/equity leverage, too. It’s the return for the shareholders, net of debt. Take two companies that perform the same, that produce the identical EVA and EVA growth, and yet, the more leveraged one of them will show a higher TSR in good times and a lower TSR in bad times. EVA will account for none of this, because it explains the unleveraged performance of the business as a whole and not just the equity piece in it.
TSR is also function of the change in value divided by an initial value. An EBITDA growth rate, which is the change in EBITDA divided by an initial EBITDA value, is in that form. To the extent that EBITDA is a rough proxy for market value, the growth rate in EBITDA can be considered a proxy for a rate of return on value. But it is not possible to use the same ratio for EVA. The change in EVA divided by an initial EVA is not a meaningful metric because EVA is often zero, or close to it, or negative.
As a result, ISS has developed a proxy for EVA growth, called EVA Momentum, which is the change in EVA divided by lagging sales (or lagging Capital). Some consultants have tested the ability of this variable to explain TSR. But there is no reason to expect a high correlation with it. The denominator of EVA Momentum, being sales, is not an indicator of value, but of size. Put simply, an EBITDA growth rate metric is endowed with a statistical advantage over an EVA growth rate in a straight-up correlation test with TSR – but that should not be mistaken for a signal that EBITDA is economically more meaningful. Tests like those oversimplify the equation and inadvertently tip the scales against EVA.
It is possible to derive an exact formula to connect EVA and TSR that accounts for these nuances. It appears in the aforementioned article, The Link Between EVA and TSR, where it was tested and shown to work better than all other conventional financial metrics. It’s not for the faint of heart. The formula that transforms EVA from a money measure of wealth creation into a ratio measure of shareholder returns is admittedly complex, and it is incapable of being reduced to a simple regression of EVA and TSR as the consultants have attempted to do. When you force EVA into a regression like that, it’s like making a major league baseball first baseman try out in an NFL combine, and concluding he’s not an athlete. It’s apples-to-airplanes and, put another way, you cannot model quantum particles using Newtonian formulas.
EVA critics are also putting too much emphasis on correlations with TSR as a deciding factor. In fact, ISS chose to use EVA because the metrics are expected to complement TSR and not primarily because of a correlation with it. Rather, the EVA metrics are intended to compensate for some of the blind spots and distortions in TSR as a measure of performance. They were selected to reveal the productivity of a firm’s business model and to quantify which firms are doing the best job of strategically powering growth in profits above a market-mandated minimum return on capital. They were chosen because they bring capital stewardship forcefully into the management equation, and because they systematically mitigate accounting distortions that impede fair comparisons among business peers.
Despite the difficulty in establishing a correlation, the key concept remains. Over time, companies that manage to increase EVA will create wealth, and the creation of wealth will translate into investor returns and TSR.
EBITDA Can’t Be Right
A finding that EBITDA is superior to EVA also cannot be taken seriously because it doesn’t make sense. EBITDA, because it is measured before interest, depreciation, and amortization, is completely unaffected by how much money a company has invested in its business and any related financing costs. Can it really be true, as many EVA critics have concluded, that investors are oblivious to the amount of capital a company invests?
A simple example shows why this conclusion can’t be swallowed. Say two companies both produce $100 in EBITDA profits, but one of them has invested $2,000 in capital in business assets and another just $500. EBITDA says the firms are identical, but in fact the second one is much better than the first. The second one produces a much higher return on invested capital, churns out more free cash flow to distribute to investors net of investment spending, and yes, it generates more EVA profit net of a cost-of-capital charge. Whereas EBITDA rates the two firms the same, the ISS EVA Financial Performance Assessment method assigns a far higher performance rating to that second firm, and justifiably so.
A common-sense litmus test asks these questions:
- Should managers not worry about allocating or managing capital?
- Should managers be unconcerned about minimizing or deferring taxes, or responding to tax incentives?
- Should managers treat R&D to innovate and advertising and promotion to build brands as expenses, as is consistent with EBITDA, rather than as strategic investments to build long term value, as EVA does?
- Should managers not have to worry about any unusual charges or capital losses on sales of assets? Are those just to be swept under the rug?
- Should managers discontinue the use of discounted cash flow analysis to make investment decisions, since investors do not care about capital?
- Should managers essentially dismiss all the key decision principles of corporate finance taught in business schools the world over?
For those who endorse EBITDA over EVA, the answer is a resounding yes! to all those questions. EBITDA advocates are effectively saying, “forget about NPV, forget about IRR, and forget about cash flow.” They are asserting that none of those matter as much to investors as increasing EBITDA. But that just cannot be right. And it is not right. It makes no sense at all.
Smart investors understand this, of course, including the legend of Omaha, Mr. Warren Buffett, CEO of Berkshire Hathaway: “It amazes me how widespread the use of EBITDA has become. Does management think the tooth fairy pays for capital expenditures? We won’t buy into companies where someone’s talking about EBITDA.”
EVA is Not Complex
As was said, consultants like to point to the presumed complexity of EVA as a shortcoming and impediment to adoption. But EVA is not complex to those who know how to explain it and to those companies that are using it. If one starts with net income, and then adds back R&D expense and deducts an R&D amortization
charge in its place, it does look complicated. But, if instead, to compute EVA one starts with sales, and then subtracts operating costs, where one of those costs is the 5 -year average of R&D spending, then that’s pretty straightforward, and the incentive is clear – keep investing in innovation as long as the strategic cost
can be covered out of future profits. It’s a matter of how it is presented and how it is explained. There is a short story behind each adjustment in EVA that, when illustrated with a simple example, resonates with managers, increases financial literacy, and leads to better decisions.
EVA Can Help Investors Pick Winning Stocks
Consultants also cite academic research that purports to show EVA is of no value in picking stocks. One example is research by a University of Central Florida professor dating from 2012 which concluded: “using EVA as an investment strategy does not offer higher returns for an investor compared to other financial metrics.”
It is safe to say this study is flawed for the same reasons we’ve discussed, namely, the measure of EVA the academics used is not the ISS EVA measure and the formulation of how EVA metrics should drive investors returns is mis-specified.
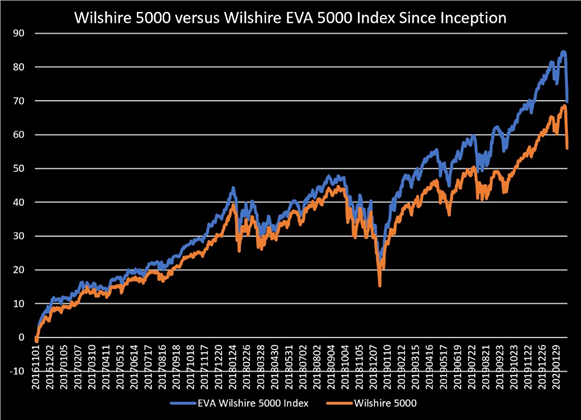
One indication of the investment value of EVA is the performance of the Wilshire EVA 5000, a stock index that weights stocks in proportion to the EVA profits the firms are earning (with no weight if EVA is zero or negative). The index is a simple bet that the best stocks to own are ones where management has demonstrated the ability to earn EVA, and the ones to shun are those where management appears to be misallocating or mismanaging capital and driving down EVA.
The index went live as of November 2016, with values computed by Wilshire with EVA data furnished by ISS. Since then, the EVA Index steadily outperformed its benchmark by an average of 3 percent per annum. This is not a simulated back test. This is actual out-performance, or alpha, based on EVA.
Endnotes
1 In principle, the cost of capital is the minimum return required for a breakeven or marginal investment, one with a zero NPV, or net present value, that creates the same value as the capital put into it. In other words, market-value weighting should be used, but on the condition that market value equals book value. Companies trade for large premiums to book value because investors have discounted the future growth in EVA they are projecting into the current stock price. Investors get a return on that premium value with the passage of time, simply by a reversing of the discounting of the expected growth as it occurs. It is inappropriate to burden capital investments and profits in place with the obligation to earn a return on future growth. Again, book value weights, not market value, are appropriate.(go back)
2Technically, this overstates the impact. The spending is deducted after taxes; also, a capital charge on the deferred balance is deducted.(go back)
3Prior to enactment of The Tax Cut and Jobs Creation Act in December 2017, ISS assigned companies to one of six standard tax r ate categories ranging from 40 percent to 20 percent, depending on their sector, size, profitability and percent of foreign source income. The new tax act simplified the code and made it possible to create one effective tax rate for all U.S. companies.(go back)
https://papers.ssrn.com/sol3/papers.cfm?abstract_id=2422150(go back)
6The test was conducted with data as of March 12, 2019 (excluding financials, real estate, utilities, smaller biotech firms, and companies with less than $100 million in sales, leaving 1,773 observations).(go back)
7https://www.issgovernance.com/solutions/iss-analytics/iss-eva-resource-center/: EVA, not EBITDA: A New Financial Paradigm for Private Equity Firms(go back)
