 Print
PrintAndrew R. Lash and Joey Choi are consultants and Matt Lum is a principal at FW Cook. This post is based on their FW Cook report. Related research from the Program on Corporate Governance includes Paying for Long-Term Performance by Lucian Bebchuk and Jesse Fried (discussed on the Forum here).
Overview and Background
Since 1973, FW Cook has published annual reports on long-term incentive grant practices for executives. This report, our 48th edition, presents information on long-term incentives granted to executives at the 250 largest U.S. companies in the S&P 500 Index. It is intended to inform boards of directors and compensation professionals in designing and implementing effective long-term incentive programs that promote long-term success for their companies in supporting strategic objectives and aligning pay delivery with performance.
Definition of Long-Term Incentive
To be considered a long-term incentive for purposes of this report, a grant must reward performance and/or continued service for a period of one year or more and cannot be limited by both scope and frequency:
- A grant with limited scope is awarded to only one executive or a very small or select group of
- A grant with limited frequency is an award that is not part of a company’s regular grant For example, a grant made as a hiring incentive, replacement of compensation forfeited from prior employer or promotional award is not considered a long-term incentive for this report.
- A grant with limited scope but without limited frequency (annual grants of performance shares made only to the CEO) may be considered a long-term incentive, and vice versa (one-time grants made to all executives).
Which Long-Term Incentive Vehicles Remain in Favor?
Market practices have largely converged to reflect a balanced portfolio approach of multiple LTI vehicles, with a continued emphasis on performance-based equity…
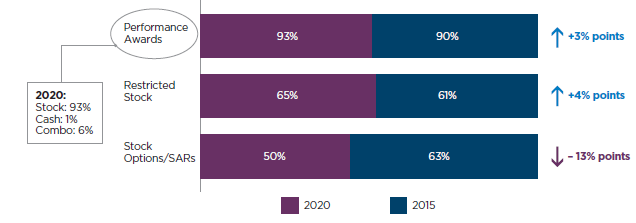
Over the last five years, there has been little change in the prevalence of performance-based and time-vested full-value awards, while stock option/SAR usage has declined:
- Performance awards continue to be used almost universally (93% in 2020, up 3% pts. since 2015)
- Restricted stock awards continue to be used by roughly two-thirds of participants (up 4% pts. since 2015)
- Stock option/SAR usage has declined by 13% pts. since 2015
The continued focus of investors and proxy advisory firms on pay-for-performance has resulted in a further shift away from time-based awards in favor of performance-based LTI. Performance-based LTI now comprises 59% of the average CEO’s LTI mix (up from 52% in 2015). The shift towards performance-based LTI generally comes at the expense of stock options/ SARs, which have declined from 27% of the mix in 2015 to 18% of the mix in 2020.
- The decline in prevalence and weighting of stock options/SARs is due in part to proxy advisory firm policies that view stock options as time-based awards rather than performance-based awards, and various other considerations including but not limited to: LTI objectives, business outlook, fair value trade-off, and dilution.
Stock option/SAR usage has declined 13% pts. since 2015
How Program Designs Have Changed
What are the Predominate Performance-Based LTI Metrics?
Performance-based LTI design remains relatively stable with most companies:
- Using one or two performance-metrics,
- Measuring performance over a three-year performance period, and
- Providing for a maximum payout opportunity of 200% of
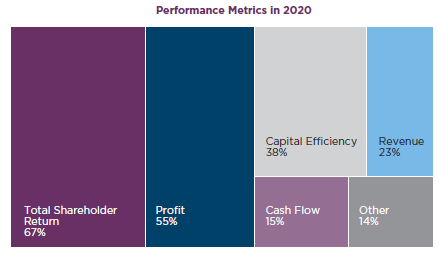
Over the last five years, the prevalence of financial metrics has remained relatively flat while the use of Total Shareholder Return (TSR) has increased meaningfully. TSR is the most prevalent performance award metric, used by 67% of companies granting performance awards (up 13% pts. since 2015). Profit measures remain the second most common at 55%, followed by Capital Efficiency measures at 38% (e.g., Return on Equity, Return on Invested Capital, etc.).
For companies that employ multiple metrics, we found that 72% pair at least one absolute financial or strategic metric with relative TSR. TSR’s prevalence is of little surprise given its simplicity, explicit shareholder value alignment, and general acceptance by proxy advisors and investors. However, there exists some disagreement over TSR’s effectiveness in driving and incentivizing performance (its Achilles’ Heel being line-of-sight, and opposition to the idea that executives can control for it). Perhaps in light of this criticism, of the programs employing relative TSR, 28% use it as a modifier instead of directly carving out room within performance award metric portfolios. Nevertheless, TSR’s credibility as a performance metric is further substantiated by the fact that major proxy advisors currently use it as a basis for measuring corporate performance (though this basis continues to evolve).
28% of relative TSR programs are modifiers
How Is Performance Measured?
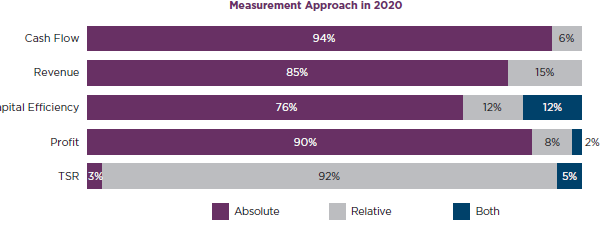
Most TSR-based performance awards are measured on a relative basis, with financial metrics most often measured on an absolute basis…
The differential is largely attributable to ease of access – market-based metrics, such as TSR, rely on readily available price information. Financial and operational measures, on the other hand, present a variety of challenges for relative measurement, as company disclosure surrounding non-GAAP definitions vary.
92% of performance plans leveraging TSR are measured on a relative basis (up from 87% in 2015), while other non-TSR based metrics are measured on a relative basis 5%-15% of the time (generally flat since 2015).
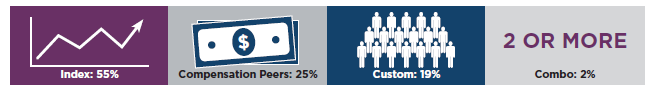
For companies maintaining relative performance programs, the performance comparator group and level of performance rigor are just as important as the type of metric employed. Most companies (55%) using relative TSR measure their performance against an index (e.g., broad indices like the S&P 500 or industry focused indices such as the Philadelphia Semiconductor Index), with the second largest portion (25%) using their executive compensation benchmarking peers.
Some key considerations for determining an appropriate comparator group are:
- Small peer groups can lead to large swings in relative performance and earnout due to factors outside of executive control (e.g. peer M&A activity).
- Too large or broad of an index may dampen the perceived value of an award if the holder does not feel adequately in control of the An industry-centric comparator group provides arguably better participant-optics, as the competition is limited to more direct company competitors.
- Though proxy advisors and investors are generally agnostic on performance peer group development, companies should be wary of potential criticism for “cherry-picking” peers that potentially lead to inflated earnouts – especially when there is little overlap with the company’s compensation peers.
55% of companies using relative TSR measure performance against an index
For companies measuring relative TSR performance, the most prevalent performance level combination continues to be:
- Threshold: 25th Percentile,
- Target: 50th Percentile, and
- Maximum: 75th
However, we see the performance requirements under these programs slowly tick-up. More companies are requiring higher levels of performance to receive a threshold payout and the majority of companies require relative performance above the 75th percentile to receive a maximum payout. A quarter of companies also require relative performance to be above the median of the peer group to receive a target payout. The increase in rigor under these programs is being driven by a desire to decrease the Monte Carlo Value / accounting expense of the award and increase the perceived shareholder friendliness of the plan.
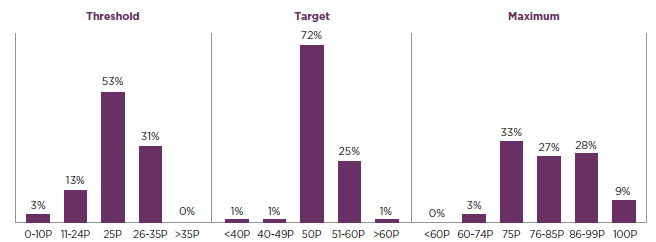
There is an upward trend in setting target performance above the 50th percentile
What Lessons Can We Learn from the Top 250?
Within this section, we seek to better understand strategies companies may undertake to address existing (and potentially prolonged) market volatility and pandemic-induced uncertainty.
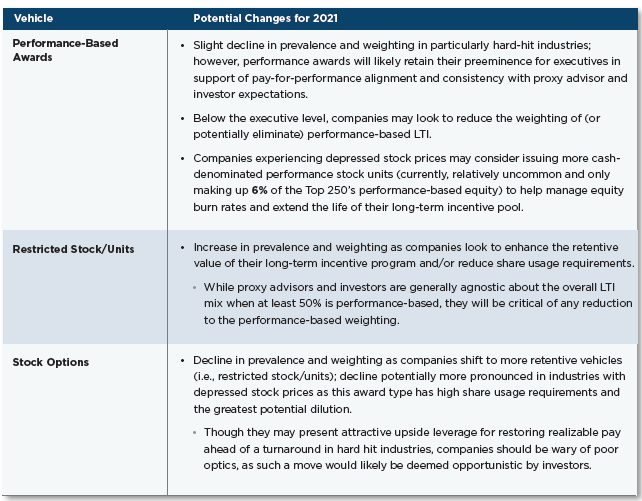
Long-Term Incentive Vehicles
COVID-19 has left many businesses unable to realistically set financial/operational goals; board compensation committees will have decisions to make in the near-term when assessing performance and funding for in-flight awards paying out in 2020, as well as for 2021 awards…
In this section, we highlight areas of long-term incentive plan design that companies could consider changing in order to address the market volatility and uncertainty caused by COVID-19, including:
- Long-Term Incentive Vehicles
- Types of Metrics
- Performance Periods
- Goal Width
Types of Metrics
For 2021, we expect the prevalence of relative performance metrics to increase (both relative TSR and relative financial performance) in order to address the difficulty of goal-setting in a volatile market.
Relative measures have historically played an important role in the performance-based LTI programs of cyclical and otherwise weathered industries, as they allow comparison against similarly situated companies and facilitate actionable means for assessing and determining performance.
Consider use within the Energy sector, which has suffered from high-levels of volatility and share price declines even before the recent COVID-19 shock – as evidenced by a 1.90 5-year average beta and a -33% 5-year share price CAGR, respectively. As a result of this challenging business environment, it’s little surprise that 92% of the Top 250’s Energy companies rely on relative TSR and essentially avoid profit measures altogether. This fact pattern of volatility and share price pain is easily translatable into today’s COVID-19 environment.

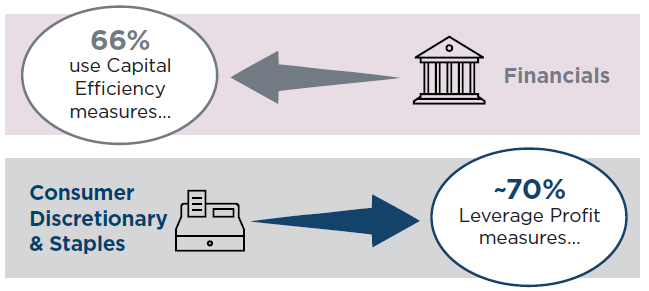
However, one size still does not fit all, as companies within the Financial sector are notably relative TSR-lite (used by 34% of companies) and rely more heavily on Capital Efficiency measures (66%). On the other hand, roughly 70% of both the Consumer Discretionary and Consumer Staples sectors emphasize Profit measures within their performance-based LTI programs. Companies in these industries may look to measure financial performance on a relative basis or add relative TSR as a metric to address the difficulty in goal-setting during volatile and uncertain periods.
Annual Measurement Against Long-Term Goals
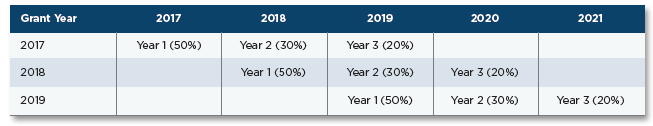
Another way to address uncertainty in multi-year goal setting is illustrated by 3M and includes the following, as described in their disclosure:
- Setting goals up-front for three-year to support “strategic” plan and differentiate from annual incentive goals
- Measure annually against the three-year goals and “bank” the results
- Sum the three years of annual results so one high year does not carry other low years or vice versa, and pay at the end
Case Study: 3M’s Performance Share Award Program
Funding of 3M’s three-year performance shares is determined based on achievement against four distinct metrics as shown below, measured over three discrete, one-year periods against three-year goals set at the start of the performance period: 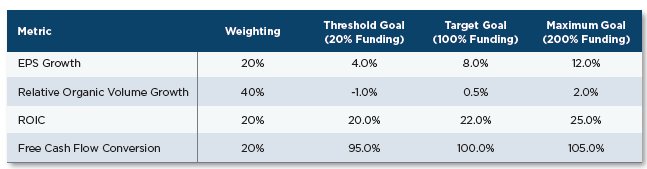
The years have declining weightings to reflect lower predictive-value of goals with time, and recognizing that performance periods overlap with annual grants:
Goal Width
The width of performance ranges are informed by the rigor of goal-setting, which can be challenging even during normal course of business. The absence of rigor within performance goals can be perceived as an “entitlement” to executives, which proxy advisors and investors are both likely to take issue with.
For companies experiencing increased difficulty setting financial goals (as a result of COVID-19 or otherwise), one strategy would be to set wider performance ranges, and another would be to establish a target range (instead of a singular goal). The former allows for greater variability in outcome that still leads to a payout, while a target range provides a modest downside and upside buffer, such that any outcome within the range is deemed at-target achievement. It is important that the ranges in both cases are set symmetrically, such that threshold performance levels become easier while maximum performance levels become proportionally more difficult.
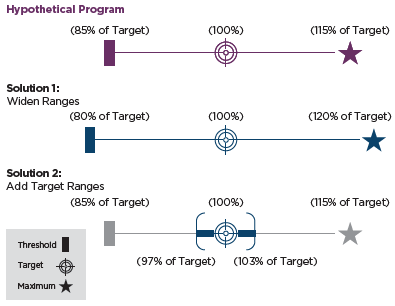
Though proxy advisors and investors generally would prefer to see more narrow target ranges, investor outreach and sufficient proxy narrative disclosure providing a clear rationale for the wide goal posts could alleviate the risks of scrutiny and a negative result for Say-On-Pay.
The following table summarizes the median goal width (i.e., threshold performance to maximum performance) for various top- line and bottom-line metrics, measured on absolute and relative bases.
The performance range of absolute measures is determined by calculating the threshold and maximum performance levels as percentages of target – i.e., the further the spread around target, the wider the range.
Similarly, the performance range of relative measures is determined by calculating the threshold and maximum ranking as a percentage of the target rank.
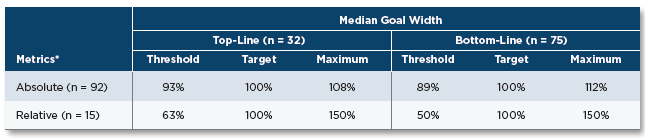
*On a relative and absolute basis, we analyzed top-line measures (e.g., revenues, total sales, etc) and bottom-line profit measures (e.g., EPS, EBITDA, operating/net income, etc). Note that margin, return (i.e. capital efficiency), TSR, and cash flow related goals were excluded from the analysis. Any metric that did not clearly fit within one of the above buckets was excluded from the study.
We see that goal width is often narrower for top-line measures, given that companies generally have better line of sight into expected revenues/sales (for example), and wider bottom-line goal-posts when measured on an absolute basis.
When measured on a relative basis, all goal posts are wider as there is greater variability in outcome (or relative performance) than there is on an absolute basis.
Ownership Guidelines in a Down Market
Stock Ownership Guidelines (SOGs), which help to ensure alignment of executive interests with those of shareholders, have long been commonplace at the Top 250, with 98% employing some form of ownership policy at the CEO and other named executive officer (NEO) level. Though policies vary, they can be grouped into “traditional” approaches and “retention” approaches (often used in combination with one another).
- Traditional approaches are based on multiples of salary, fixed shares, or fixed value
- Retention approaches are either ratio-based (i.e., must hold X% of after-tax shares) or holding periods (i.e., must hold after-tax shares for X years).
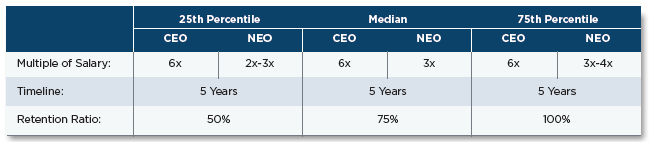
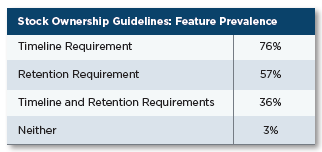
Of the Top 250 companies employing SOGs, 93% require ownership as a multiple of salary, often in combination with timeline and/or retention features. As seen to the left, 76% of company’s SOGs require compliance within a given timeframe while 57% require executives to hold a ratio of after-tax shares until compliance is achieved. The below summarizes the Top 250’s CEO and NEO stock ownership guidelines.
Timeline requirements have become problematic in certain cases, where depressed share prices are lengthening the time horizon it takes to achieve previously established ownership requirements.
Below are two potential strategies for non-compliance prevention as a result of depressed share prices:
1. Remove the timeline requirement altogether and retain (or add) a retention requirement.
- For example: require executives to retain 50% of their net-after-tax shares until compliance is Compliance becomes a moving target, whereby one does not “run out of time”.
- Companies should consider the impact that a high retention ratio has on executive liquidity.
2. Adopt a “once-met-always-met” provision.
- Once an executive achieves compliance, the minimum number of shares that must be held to retain compliance becomes set (i.e., changes in share value are inconsequential, so long as the executive does not liquidate more shares than their required minimum).
Once-Met-Always-Met Example: Danaher Corporation
Danaher’s 2020 Proxy states that “Once an executive officer has acquired a number of Company shares that satisfies the ownership multiple then applicable to him or her, such number of shares becomes his or her minimum ownership requirement (even if the officer’s salary increases or the fair market value of such shares subsequently changes) until he or she is promoted to a higher level.”
* * *
The complete report is available here.
