 Print
PrintSarah Keohane Williamson is CEO of FCLTGlobal.
Capital markets have many functions in today’s financial system. They promote the vitality of global and regional economies, and they provide new businesses a pathway to success through access to capital. But the core purpose of capital markets is to facilitate transactions—to transform the money from savers into uses that support societal and economic growth, and that, in turn, earn a fair return for the savers themselves.
But the way that capital flows from savers, through various investment vehicles, to the companies that use it can be an opaque process. The structure of this process and the extent to which capital is focused on long-term goals shifts constantly as funds pass from one entity to the next across the investment value chain.
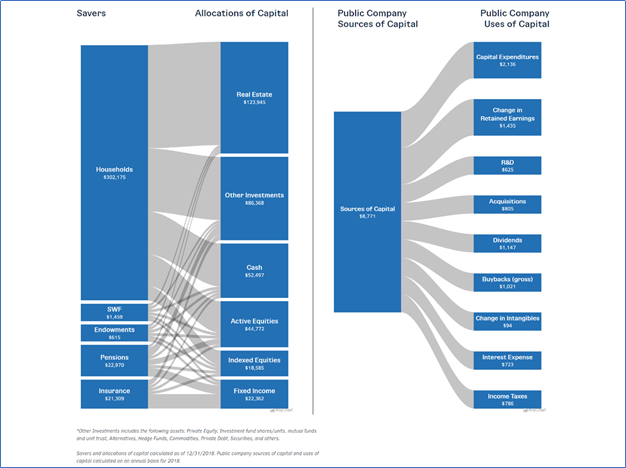
FCLTCompass is our way to spotlight this function. FCLTCompass is an annual reporting of money as it flows through the global investment value chain. Taking 10+ years of financial data, it traces investors’ savings through various asset vehicles, finally arriving at the companies that deploy it in support of economic growth.
Through this new initiative, we have mapped capital flows in the largest countries by gross domestic product over the past decade—and have arrived at a critical conclusion.
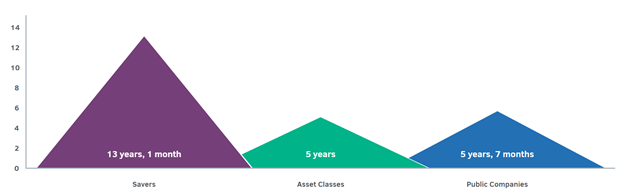
The data shows us, unsurprisingly, that there is a significant intention-allocation gap of upward of eight years between the expected investment horizon of the saver and the actual time frame that capital remains committed to a particular investment opportunity. On the other end of the capital markets, the companies that savers’ funds are invested in have the inverse problem: companies have short-term funding sources that are misaligned with the companies’ own longer-term investment horizons. These long-term aspirations, therefore, are lost in translation due to a barbell effect whereby the goals of both savers and companies are weighed down by the path capital takes between them.
These discrepancies in time horizons highlight key issues for companies as they position themselves to be competitive and prosperous for all of their stakeholders. The adoption of business models with fewer fixed assets (so-called fixed asset–light models) has contributed to a 14 percent decline in corporate investment time horizons by driving a shift in the concentration and average useful life of assets in a company’s portfolio. Debt outstanding has increased as a proportion of corporate financing in a period of extreme low interest rates—alongside the rise in return of capital to shareholders, excess leverage can pose risks to corporate resilience. And the decline in corporate investment time horizons parallels a decline in CEO tenures, which could be either a symptom or a cause of the broader decline in corporate investment time horizons.
Likewise, our findings show significant emerging trends in the global investment community. A widespread shift to indexed equity is contributing to an overall increase in average equity holding periods while time frames for fixed income have shortened and the low rate environment has inspired yield-chasing behavior. In 2018, investment horizons for indexed equity products were 11 years, 5 months, compared with 2 years, 6 months for active products, accounting for a lengthening in the average equity investment horizon as indexed products gathered assets.
Most notably, the accumulation of wealth in China is beginning to show increasing influence on global household investment horizons. This growth has been largely driven by the ascendance of the middle class—Chinese savers’ wealth more than tripled from 2009 to 2018. But savers in China (including SARs) have among the shortest-term allocations in the world, pushing the global average saver investment horizon lower.
Finally, one piece of the capital allocation puzzle is missing from our mapping of uses of cash. Capital invested in employees—in the form of wages, health and wellness, retirement savings, and further training—is not easily discerned from typical financial disclosures. In the midst of a global pandemic, at a time when economic inequality and employee well-being is front and center, this absence is palpable.
These findings present further questions that challenge the nature and function of today’s capital markets: How can savers mitigate their own short-term tendencies and incentivize behavior on the part of the asset management community that is aligned with their own long-term interests? And how can the asset management industry serve clients better by aligning the products they provide with savers’ intended time horizons?
The first annual edition of FCLTCompass offers an opportunity to think critically about these questions and the future of our global markets. By relying on data reported prior to the current crisis, this evaluation serves as a stable baseline. As the years go by, we will see the impacts of the pandemic and other dislocations on global asset flows and investment horizons.
Over time, FCLTCompass will evolve and expand by widening its global scope, digging deeper into emerging trends, and benefiting from feedback from the global business and investment community, especially as new data comes to light in the years ahead. It is our goal for this project to contribute to our ongoing practical research to help companies, investors, and savers alike practice long-term decision-making as the norm, not the exception.