 Print
PrintJulie Daum is a Consultant, Laurel McCarthy is a Senior Associate, and Ann Yerger is an Advisor of the North American Board Practice at Spencer Stuart. This post is based on the Spencer Stuart S&P MidCap 400 Board Report.
Spencer Stuart’s inaugural survey of S&P MidCap 400 companies finds significant differences between mid- and large-cap boards. Not only are mid-cap boards generally smaller in size, younger and less diverse than larger S&P 500 companies, the profiles of directors joining mid-cap boards differ. In some ways, mid-cap boards appear to be casting a wide net to identify boardroom talent, appointing more actively employed executives, first-time directors and division/functional heads compared to large-cap boards.
MidCap 400 board gender diversity lags S&P 500 boards
Similar to larger companies, mid-cap companies appear to be focusing on enhancing the diversity of their boardrooms. Of the 293 independent directors added to S&P MidCap 400 boards during the 2020 proxy season, 58% were women or minority (defined as Black/African American, Asian or Hispanic/Latinx) men—comparable to the incoming class of S&P 500 directors.
Of the diverse appointments, women dominate, representing 48% of the S&P MidCap 400’s incoming class. Only 18% of 2020 mid-cap director appointments are minorities, compared with 22% of S&P 500 appointments. Minority men represent 10% of the incoming class of independent S&P MidCap 400 directors and minority women, 8%. (According to the U.S. Census Bureau, an estimated 40% of the U.S. population are minorities, including 13.4% Black/African American, 5.9% Asian and 18.5% Hispanic/Latinx.)
S&P MidCap 400 boards appear to be one year behind large caps on the gender diversity front, with women constituting 26% of all mid-cap directors compared with 28% of large-cap directors (26% in 2019). Four mid-cap boards have no women directors, and most mid-cap boards (58%) have no more than two female directors. In contrast, two-thirds of S&P 500 boards have three or more female directors. In general, women are less likely to have board or committee leadership positions on mid-cap boards.
About a quarter of the surveyed mid-cap boards provide some details about the racial/ethnic diversity of their boards. A few—5%—provide director-specific details, and 19% provide aggregate data about the race/ethnic profile of the board.
Roughly 10% of the surveyed companies report commitments for including women and people of color in director searches. The commitments vary from formal policies to general good-faith efforts to include diverse candidates on lists of directors under consideration for board seats.
Turnover rates are consistently low across mid- and large-cap boards, but formal mechanisms differ
Boardroom turnover rates are consistently low across mid- and large-cap boards, with new independent directors representing 8-9% of all directors. As a result, moving the needle on boardroom diversity representation—among both S&P MidCap 400 and S&P 500 boards—is slow.
Turnover mechanisms are a differentiator. Only 57% of mid-cap boards have adopted a mandatory retirement age for directors, compared with 70% of large-cap boards. While mid-cap boards are less likely to report having a mandatory retirement age, those that do are more likely to set the age cap at 75 or older. Nearly 60% of the mid-cap age limits are 75 or older, compared with just under half of the large-caps with mandatory retirement. Director term limits are scarce, with only 6% of mid- and large-cap boards limiting independent directors’ years of service.
A potential inhibitor for mid-cap board turnover is classified board structures, in place at 30% of the surveyed mid-cap boards. In contrast, annual elections dominate in the S&P 500; only 10% of the large-cap companies elect directors for three-year terms.
More first-time directors, actively employed executives and division/function leaders are appointed to mid-cap boards
The backgrounds of the incoming S&P MidCap 400 directors differ significantly from S&P 500 directors. Forty-three percent (43%) of the new mid-cap directors are serving on their first public company board, compared with 28% of large-cap new directors. More than half (54%) of diverse directors (defined as women and minority men) joining mid-cap boards are first-time directors, compared with 32% of diverse directors joining S&P 500 boards.
Note: The Spencer Stuart S&P MidCap 400 Board Report is based on our analysis of the most recent proxy reports from the S&P MidCap 400 Index. This edition draws on the latest proxy statements from 400 companies filed between June 1, 2019, and June 1, 2020.
Data in tables and charts may not total 100% due to rounding.
More than half (57%) of new directors joining mid-cap boards are actively employed, compared with 49% of directors joining S&P 500 boards.
Compared to the incoming class of S&P 500 directors, relatively fewer executives in the most senior roles (CEO, chair, COO, president, functional leaders) and financial professionals (including executives with experiences as CFO, treasurer, investor, banker, accountant) were included in the MidCap’s incoming class. Comparatively more executives with divisional or functional experiences joined S&P MidCap 400 boards in the past year.
New Director Backgrounds
| 2020 S&P MidCap 400 | 2020 S&P 500 | |
|---|---|---|
| Top Executives | 28% | 35% |
| Retired CEOs | 14% | 16% |
| Active CEOs | 9% | 13% |
| Retired chairs/presidents/COOs | 1% | 3% |
| Active chairs/presidents/COOs | 4% | 3% |
| Line/Functional Executives | 32% | 23% |
| Line and functional leaders | 22% | 16% |
| Division/subsidiary presidents | 10% | 7% |
| Financial Executives | 23% | 27% |
| Financial executives/CFOs/treasurers | 6% | 14% |
| Investment managers/investors | 13% | 8% |
| Bankers/investment bankers | 1% | 4% |
| Public accounting executives | 3% | 1% |
| Legal Executives | 3% | 2% |
| Other | 12% | 13% |
| Consultants | 5% | 3% |
| Academics/nonprofit executives | 4% | 3% |
| Military/Others | 3% | 7% |
New mid-cap directors come from an evenly dispersed range of industries
More than 60% of the incoming class of S&P MidCap 400 directors come from five industries: consumer (15%); technology (13%); PE/investment management (13%); financial services (11%); and industrial/manufacturing (11%). In comparison, 48% of new S&P 500 directors come from three industry sectors: technology (24%); consumer (14%); and financial services (10%).
New Independent Director Top Industry Backgrounds
| 2020 S&P MidCap 400 | 2020 S&P 500 | |
|---|---|---|
| Technology | 13% | 24% |
| Consumer | 15% | 14% |
| Financial services | 11% | 10% |
| Private equity/investment management | 13% | 7% |
| Energy/utilities | 6% | 7% |
| Healthcare/pharmaceuticals | 7% | 6% |
| Industrial/manufacturing | 11% | 6% |
| Government/military | 1% | 5% |
| Transportation products & services | 0% | 5% |
Independent chairs are more prevalent at mid-cap boards
Board leadership differs, with independent chairs leading 44% of S&P MidCap 400 boards, compared with 34% of S&P 500 boards. Meanwhile, while nearly three-quarters of large-cap boards have an independent lead director, 52% of the surveyed mid-cap boards have an independent lead director.
Board meetings and committee structures are consistent across company size
S&P 500 and S&P MidCap 400 boards generally hold a comparable number of meetings. Similar to large cap boards, mid-cap boards average four committees, in the following order of prevalence:
- Audit Committee (100%)
- Compensation Committee (100%)
- Nominating/Governance Committee (96%, with nine companies combining compensation and nominating committee functions)
- Executive Committee (25%)
- Finance Committee (15%)
- Risk Committee (10%)
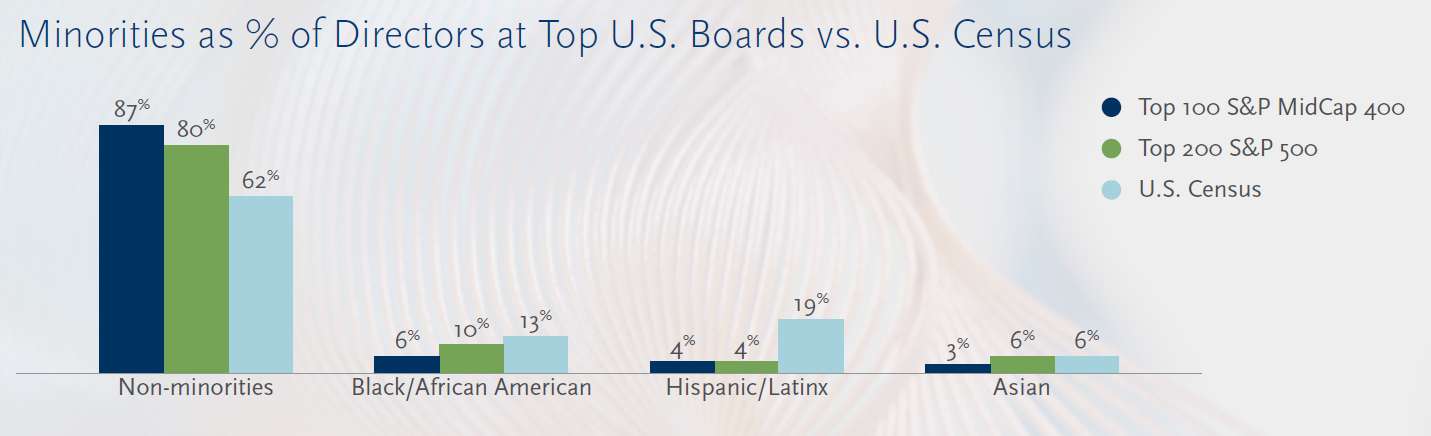
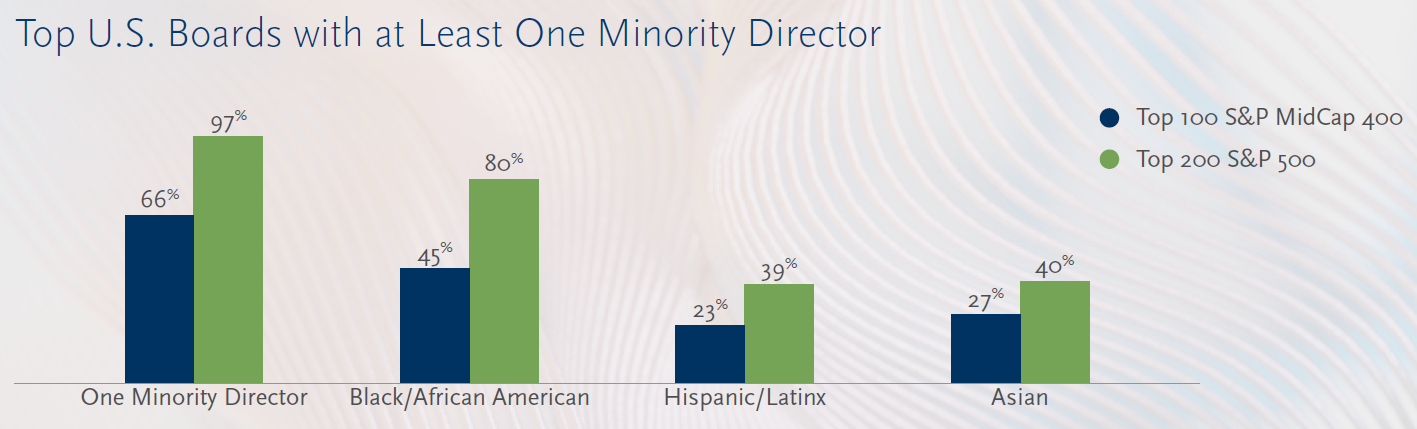
Minority representation on the top 100 S&P 400 MidCap boards significantly lags the largest S&P 500 boards
- 34% of the largest 100 S&P MidCap 400 companies (by annual revenue) have no minority directors, defined as Black/African American, Hispanic/Latinx and Asian directors, on their boards. In comparison, only 3% of the largest 200 S&P 500 companies lack minority directors.
- 13% of directors of the top 100 S&P MidCap 400 companies are minorities, consisting of 9% diverse men and 3% diverse women (note: numbers don’t sum due to rounding). In comparison, 22% of the directors serving on the largest S&P 500 boards are minorities.
- 9% of the top 100 S&P MidCap 400 companies are led by Black/African American, Hispanic/Latinx or Asian CEOs. Boards with minority CEOs have a higher average of minority directors (30%)—22% when the minority CEO is excluded.
- Only four surveyed mid-cap companies provided director-specific racial/ethnicity details. About one-quarter (23%) provided aggregated board diversity data, frequently including women directors in the statistic.
- As detailed below, the racial/ethnic composition of mid-cap boards falls far short of U.S. demographics, where, according to the U.S. Census Bureau and noted above, nearly 40% of the U.S. population are minorities, including 13.4% Black/African American, 5.9% Asian and 18.5% Hispanic/Latinx.
How S&P MidCap 400 and S&P 500 Boards Compare
| 2020 S&P MidCap 400 | 2020 S&P 500 | |
|---|---|---|
| Board composition | ||
| Average board size | 9.5 | 10.7 |
| Independent directors | 82% | 85% |
| Average age of independent directors | 61.7 | 63.0 |
| Average tenure of independent directors | 8.2 | 7.9 |
| Oldest board (average age of independent directors) | 74.2 | 83.8 |
| Longest tenured board (average tenure of independent directors) | 23.3 | 36.0 |
| Board turnover (% new independent directors to total directors) | 8% | 8% |
| New independent directors | ||
| Total number | 293 | 413 |
| Women | 48% | 47% |
| Minorities | 18% | 22% |
| Average age | 57.6 | 57.8 |
| Oldest new director | 74.0 | 73.0 |
| Youngest new director | 34.0 | 34.0 |
| Active CEO/chair/president/COO | 13% | 17% |
| Retired CEO/chair/president/COO | 15% | 19% |
| Financial backgrounds | 23% | 27% |
| Functional/division/subsidiary corporate executives | 32% | 23% |
| First-time directors | ||
| # of first-time directors | 125 | 114 |
| % of all new directors | 43% | 28% |
| Average age | 54.9 | 54.0 |
| Women directors | ||
| Women as % of all directors | 26% | 28% |
| Boards with at least one woman director | 99% | 100% |
| Boards with at least two women directors | 83% | 95% |
| Boards with at least three women directors | 42% | 66% |
| Women as a % of board leadership roles: | ||
| Independent board chairs | 2% | 1% |
| Lead directors | 5% | 11% |
| Audit committee chairs | 23% | 26% |
| Compensation committee chairs | 22% | 25% |
| Nominating/governance committee chairs | 27% | 28% |
| CEO profile | ||
| % of CEOs serving on one or more outside boards | 28% | 42% |
| # of women CEOs | 25 | 30 |
| Boards where CEO is the only non-independent | 57% | 63% |
| Average age | 57.7 | 58.1 |
| Average tenure with company | 15.9 | 19.6 |
| Board leadership | ||
| Chair/CEO combined roles | 32% | 45% |
| Independent chair | 44% | 34% |
| Lead/presiding director | 52% | 73% |
| Board meetings | ||
| Average number of board meetings | 7.5 | 7.9 |
| Median number of board meetings | 7 | 7 |
| Retirement policies | ||
| Mandatory Retirement Policies | ||
| Boards with mandatory retirement age | 57% | 70% |
| Average retirement age | 73.8 | 73.6 |
| Boards with mandatory retirement age of 75+ | 57% | 48% |
| Boards with mandatory retirement age of 72+ | 95% | 96% |
| Tenure Policies | ||
| Boards with tenure policies | 6% | 6% |
| Average tenure limit | 15.0 | 14.6 |
| Boards with tenure policy of 15+ years | 68% | 71% |
| Committee details (average number) | ||
| Number of committees | 4.0 | 4.2 |
| Audit committees | ||
| Size | 4.1 | 4.4 |
| Meetings | 7.4 | 8.2 |
| Compensation committees | ||
| Size | 3.9 | 4.3 |
| Meetings | 5.6 | 5.9 |
| Nominating committees | ||
| Size | 4.1 | 4.4 |
| Meetings | 4.1 | 4.5 |
