 Print
PrintAdam Kommel is a Shareholder Activism Data Specialist, Arun Verma is the Head of Quant Research Solutions, and Ken Kohn is a Product Manager at Bloomberg LP. This post is based on a Bloomberg publication. Related research from the Program on Corporate Governance includes The Long-Term Effects of Hedge Fund Activism by Lucian Bebchuk, Alon Brav, and Wei Jiang (discussed on the Forum here); Dancing with Activists by Lucian Bebchuk, Alon Brav, Wei Jiang, and Thomas Keusch (discussed on the Forum here); and Who Bleeds When the Wolves Bite? A Flesh-and-Blood Perspective on Hedge Fund Activism and Our Strange Corporate Governance System by Leo E. Strine, Jr. (discussed on the Forum here).
This post investigates the results of the Bloomberg Activism Screening Model. The model’s goal is to answer a basic question: Which companies in a list of equities may become targets for activist investors? This model has been requested frequently by Bloomberg clients. Advisers to activists and targets as well as internal experts recommended the screening criteria.
The model selected 17 factors from a pool of 60 candidate factors. These factors fall into 5 categories: Returns (5), Valuation (4), Ownership (3), Governance (3) and Operations (2). Some factors are based on market data, including returns over 6 months, 1, 2, 3 and 5 years. Some are derived, including price/earnings ratio relative to peers and margins relative to peers. Others are compiled by Bloomberg, including CEO tenure and whether the company has dual-class unequal voting rights. Each criterion, scaled from 0 to 100, is applied to all the companies in a list (for this investigation, the Russell 3000 Index was used). Companies are ranked by the outcomes, with those higher on the list considered more likely to draw the interest of activists.
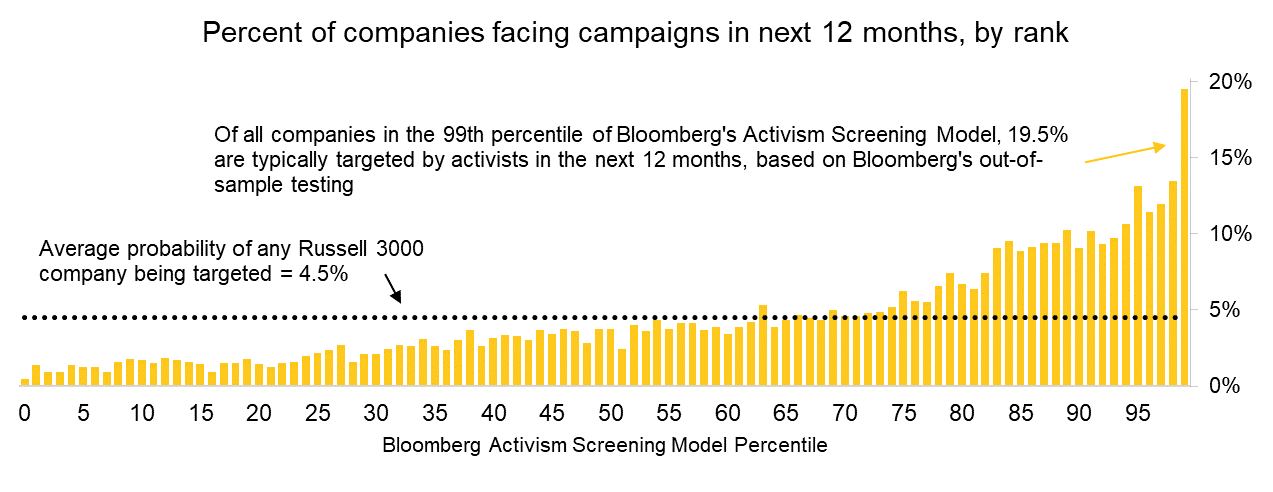
The examination looked at four years of data and found that, on an out-of- sample basis, 20% of companies in the top one percent of the ranking may face activist campaigns in the next 12 months. The average base rate for the entire Russell 3000 is 4.5%.
The results of the screening may differ for lists outside the Russell 3000. The criteria are available to Bloomberg clients in the (EQS<GO>) Equity Screening function under Popular Screens, which allows clients to save the screen and change the criteria.
Abstract
In this post, we propose a combination of factors that may be used to anticipate activist campaigns. Results demonstrate that it is possible to order companies by their likelihood of facing campaigns using data points on returns, valuation, operations, governance and ownership.
The study is conducted by collecting a list of 60 factors we expect should correlate to activist targets. We determine out-of-sample values by finding the best-performing factor combinations for 80% of our 2017-2020 dataset and testing those combinations on the remaining 20%. Finally, we use this data to produce a ranking that clients can access in EQS <GO>.
Introduction
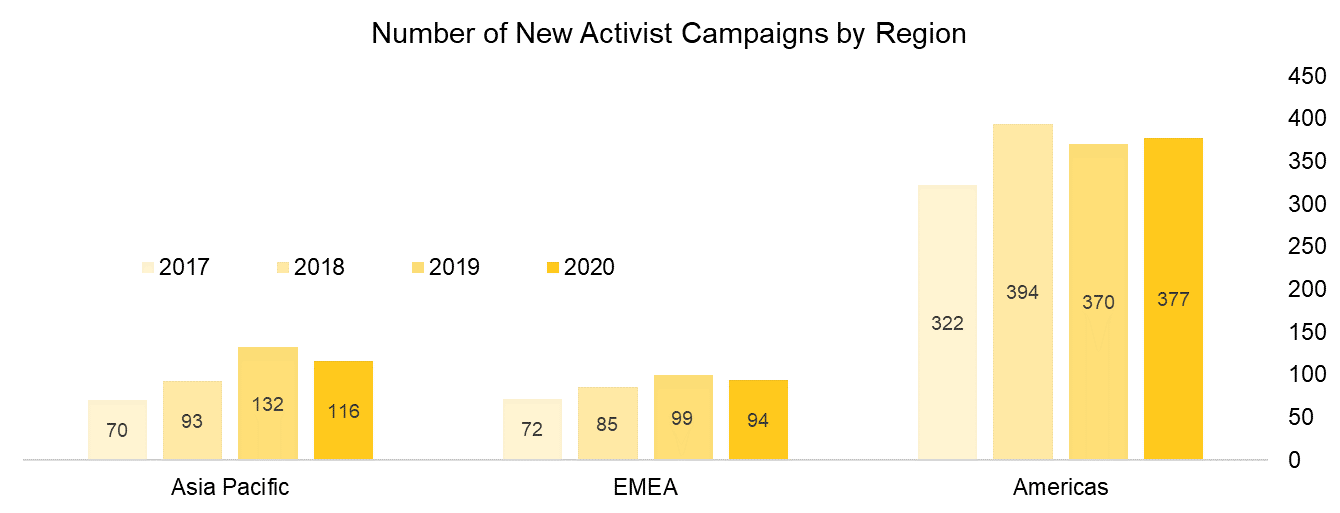
As activist campaigns developed from a rarity to an asset class, the need for robust data has grown. Bloomberg launched its global activism database (BI ACT <GO>) in 2019. In January 2021, Bloomberg released the Bloomberg Activism Screening Model, which ranks potential activist targets. Globally, there were 587 campaigns announced in 2020, down from 2019’s 601 but up from 572 in 2018. [1]
The market views activists as catalysts for positive change. Stock prices of target companies typically increase the day of a campaign announcement. The average one-day return of companies targeted from 2017-2020 was 2.3%; the bump was 3.3% for investors considered “Core Activists” by Bloomberg.
Training and testing the model
The goal of the Bloomberg Activism Screening Model is to rank companies based on their likelihood of becoming activist targets by using datasets available through Bloomberg’s standard API.
To optimize our rankings, we trained the model on activist campaigns in the Russell 3000 announced from 2017-2020. We exclude companies that already face activist campaigns, which reduces our list to about 2,700-2,800 companies. [2] On average, 4.5% of such Russell 3000 companies are targeted by activist campaigns over the following 12 months (approximately 120 companies).
We determined the optimal combination of factors by testing the performance of thousands of possible equally weighted combinations of the 60 factors to determine which most accurately anticipated future campaigns.
We performed each test using company data from four point-in-time reference dates: year-end dates from 2016 to 2019. We then combined the data from the four years into a single table of 11,000 rows, representing companies at a given point in time; and 60 columns, representing data points for each company and date. We shuffled this table 100 times and created 100 pairs of training sets (80% of the table) and testing sets (remaining 20% of the table).
We can determine expected out-of-sample (go-forward) precision by observing average out-of-sample results of the best in-sample combination for each of our 100 random shuffles. [3]
Results
We found that in out-of-sample testing, 19.5% of the companies ranked in the top one percent are targeted by activists in the following 12 months — or 4.3x the base rate of 4.5%.
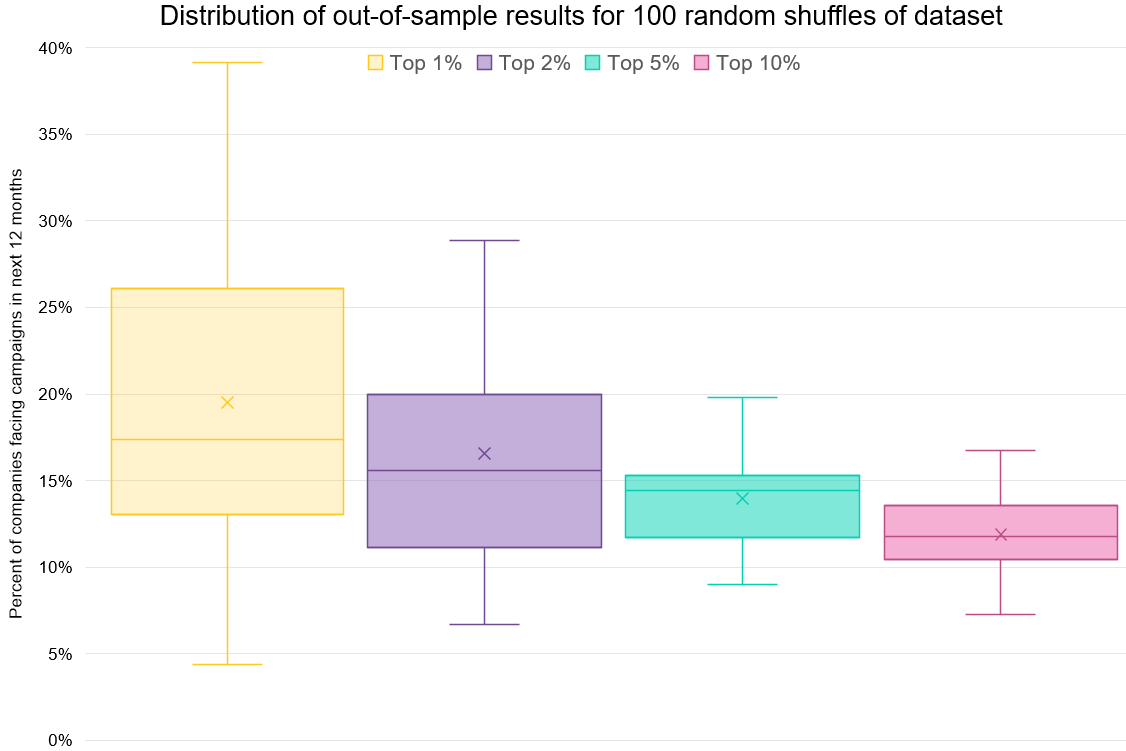
Below is the distribution of out-of-sample hit rates within the top 1%, 2%, 5% and 10% of the rankings created in the 100 shuffles. In this chart, the box highlights the middle two quartiles, with a line for the median and marker for the mean. The “whiskers” extend up to the highest and lowest points excluding outliers, following the Tukey industry standard, which defines values as outliers if they are more than 1.5 times the length of the box from either end of the box.
Factors
We started with 60 factors based on suggestions from internal and external experts. The tests allowed us to remove many because they showed little correlation with activist activity or didn’t enhance the results of the study. We were left with the 17 that most effectively anticipated campaigns.
Most factors are normalized by percentile ranking against the full Russell 3000 universe or industry peer group, where a score of 100 indicates the highest expected likelihood of being targeted by an activist and 0 indicates the lowest. Some factors were binary, for example, whether a company has unequal voting share classes: 100 if not, 0 if so.
To get to that list of 17, we didn’t pick only the best-performing possible combination, which would risk an overfit list of factors. Instead, we looked at which factors most frequently appeared in the list of top combinations and excluded factors that rarely showed up in that list. We excluded factors until we determined further reductions did not improve results. We considered the value of factors/combinations to the top 1%, 2%, 5% and 10% hit rates, as well as the average percentile rank of activist targets in each combination.
All factors are evenly weighted. While weighting factors improved in-sample hit rates, out-of-sample hit rates did not — suggesting weightings allowed overfitting.
The 17 factors are shown below. Missing data is scored as 50th percentile unless otherwise noted. When factors are created from ranking against industry peers, BICS (Bloomberg Industry Classification System) Level 3 industries are used. If a company is the only member of its industry in the universe (Russell 3000), then BICS Level 2 industry groups are used.
| Category | Factor | Scoring | Reason |
|---|---|---|---|
| Governance | No unequal voting share classes | Binary: 0 if unequal voting, 100 if not | Dual-class voting rights usually make it impossible for an activist to win a proxy fight |
| High compensation | Percentile rank vs. similar market caps. Split universe into 10 bins by market cap. Compare within each bin | High compensation may attract activist criticism | |
| Low CEO tenure | Percentile rank vs. industry peers | CEO turnover may indicate dissatisfaction with the company; activists may find new CEOs less protected by boards | |
| Operations | Low LTM EBITDA/
operating margins |
Percentile rank vs. industry peers. Use EBITDA margin when available; otherwise compare with operating margins. If EBITDA margin < -100 or is blank, treat as if it were a very high number | Low margins indicate possibility for increased profitability. However, extremely negative margins more often indicate a pre-revenue company, which activists rarely target |
| Low sales-to-assets (last FY) | Percentile rank vs. industry peers | Sales leverage is a measure of how efficiently companies use assets | |
| Ownership | High institutional ownership | Percentile rank | High institutional ownership makes it easier for an activist to win support in a proxy fight |
| High 30-day volume as % of outstanding | High trading volume allows activists to accumulate large stake without significantly moving stock price | ||
| Float higher than 70% | Binary: 0 if <= 70%, 100 if > 70% | Non-float shares almost always side with management, but there is no distinguishable difference between companies with a 70% float and 100% float | |
| Returns | Low 5-year return | Percentile rank. If blank, use 3-year percentile rank | Long-term negative returns may indicate shareholder dissatisfaction |
| Low 3-year return | Percentile rank. If blank, use 50%, as activists less often target companies listed in last
3 years |
||
| Low 2-year return | |||
| Low 1-year return | Short-term negative returns provide opportunities for activists to buy stake | ||
| Low 6-month return | |||
| Valuation | Low price/book | Percentile rank vs. industry peers | Low valuations indicate that a sale of the entire company could yield a significant premium to the current price |
| Low LTM EV/Sales | |||
| Low forward EV/EBITDA | Percentile rank vs. industry peers. Blended forward 12 months | ||
| Low forward P/E |
The average percentile rank of activist targets for each of the 15 percentile-ranked factors is shown in graph below, sorted by highest average score.
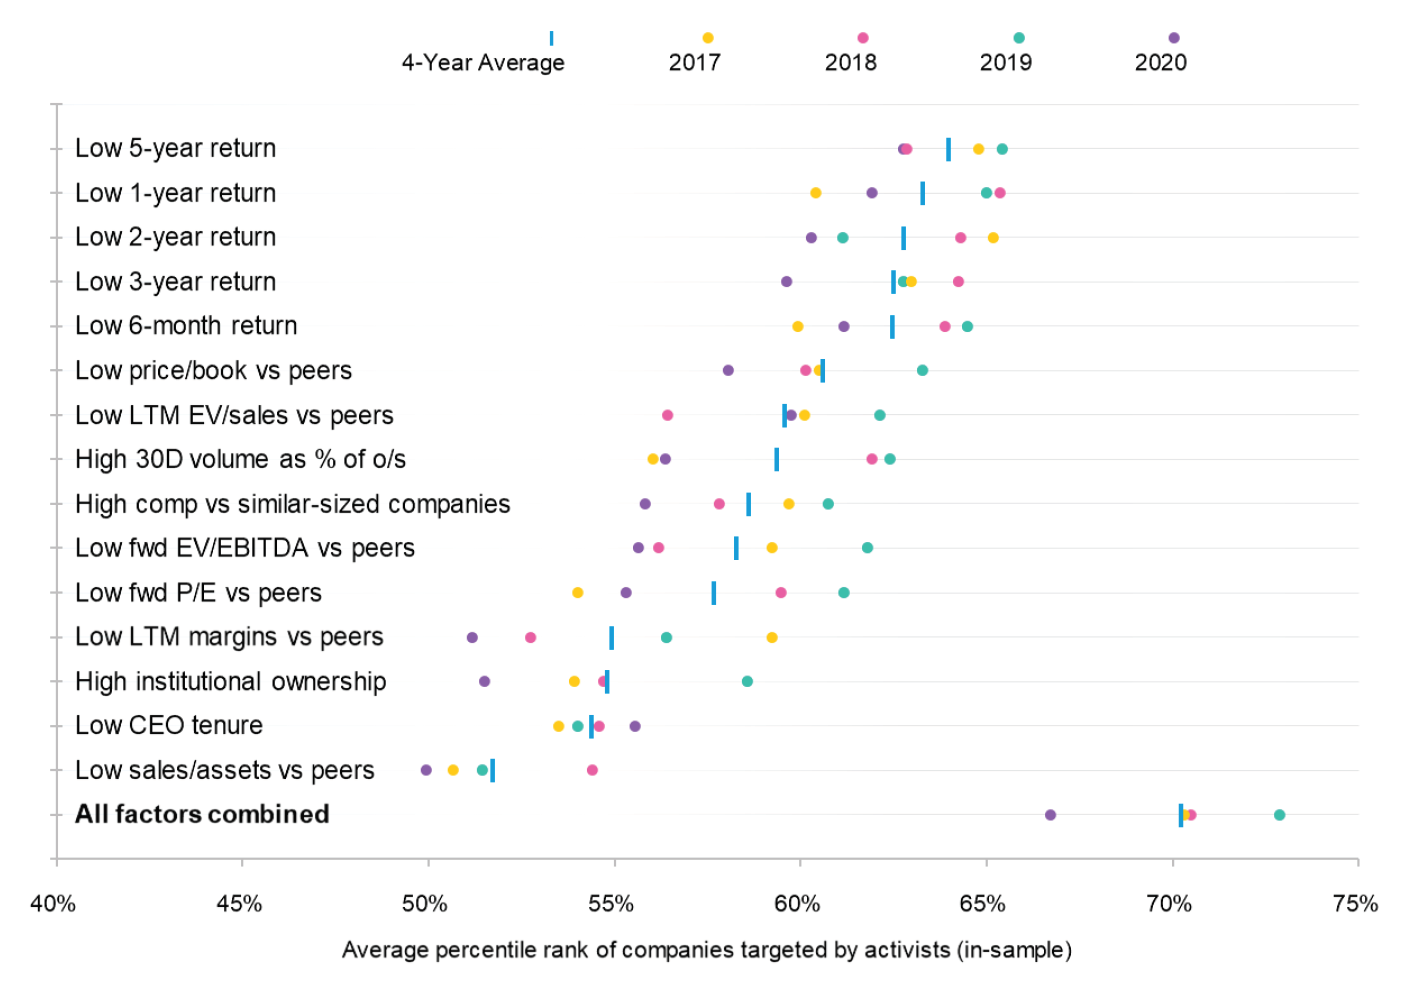
For example, in the first row above, creating a ranking of Russell 3000 companies using only 5-year return data would show the average activist target was located in the 64th percentile in the year-end prior to campaign start (companies with the lowest returns are in the 99th percentile and higher returns are in the 1st percentile). [4]
Another way to explore single-factor correlation to activism is to review hit rates within quintiles: On average, what percent of companies in each quintile are targeted by activist campaigns in the following 12 months?
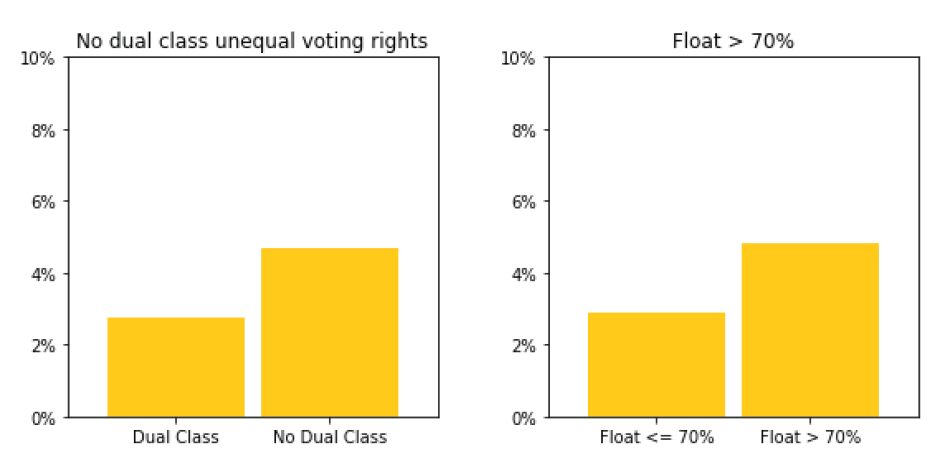
In the graphs below, the X-axis shows each quintile (there are an equal number of companies in each quintile). The first quintile (on the left) has the lowest expected activism chances, and the last quintile has the highest (i.e., 80-99th percentile for the specific factor). The Y-axis is the percent of companies facing activist campaigns over the next year for each quintile.
The graphs are ordered by each factor’s correlation to activism.


Two factors are binary instead of percentile-ranked:
Although some factors (such as sales/assets ratio) have only minimal correlation to activist campaigns by themselves, we found that these factors are useful contributors when combined with the other factors in the score.
In addition, some factors may not be items that activists look for, but serve as a proxy for a less measurable item. For example, few activists are looking for companies with new CEOs, but a short CEO tenure may indicate significant change or recent disruptions.
Below is a sampling of factors we discarded. Exclusion did not necessarily mean the factor was not correlated with activism, but rather that it did not improve results when combined with the other 17 factors.
Governance
- Director support, say-on-pay support
- Percent of non-executive directors on 3+ boards
- Board size vs. similar size (market cap) companies
- Poison pill, staggered board
Operations
- Net cash as percent of market cap, net debt/EBITDA, assets to equity
- Return on equity, return on invested capital, Economic Value Added (EVA)
- Earnings per share (EPS) growth, sales growth, employee growth
- Gross margin, operating margin
- Capital expenditures/sales, working capital/sales, cash conversion cycle
- Dividend, dividend payout, total payout ratio
Ownership
- Hedge fund ownership, short interest
- Insider ownership
Returns
- Returns vs. peers over various timeframes
- Relative Strength Index (RSI), volatility
Valuation
- Number of analyst ratings, average analyst rating
- Free cash flow yields (levered and unlevered), EV/EBIT
On the Terminal
Bloomberg clients may apply the Activism Screening Model in EQS to any index or group of securities. Below is a screenshot of results as of December 31, 2020.
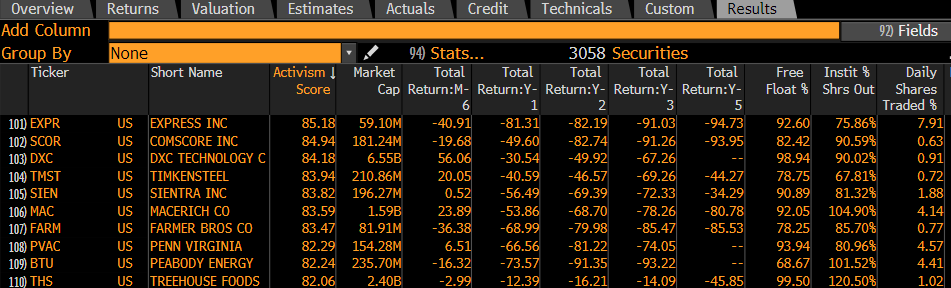
Below are the top 25 companies that were not subject to an activist campaign as of December 31, 2020. (EQS does not filter out companies that are already subject to activist campaigns, so comScore, Macerich, Farmer Bros and Peabody, which already have activists, appear in the screenshot but are not included in the list below.)
| Ticker | Company | Sector | Market Cap (USD Mln) |
|---|---|---|---|
| EXPR | Express, Inc. | Consumer Discretionary | $59 |
| DXC | DXC Technology Company | Technology | $6,551 |
| TMST | TimkenSteel Corporation | Materials | $211 |
| SIEN | Sientra, Inc. | Health Care | $196 |
| PVAC | Penn Virginia Corporation | Energy | $154 |
| THS | TreeHouse Foods, Inc. | Consumer Staples | $2,401 |
| APTS | Preferred Apartment Communities | Real Estate | $369 |
| TDC | Teradata Corporation | Technology | $2,456 |
| VREX | Varex Imaging Corporation | Health Care | $653 |
| RLGY | Realogy Holdings Corp. | Real Estate | $1,515 |
| ASMB | Assembly Biosciences, Inc. | Health Care | $200 |
| SM | SM Energy Company | Energy | $701 |
| CHS | Chico’s FAS, Inc. | Consumer Discretionary | $191 |
| ARCH | Arch Resources, Inc. | Materials | $663 |
| AYI | Acuity Brands, Inc. | Industrials | $4,461 |
| NERV | Minerva Neurosciences, Inc. | Health Care | $100 |
| RRGB | Red Robin Gourmet Burgers, Inc. | Consumer Discretionary | $299 |
| HRTG | Heritage Insurance Holdings, Inc. | Financials | $284 |
| GCO | Genesco Inc. | Consumer Discretionary | $451 |
| FANG | Diamondback Energy, Inc. | Energy | $7,646 |
| AXL | American Axle & Manufacturing | Consumer Discretionary | $945 |
| SPTN | SpartanNash Company | Consumer Staples | $624 |
| EPC | Edgewell Personal Care Company | Consumer Staples | $1,885 |
| BHF | Brighthouse Financial, Inc. | Financials | $3,241 |
| BDC | Belden Inc. | Industrials | $1,869 |
Endnotes
1BI ACT <GO> defines an activist campaign as any situation where a shareholder is publicly seeking to influence a company without management support. Sources are typically press releases, regulatory filings or media reports. The database also tracks significant ownership stakes held by investors whose core focus is activism, even if the investor has not made any public demands. We also include activist-like actions of unsolicited bidders taking toehold stakes in targets, as well as hostile bids. Environmental/social-focused campaigns by small shareholders are not included in the dataset; we only include campaigns by economic activists (though we do include a small number of environmental/social-focused campaigns by major economic activists, such as those by TCI Fund Management).(go back)
2We also exclude from our training set campaigns that began with opposition to an announced merger as these deals are often take-privates with high insider ownership at companies that an activist would not normally target.(go back)
3That is to say, for the first random shuffle of our table, we can test thousands of combinations of our 60 factors on the 80% training set. Assume the best-performing combination was a specific 20-factor model. How does that model do on the 20% testing set? Repeat the entire process for all other shuffles, so the same combination is rarely used twice. What is the average out-of-sample result for all 100 random shuffles?(go back)
4The results in 2020 were poor for two reasons. First, the market disruption in early 2020 meant the companies that were vulnerable in the last three quarters of the year were very different from the companies in the list on January 1. Second, the results are skewed by five strongly performing companies that TCI Fund Management targeted for environmental proposals in 2020 (Charter, Alphabet, Union Pacific, S&P Global and Moody’s — all five were in the bottom quintile of the score). Recognizing the unique nature of these five campaigns and their negative correlation to most campaigns, we excluded them during the process of selecting our final 17 factors but included their effect in the presentation of our results. Had we excluded the effect of these five campaigns from the chart above, the average activism score percentile (“All factors combined” row in above chart) of activist targets in 2020 would have been 69.4% instead of 66.7%.(go back)
