 Print
PrintJaneen McIntosh and Svetlana Starykh are Senior Consultants at NERA Economic Consulting. This post is based on a NERA memorandum by Ms. McIntosh, Ms. Starykh, Dr. David Tabak, and Zhenyu Wang.
In this year’s update to NERA’s annual study, “Recent Trends in Securities Class Action Litigation”, we analyze trends in securities class action filings and resolutions based on activity through 2020.
Highlights from this year’s report include:
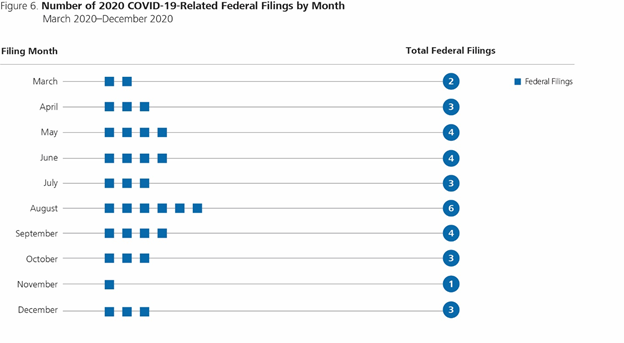
- Since the first COVID-19-related lawsuit in March 2020, 32 additional filings have included COVID-19-related claims in their complaints.
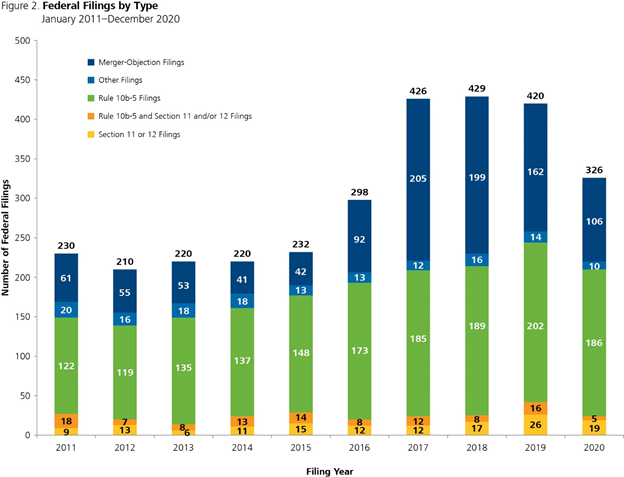
- There were 326 federal securities class actions filed in 2020. This marks a 22% decline from 2019, primarily driven by fewer merger objection cases filed.
- The percentage of new filings that were Rule 10b-5, Section 11, and/or Section 12 cases increased from 58% in 2019 to 64% in 2020. Other types of cases declined.
- Continuing a 2019 trend, defendants the electronic technology and technology services sector faced the most securities class action filings at 23% of 2020’s total.
- For the first time in five years, complaints including an allegation related to misled future performance outnumbered claims related to accounting issues, regulatory issues, or missed earnings guidance.
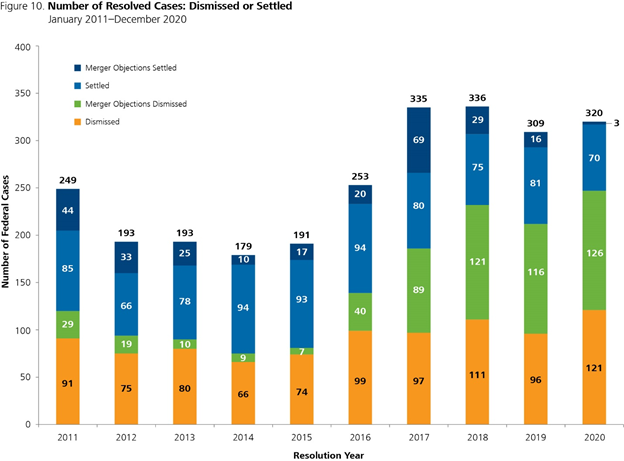
- In 2020, 320 cases were resolved, marking a slight increase from the total number of cases resolved in 2019, but remaining below the number of cases resolved in 2017 and 2018.
- Aggregate resolutions returned to a level relatively in line with 2017 and 2018 levels, but settlement declined while dismissals increased to outside the historical 10-year ranges.
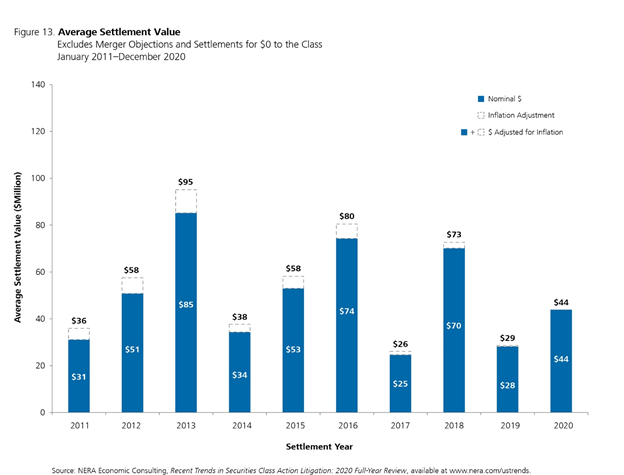
- The average settlement value in 2020 was $44 million, more than a 50% increase over the 2019 average of $28 million but still below the 2018 value.
Trend in Filings
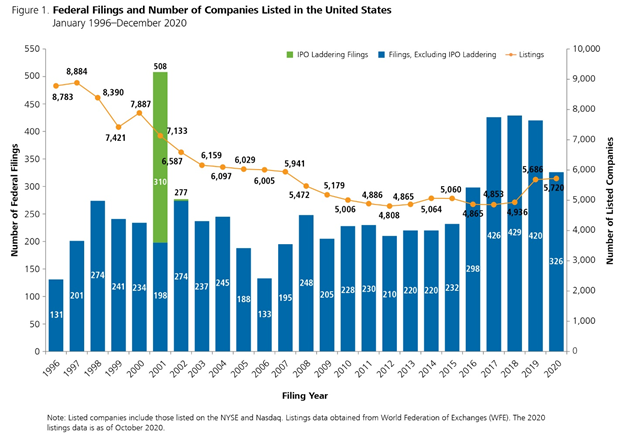
For the first time since 2016, annual new securities class action filings declined to less than 400 cases. [1] Between 2015 and 2017, new filings grew significantly, by approximately 80%, and remained stable with between 420 and 430 annual filings from 2017 to 2019. There were 326 new case filed in 2020, which, despite the decline, is still higher than the average of 223 observed in the 2010–2015 period. Whether this decline in new filings is the end of the general higher level of filings observed in recent years or a short-term byproduct of the implications of the COVID-19 pandemic is yet to be determined.
Based on data as of October 2020, there were 5,720 companies listed on the NYSE and Nasdaq exchanges. [2] As a result of the decline in the number of new filings and the growth in the number of listed companies in 2020, the ratio of new filings to listed companies declined to 5.7%, the lowest ratio in the last five years.
The decline in federal cases differed by type of case with the largest percentage decline observed among the Rule 10b-5 and Section 11 or Section 12 category of cases. New filings of Rule 10b-5 and Section 11 or Section 12 cases in 2020 declined by more than 65% when compared to 2019. Filings of merger objections, other securities class action cases, and Section 11/Section 12 cases each declined by between 25% and 35%, while Rule 10b-5 cases declined by less than 10%.
Over the 2015–2018 period, the largest proportion of SCA suits filed were against defendants in the health technology and services sector. Because of a gradual downward trend in the proportion of cases filed against companies of this sector between 2016 and 2019, and an accompanying growth in the proportion of cases filed against defendants in the electronic technology and technology sector, in 2020, the electronic technology and technology services sector represented the largest proportion of new cases filed. In 2020, 23% of filings were against defendants in this sector, followed closely by defendants in the health technology and services sector, which accounted for 22% of new filings.
In 2019, we observed a spike in cases involving allegations of missed earnings guidance, with over 30% of cases involving a related claim. However, the proportion of cases alleging claims related to missed earnings guidance decreased to 23% in 2020. For cases filed in 2020, there emerged a new common allegation; 35% of the complaints included a claim related to misled future performance.
Recent Developments in Federal Filings [3]
COVID-19
In March of 2020, the COVID-19 pandemic changed the way individuals work, the way they live, and how companies operate. The pandemic’s impact on filings has not yet been fully determined and it will likely take time to evaluate if it was the underlying driver of the lower level of cases filed in 2020. On the other hand, the pandemic brought about a new category of event-driven cases, with the first such case filed in March. Since then, there have been 33 cases filed with claims related to COVID-19 included in the complaint.
Of the COVID-19-related cases filed in 2020, the proportion against defendants in the combined health technology and health services sectors is 24%. Approximately 21% of the COVID-19 cases were filed against defendants in the finance sector and the consumer services and technology services sectors each accounted for approximately 15% of cases.
In addition to tracking COVID-19-related filings, we have also monitored federal securities class action filings in a number of recent development areas.
Bribery/Kickbacks
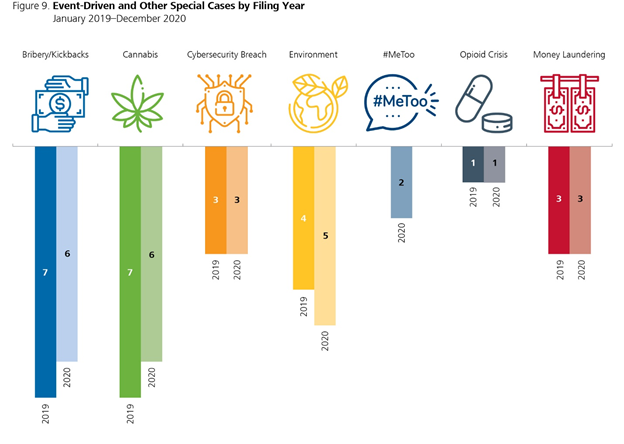
Securities class action suits related to claims of bribery have remained fairly stable over the 2019–2020 period, with five such cases filed in 2019 and six filed in 2020. Of the 11 cases filed in the last two years, all remain pending as of December 2020. These cases span a range of sectors, with the electronic technology and technology services sector accounting for the highest proportion. In addition, cases filed with claims related to kickbacks are still being brought to the courts, with one case filed in both 2019 and 2020. Both of these cases include claims related to regulatory issues.
Cannabis
In last year’s report, we identified filings against companies in the cannabis industry as a development area. In 2020, filings within this industry have continued with six new cases. The allegations in these recent complaints related to accounting issues, misled future performance, and missed earnings guidance. The majority of cases continue to be presented in the Second Circuit and all defendants but one are in the process industries sector.
Cybersecurity Breach Cases
In 2020, like 2019, there were three new filings related to a cybersecurity breach. The Ninth Circuit continues to be a common venue for these cases. Among the six cases filed between 2019 and 2020, four have included allegations related to missed earnings guidance or misleading future performance, with only one case alleging regulatory issues.
Environment-Related
Similar to bribery-related cases, filings pertaining to environment-related claims have continued to be presented at a steady pace, with five cases filed in 2020 and four cases filed in 2019. Four of the nine cases recently filed include allegations related to regulatory issues and five were filed in the Second and Ninth Circuits.
#MeToo
Following the surge of #MeToo cases filed in 2018, only two such cases have been filed in the last year. Both cases were filed in the second half of 2020.
Opioid Crisis
Only two cases related to the opioid crisis have been filed since 2018, both of which were filed in the Third Circuit and include allegations related to accounting and regulatory issues.
Other
Cases with claims of money laundering also continue to be filed, with three such cases filed in both 2019 and 2020. All six of these cases included an allegation related to regulatory issues.
Trend in Resolutions
In 2020, 247 cases were resolved in favor of the defendant and 73 cases were settled, for a total of 320 resolutions for the year. This represents an increase of approximately 4% in resolved suits over the 309 cases resolved in 2019.
Despite the aggregate increase in resolutions, the trend observed in dismissals and settlements differed. While there was a decline of 25% in the number of settled cases, there was an increase in the number of dismissed cases. [4] The number of cases settled in 2020 is the lowest recorded number of settled cases in the most recent 10-year period and is more than 40% lower than the average number of settled cases (122) observed between 2016 and 2018. At this time, there is insufficient evidence to determine whether this lower number of settlements is connected to COVID-19-related factors. The increase in the number of dismissed cases was sufficient to not only offset the decrease in settlements but also to increase the overall number of resolved cases. The number of cases dismissed in 2020 also set a new 10-year record with approximately 6% more cases dismissed than in 2018, the second highest year in the period.
Trend in Settlement Values
The average settlement value in 2020 was $44 million for non-merger objection cases with settlements of more than $0 to the class. This is a more than 50% increase over the 2019 inflation-adjusted average of $29 million but still below the 2018 inflation-adjusted average of $73 million. Historically, the average settlement value has shown year-to-year variation partly due to the presence or absence of one or two “outlier” settlements. Between 2011 and 2020, the annual inflation-adjusted average settlement value has ranged from a low of $26 million in 2017 to a high of $95 million in 2013. As such, the 2020 average is well within the range observed within the last 10 years.
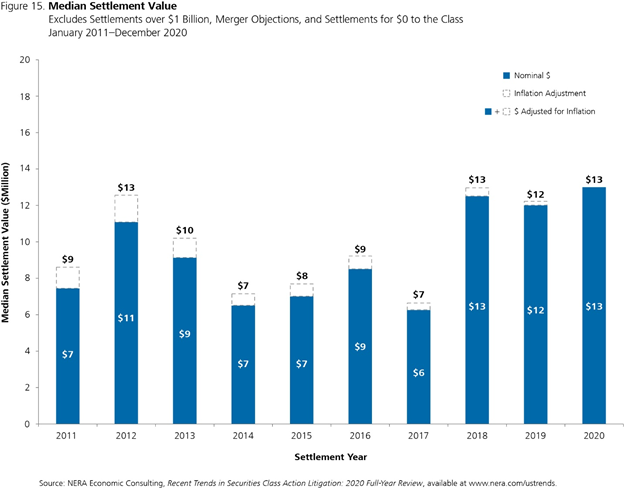
The median annual settlement value for 2020 was $13 million, the highest recorded median value in the last 10 years (the median settlement value for cases settled in 2018 was also $13 million). Though the median settlement value for 2020 is less than 10% higher than the inflation-adjusted median in 2019, the 2020 value is nearly twice the inflation-adjusted median settlement value for cases settled in 2017. The general increasing trend in annual median settlement values indicates an upward shift in individual settlement values. In other words, a higher proportion of cases has settled for higher values in the last three years when compared to settlements that occurred in 2017 or before.
An evaluation of the change in the distribution of settlement values over the past five years further supports this notion. There has been a downward trend in the proportion of cases with individual settlements less than $10 million and a corresponding increase in the proportion of cases found in the higher settlement ranges. More specifically, in 2017, 61% of cases resolving for positive payment had settlement values of less than $10 million compared to 44% of 2020 cases settled within this category. Similarly, 24% of 2017 settled cases had settlement values between $10 million and $50 million while 40% of the 2020 settled cases had individual settlements within this range. This pattern of a greater proportion of settled cases within the $10–$50 million range in the last three years aligns with the higher annual median settlement values observed in these years.
NERA-Defined Investor Losses
As a proxy to measure the aggregate loss to investors from the purchase of a defendant’s stock during the alleged class period, NERA relies on its own proprietary variable, NERA-defined Investor Losses. [5] This measure of the aggregate amount lost by investors is estimated using publicly available data and is calculated assuming an investor had alternatively purchased stocks that performed similarly to the S&P 500 index during the class period. NERA has reviewed and examined more than 1,000 settlements and found that this proprietary variable is the most powerful predictor of settlement amount.
For cases settled between 2012 and 2020, the ratio of settlement to Investor Losses is higher for cases with lower settlement values than for cases with higher settlement values. In other words, smaller cases (measured based on the computed Investor Losses) commonly settle for a larger fraction of the estimated Investor Losses than larger cases, though the decline is not linear. More specifically, the median ratio of settlement value to NERA-defined Investor Losses was 24.5% for cases with Investor Losses below $20 million and 5.2% for cases with Investor Losses between $20 million and $50 million. For cases with Investor Losses between $1 billion and $5 billion, the median ratio was 1.2%, and falls below 1% for cases with Investor Losses of $5 billion and higher.
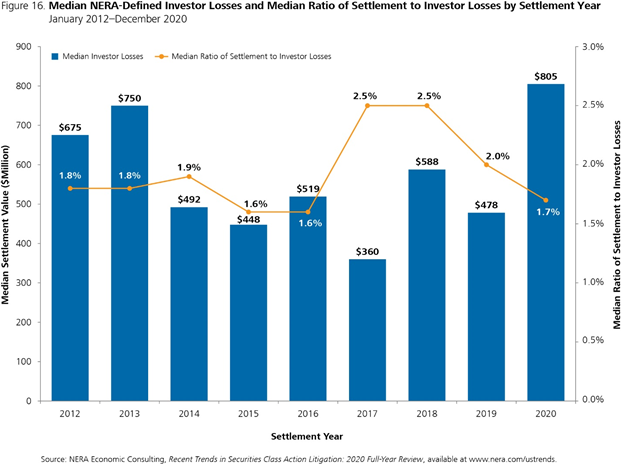
Median Investor Losses and Median Ratio of Actual Settlement to Investor Losses
In 2020, the median Investor Losses rose dramatically, reaching a record-setting high of $805 million. This median is nearly 70% higher than the median value for 2019 of $478 million and 7% higher than the 2013 median value of $750 million. For all years between 2017 and 2019, the median ratio of settlement to Investor Losses was above 2%, a higher ratio than was observed in any of the prior five years. Despite the increase in settlement values in 2020, the increase in Investor Losses led to a decline in the median ratio of settlement to Investor Losses. For 2020, the median ratio of settlement to Investor Losses was 1.7%, one of the lowest ratios observed in the last nine years.
Trends in Plaintiffs’ Attorneys’ Fees and Expenses
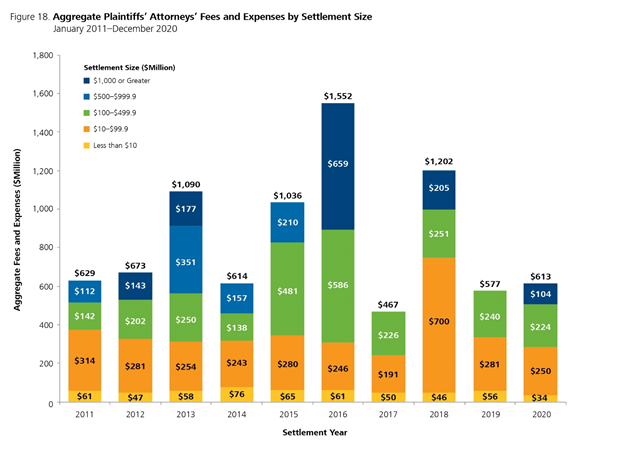
Over the 10-year period ending 31 December 2020, the annual aggregate amount of plaintiffs’ attorneys’ fees and expenses has varied significantly, ranging from a low of $467 million in 2017 to a high of $1,552 million in 2016. In 2020, the aggregate plaintiffs’ attorneys’ fees and expenses was $613 million, an approximate 6% increase over the 2019 amount but still below the 2018 amount of $1,202 million. This increase in 2020 was driven by the presence of the American Realty Capital Properties settlement, which accounted for $105 million of the aggregate fees and expenses for the year. Given that plaintiffs’ attorneys’ compensation is a function of settlement amount, the presence of “mega” settlements—settlements of $1 billion or higher—will result in higher aggregate fees and expenses than settlements for lower values. Although there was an increase in 2020 in the aggregate fees and expenses associated with settlements of $1 billion or higher, there was an decrease in the aggregate fees and expenses related to settlements under $500 million. The increase in the higher settlement range was sufficient to more than offset the decrease in the lower settlement ranges, resulting in an overall increase in aggregate fees and expenses for settlements in 2020.
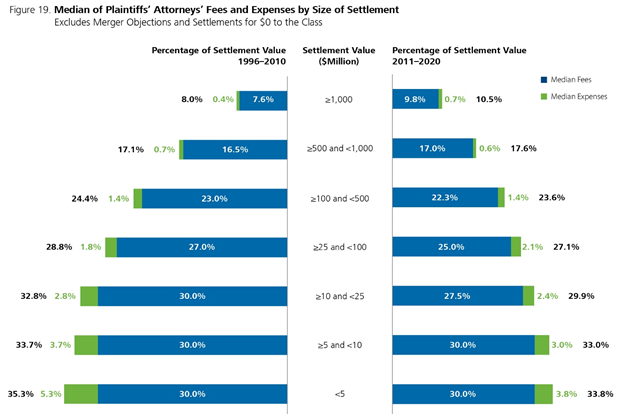
The figure below examines the median of plaintiffs’ attorneys’ fees and expenses as a percentage of settlement value for cases settled between 1996 and 2010 and between 2011 and 2020. As indicated in the chart, plaintiffs’ attorneys’ fees and expenses represent a declining percentage of settlement value as settlement size increases. This pattern is consistent in settlements reached in the last 10 years and settlements reached between 1996 and 2010. More specifically, for settlements of $5 million and less, attorneys’ fees and expenses represent 35% and 34% of the settlement amount for the 1996–2010 and 2011–2020 periods, respectively. In both periods, median plaintiffs’ attorneys’ fees and expenses as a percentage of settlement size is approximately 24% for settlements between $100 million and $500 million. As settlement size increases to $1 billion or greater, the percentage associated with attorneys’ fees and expenses falls to 11% for settlements in the 2011–2020 period and 8% for settlements reached during the 1996–2010 period.
Endnotes
1NERA tracks class actions involving securities that have been filed in federal courts. Most of these cases allege violations of federal securities laws; others allege violations of common law, including breach of fiduciary duty, as with some merger-objection cases; still others are filed in federal court under foreign or state law. If multiple actions are filed against the same defendant, are related to the same allegations, and are in the same circuit, we treat them as a single filing. However, the first two actions filed in different circuits are treated as separate filings. If cases filed in different circuits are consolidated, we revise our count to reflect the consolidation. Therefore, case counts for a particular year may change over time. Different assumptions for consolidating filings would probably lead to counts that are directionally similar but may, in certain circumstances, lead observers to draw a different conclusion about short-term trends in filings.(go back)
2Due to a recent revision to the methodology used to gather data on the number of listed companies on the NYSE and Nasdaq, the historical counts may differ from the counts presented in prior reports.(go back)
3It is important to note that due to the small number of cases in some of these categories, the findings summarized here may be driven by one or two cases.(go back)
4Here the word “dismissed” is used as shorthand for all cases resolved without settlement; it includes cases where a motion to dismiss was granted (and not appealed or appealed unsuccessfully), voluntary dismissals, cases terminated by a successful motion for summary judgment, or an unsuccessful motion for class certification.(go back)
5NERA-defined Investor Losses is only calculable for cases involving allegations of damages to common stock over a defined class period. As such, we have not calculated this metric for cases such as merger-objections.(go back)
