Print
PrintCynthia Hess and Mark Leahy are partners and Khang Tran is an attorney at Fenwick & West LLP. This post is based on their Fenwick memorandum.
Background
Our survey analyzed the terms of 259 venture financings closed in the first quarter of 2021 by
companies headquartered in Silicon Valley.
Key Findings
Valuation results continued their momentum, reaching historical highs
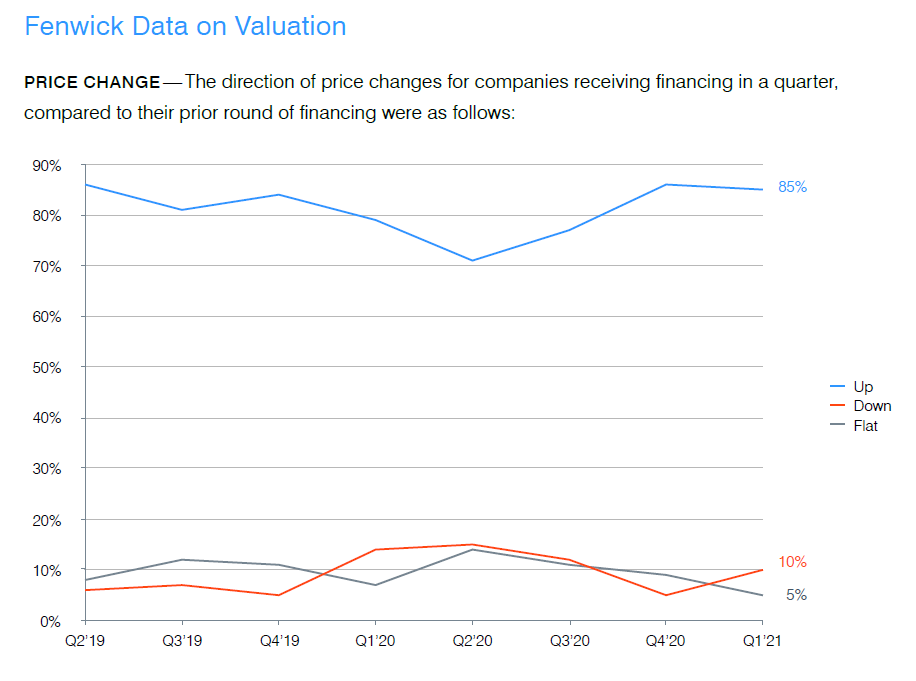
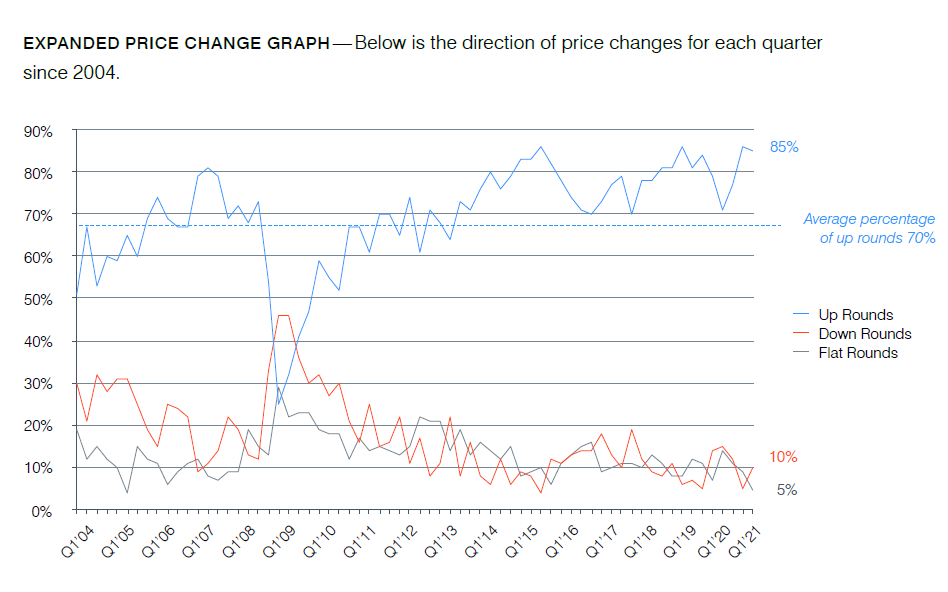
- Up rounds exceeded down rounds 85% to 10%, with 5% flat in Q1 2021, a decrease from the prior quarter when up rounds exceeded down rounds 86% to 5%, with 9% flat.
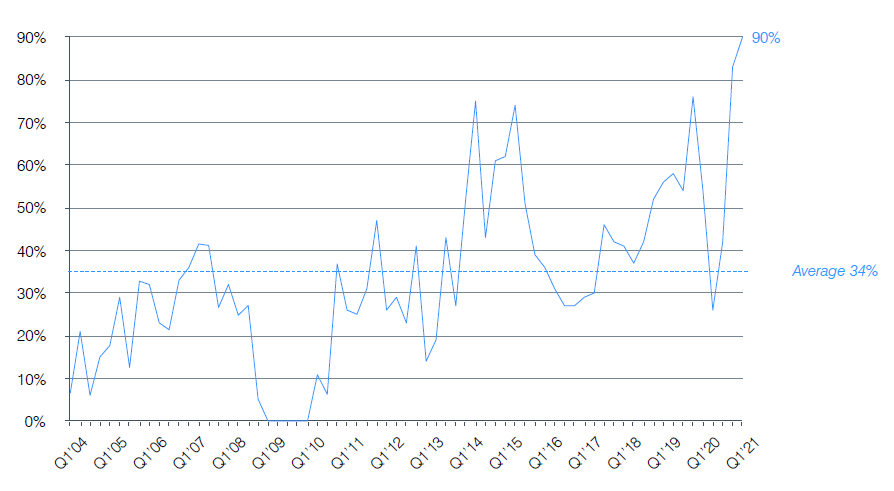
- The Fenwick Venture Capital Barometer™ showed an average price increase in Q1 2021 of 145%, an increase from 125% in Q4 2020 and the highest average price increase recorded in a quarter since we began calculating valuation metrics in 2004.
- The median price increase of financings rose to 90% in Q1 2021, the highest median price increase recorded in a quarter in the history of this survey, surpassing the previous high of 3% recorded in the prior quarter.
Series E+ financings recorded greatest gains in valuation results
- Series E+ financings recording the greatest gains in average and median price increases compared to the prior quarter. In contrast, valuation results for Series C financings declined considerably compared to the previous quarter.
Valuations strengthened across all industries
- Valuation results strengthened across all industries in Q1 2021 compared to Q4 2020. The internet/digital media and software industries again recorded the strongest valuation results in the quarter.
- Valuation results for the hardware industry rebounded to pre-pandemic levels, after having lagged behind other industries during the peak of the pandemic.
Use of senior liquidation preferences and participation rights remained low
- The use of senior liquidation preferences and participation rights remained low in Q1 2021, but
ticked up marginally from the historic lows of the previous quarter.
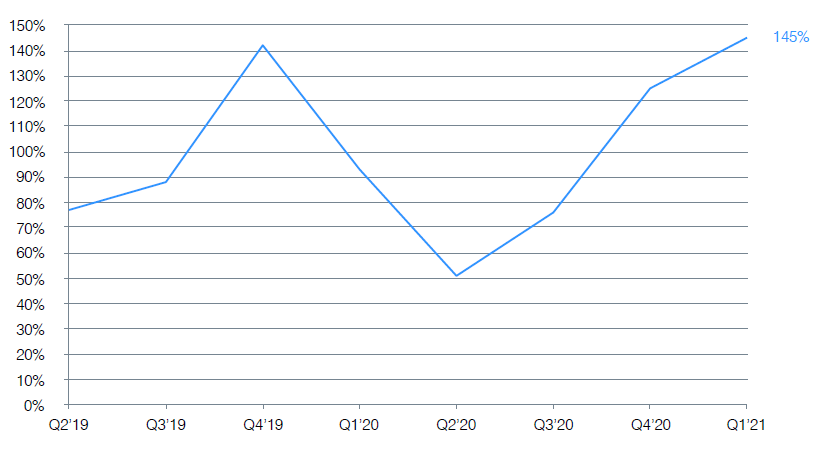
The Fenwick Venture Capital Barometer™ (magnitude of price change) — Below is the average percentage change between the price per share at which companies raised funds in a quarter, compared to the price per share at which such companies raised funds in their prior round of financing. In calculating the average, all rounds (up, down and flat) were included, and results were not weighted for the amount raised in a financing.
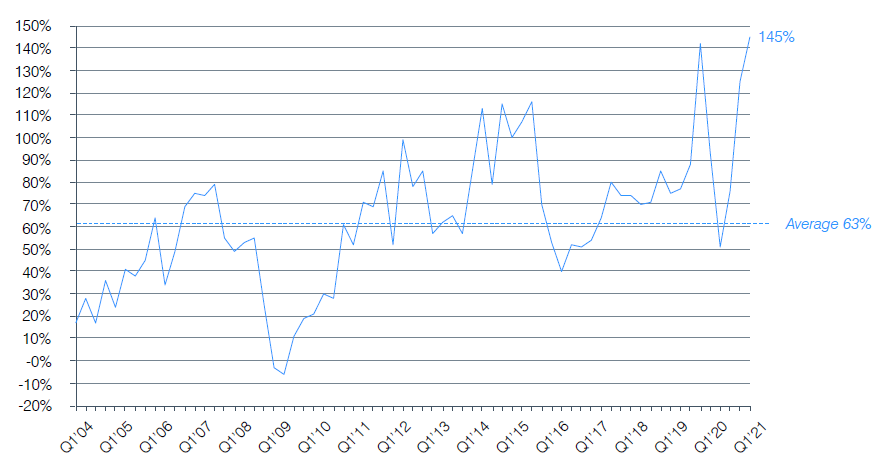
Expanded Barometer Graph — Below is the average percentage price change for each quarter since we began calculating this metric in 2004.
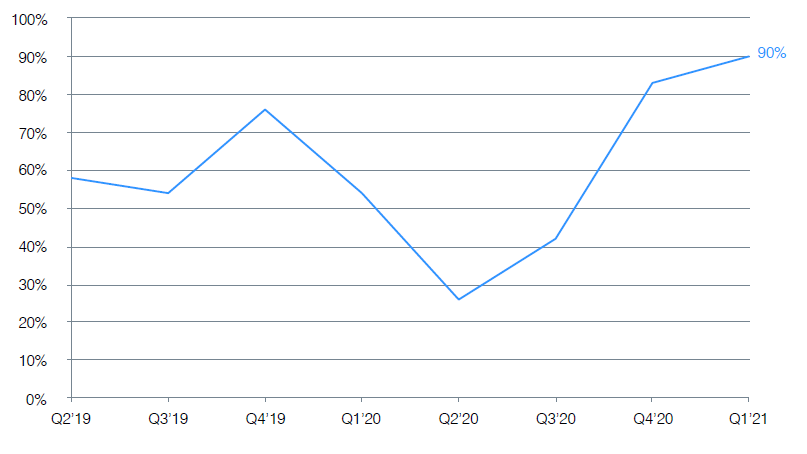
Median Percentage Price Change — Below is the median percentage change between the price per share at which companies raised funds in a quarter, compared to the price per share at which such companies raised funds in their prior round of financing. In calculating the median, all rounds (up, down and flat) were included, and results were not weighted for the amount raised in the financing. Please note that this is different from the Barometer, which is based on average percentage price change.
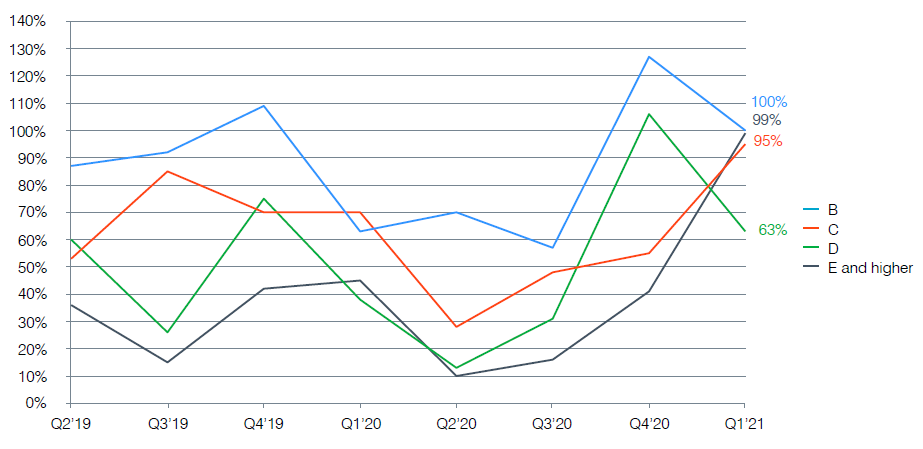
The median price change results by series were as follows:
Expanded Median Price Change Graph — Below is the median percentage price change for
each quarter since we began calculating this metric in 2004.
Results By Industry for Direction of Price Changes and Average and Median Price Changes— The table below illustrates the direction of price changes, and average and median price change results, for companies receiving financing in this quarter, compared to their previous round, by industry group. Companies receiving Series A financings were excluded as they have no previous rounds to compare.
| Industry | Up Rounds | Down Rounds | Flat Rounds | Barometer | Median Price Change | Number of Financings |
|---|---|---|---|---|---|---|
| Software | 88% | 7% | 5% | 160% | 101% | 83 |
| Hardware | 72% | 22% | 6% | 111% | 69% | 18 |
| Life Sciences | 83% | 11% | 7% | 113% | 48% | 46 |
| Internet/Digital Media | 88% | 8% | 4% | 195% | 121% | 25 |
| Other | 80% | 10% | 10% | 115% | 110% | 10 |
| Total all Industries | 85% | 10% | 6% | 145% | 90% | 182% |
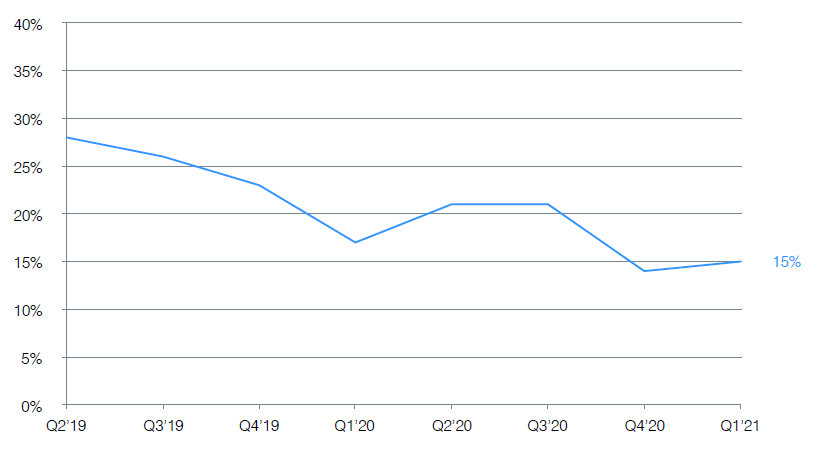
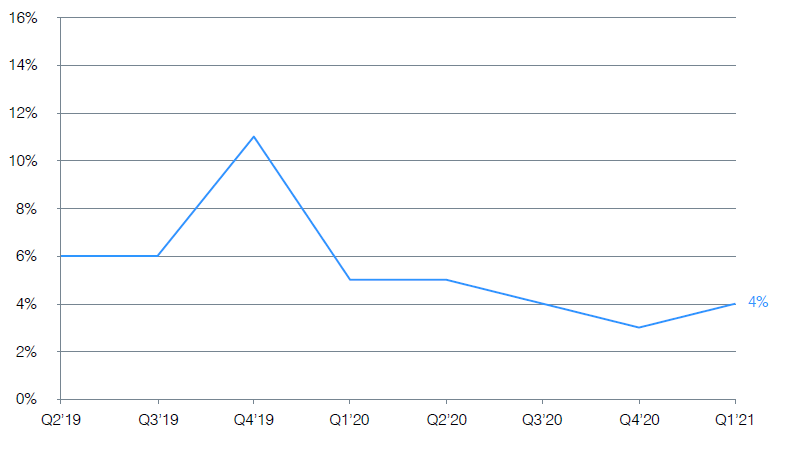
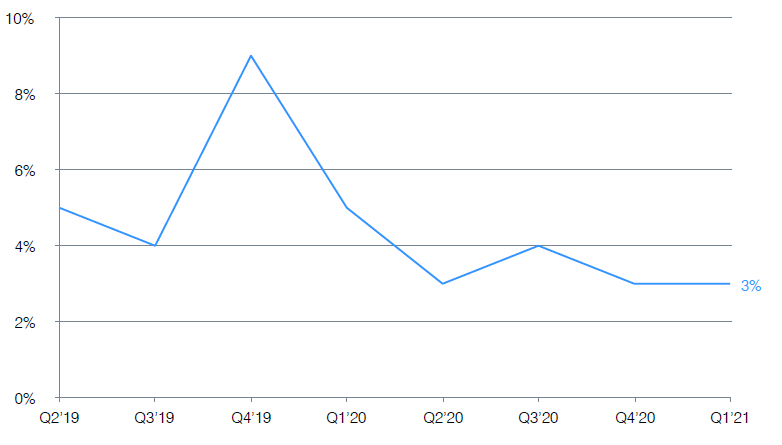
Down Round Results By Industry — The table below illustrates the percentage of “down rounds,” by industry groups, for each of the past eight quarters.
| Down Rounds | Q2’19 | Q3’19 | Q4’19 | Q1’20 | Q2’20 | Q3’20 | Q4’20 | Q1’21 |
|---|---|---|---|---|---|---|---|---|
| Software | 7% | 9% | 6% | 13% | 10% | 13% | 4% | 7% |
| Hardware | 0% | 7% | 8% | 29% | 20% | 25% | 8% | 22% |
| Life Sciences | 4% | 0% | 0% | 25% | 19% | 8% | 5% | 11% |
| Internet/Digital Media | 9% | 8% | 9% | 0% | 10% | 4% | 6% | 8% |
| Other | 7% | 7% | 0% | 6% | 31% | 20% | 0% | 10% |
| Total all Industries | 6% | 7% | 5% | 14% | 15% | 12% | 5% | 10% |
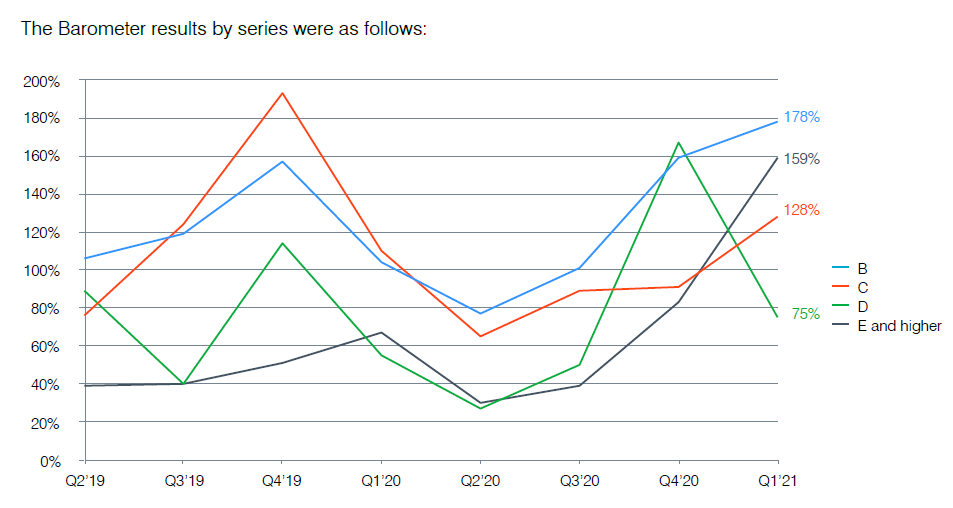
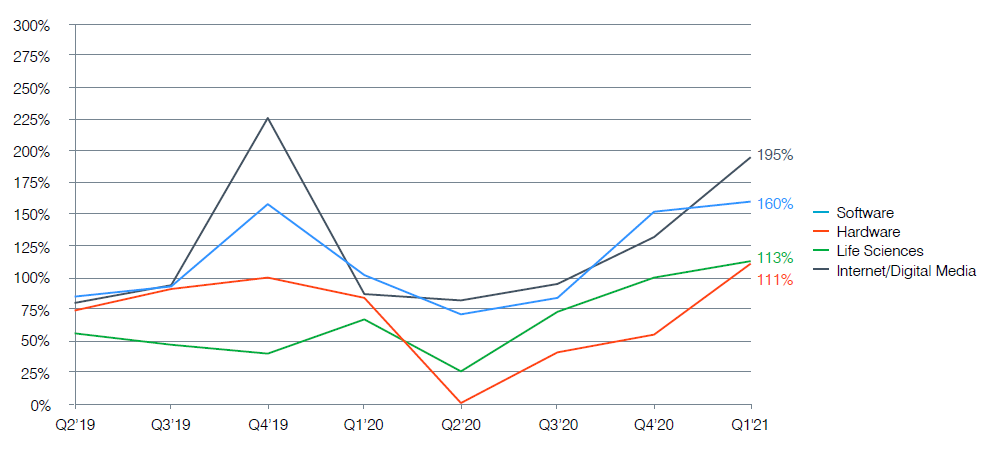
Barometer Results By Industry — The table below sets forth Barometer results by industry group for each of the last eight quarters.
| Industry | Q2’19 | Q3’19 | Q4’19 | Q1’20 | Q2’20 | Q3’20 | Q4’20 | Q1’21 |
|---|---|---|---|---|---|---|---|---|
| Software | 85% | 93% | 158% | 102% | 71% | 84% | 152% | 160% |
| Hardware | 74% | 91% | 100% | 84% | 1% | 41% | 55% | 111% |
| Life Sciences | 56% | 47% | 40% | 67% | 26% | 73% | 100% | 113% |
| Internet/Digital Media | 80% | 94% | 226% | 87% | 82% | 95% | 132% | 195% |
| Other | 67% | 93% | 109% | 115% | 22% | 45% | 86% | 115% |
| Total all Industries | 77% | 88% | 142% | 93% | 51% | 76% | 125% | 145% |
A graphical representation of the above data is below.
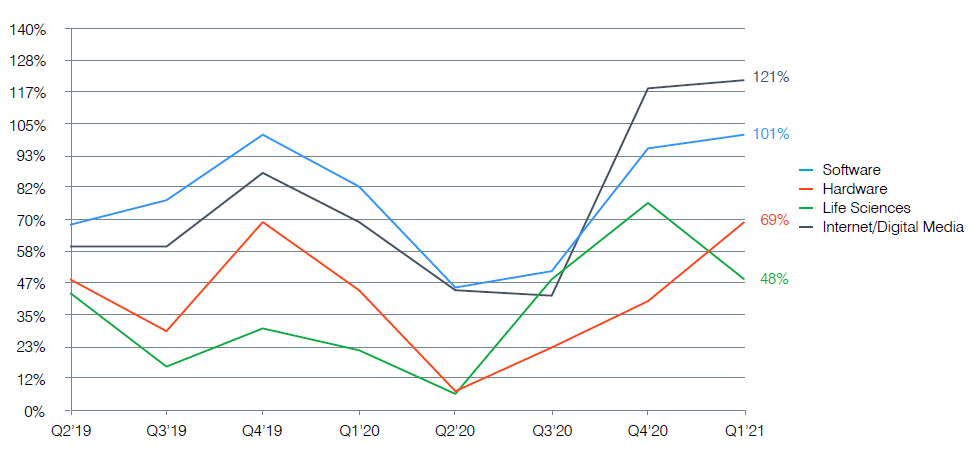
Median Percentage Price Change Results By Industry — The table below illustrates the median percentage price change results by industry group for each of the last eight quarters. Please note that this is different than the Barometer, which is based on average percentage price change.
| Median % Price Change | Q2’19 | Q3’19 | Q4’19 | Q1’20 | Q2’20 | Q3’20 | Q4’20 | Q1’21 |
|---|---|---|---|---|---|---|---|---|
| Software | 68% | 77% | 101% | 82% | 45% | 51% | 96% | 101% |
| Hardware | 48% | 29% | 69% | 44% | 7% | 23% | 40% | 69% |
| Life Sciences | 43% | 16% | 30% | 22% | 6% | 48% | 76% | 48% |
| Internet/Digital Media | 60% | 60% | 87% | 69% | 44% | 42% | 118% | 121% |
| Other | 60% | 29% | 114% | 68% | 5% | 2% | 39% | 110% |
| Total all Industries | 58% | 54% | 76% | 54% | 26% | 42% | 83% | 90% |
A graphical representation of the above data is below.
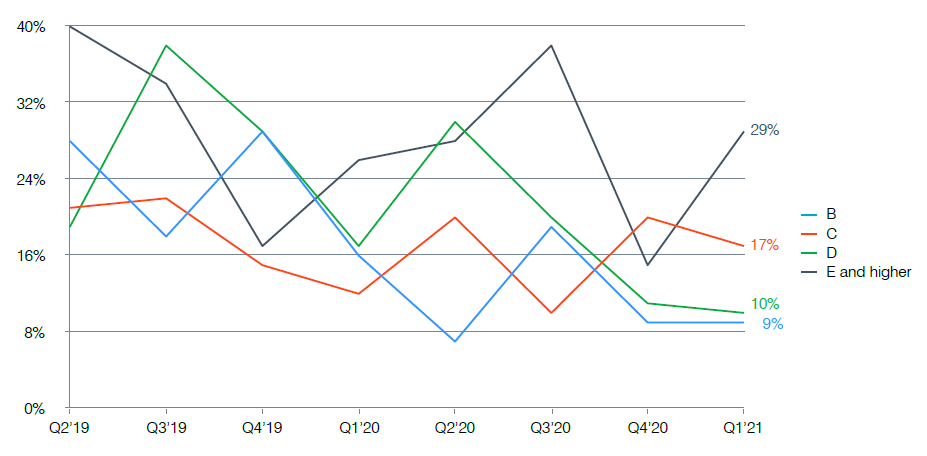
Financing Round— This quarter’s financings broken down by series were as follows:
| Series | Q2’19 | Q3’19 | Q4’19 | Q1’20 | Q2’20 | Q3’20 | Q4’20 | Q1’21 |
|---|---|---|---|---|---|---|---|---|
| Series A | 26% | 35% | 39% | 40% | 22% | 28% | 27% | 30% |
| Series B | 25% | 21% | 22% | 24% | 21% | 26% | 25% | 27% |
| Series C | 22% | 17% | 18% | 17% | 20% | 19% | 22% | 16% |
| Series D | 7% | 8% | 11% | 8% | 15% | 9% | 12% | 12% |
| Series E and Higher | 20% | 19% | 10% | 11% | 23% | 18% | 14% | 16% |
Fenwick Data on Legal Terms
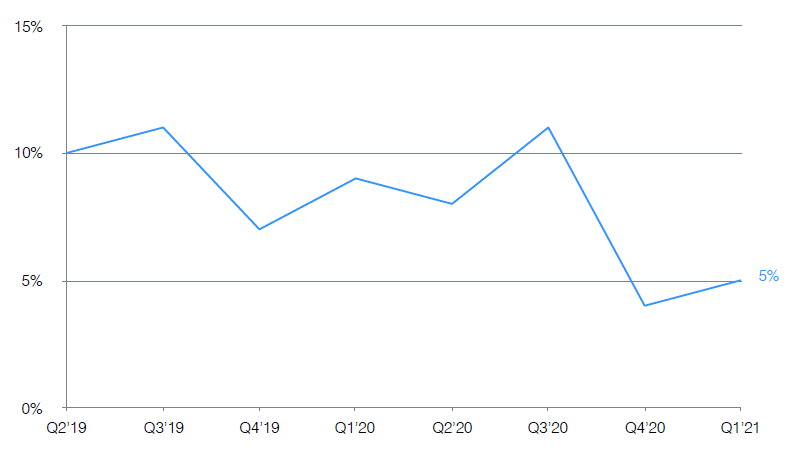
Liquidation Preference — Senior liquidation preferences were used in the following percentages of financings.
The percentage of senior liquidation preference by series was as follows:
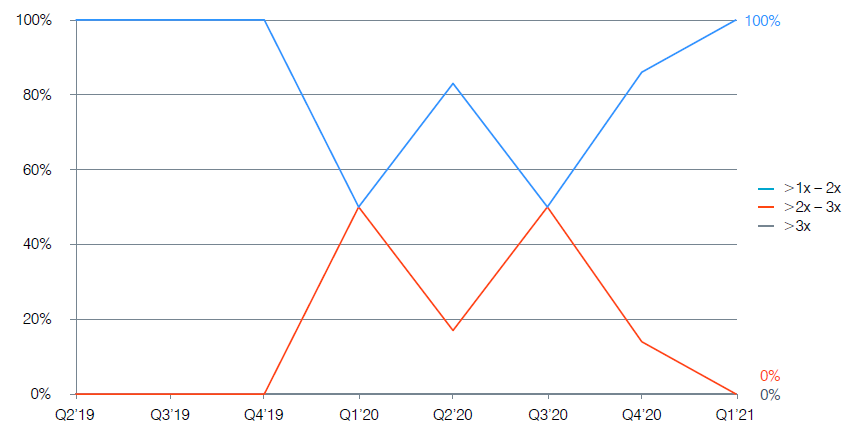
Multiple Liquidation Preferences— The percentage of senior liquidation preferences that were multiple liquidation preferences was as follows:

Of the senior liquidation preferences that were multiple preferences, the ranges of the multiples:
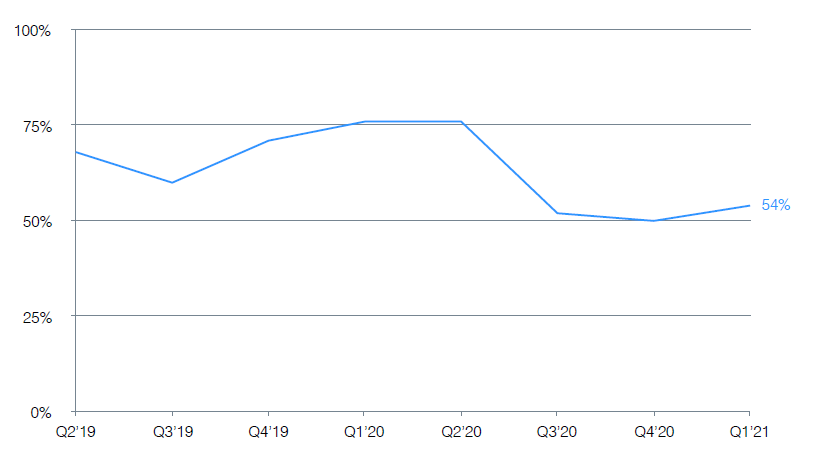
Participation In Liquidation — The percentages of financings that provided for participation were as follows:
Of the financings that had participation, the percentages that were not capped were as follows:
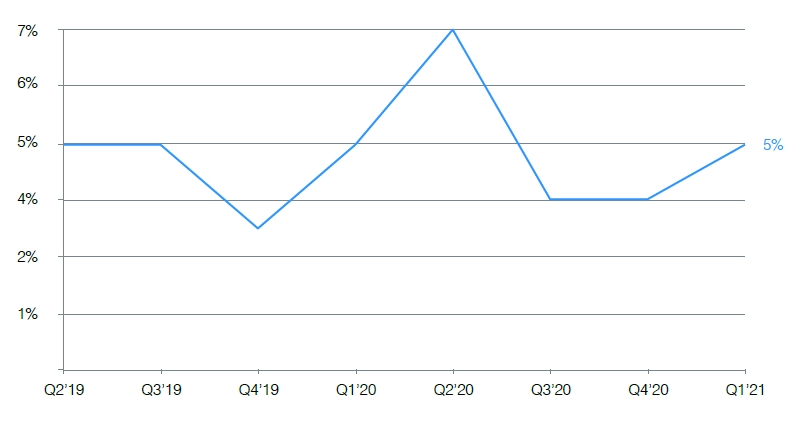
Cumulative Dividends – Cumulative dividends were provided for in the following percentages of financings:
Antidilution Provisions –The uses of (non-IPO) antidilution provisions in the financings were as follows:
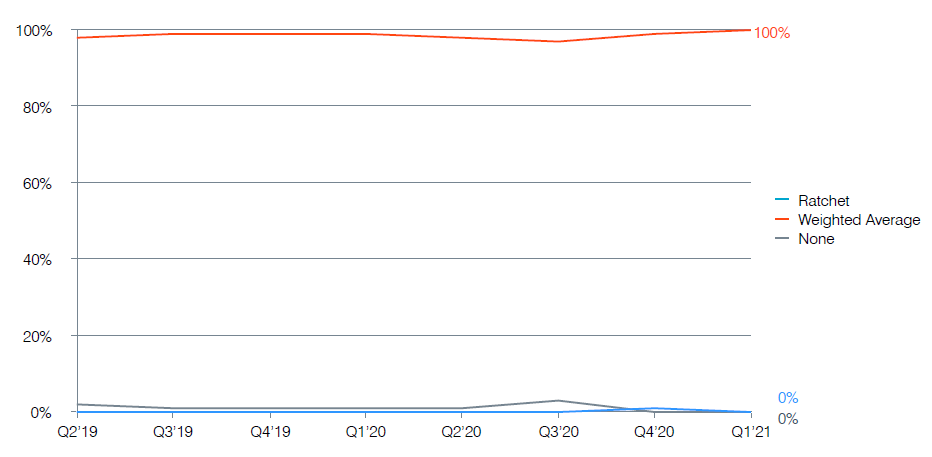
Please note that the chart above only applies to non-IPO antidilution provisions. In other words, the chart refers to antidilution provisions that protect the investor against a future venture financing at a price below what the investor paid. The chart does not include antidilution provisions designed to protect against an IPO at a price below the price paid by the venture investor (e.g., an IPO ratchet).
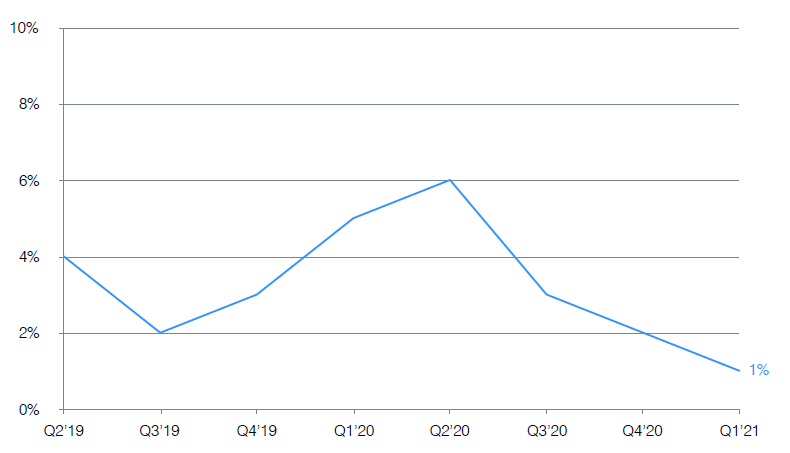
Pay-to-Play Provisions – The percentages of financings having pay-to-play provisions were as
follows:
Redemption– The percentages of financings providing for mandatory redemption or redemption at the option of the investor were as follows:
Corporate Reorganizations– The percentages of post-Series A financings involving a corporate reorganization (i.e. reverse splits or conversion of shares into another series or classes of shares) were as follows:
Dual-Class Common Stock– The percentages of financings with dual-class common stock structures, where there is one class of common stock with more votes per share than the other class, were as follows:

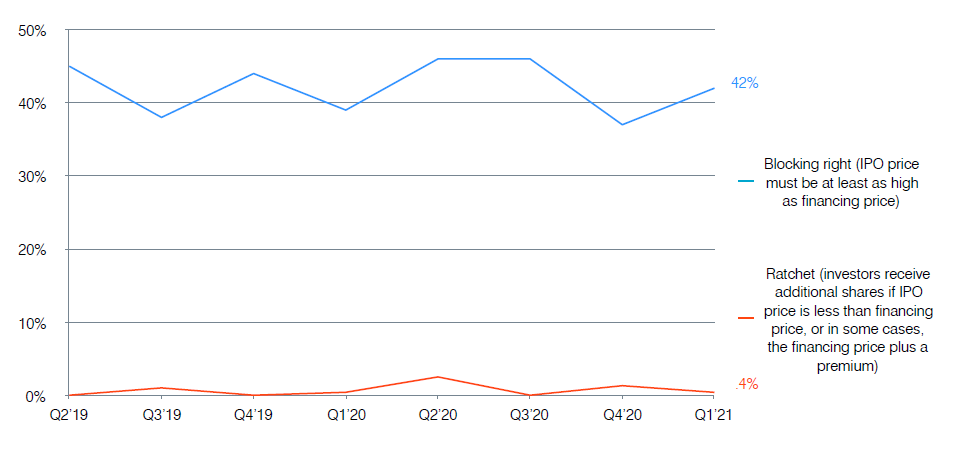
IPO Downside Protections – The percentages of financings with IPO downside protections were as follows: