 Print
PrintMatteo Tonello is Managing Director of ESG Research at The Conference Board, Inc., Jason D. Schloetzer is Associate Professor of Business Administration at the McDonough School of Business at Georgetown University, and Francine McKenna is an independent journalist and Adjunct Professor of international business in the MBA program at American University’s Kogod School of Business. This post is based on CEO Succession Practices in the Russell 3000 and S&P 500: 2021 Edition, published by The Conference Board, Heidrick & Struggles, and ESGAUGE.
CEO Succession Practices in the Russell 3000 and S&P 500: 2021 Edition reviews succession event announcements about chief executive officers made at Russell 3000 and S&P 500 companies in 2020 and, for the S&P 500, the previous 19 years. The project is a collaboration among The Conference Board, executive search firm Heidrick & Struggles, and ESG data analytics firm ESGAUGE.
Data from CEO Succession Practices in the Russell 3000 and S&P 500: 2021 Edition can be accessed and visualized through an interactive online dashboard. The dashboard is organized into five parts.
Part I: CEO Succession Rates illustrates year-by-year succession rates and examines the effects on those rates of firm performance and CEO age—two critical determinants of top leadership changes. The section also includes details on forced versus voluntary CEO successions.
Part II: CEO Profile provides demographic statistics on CEOs currently serving in the Russell 3000 and S&P 500 indexes—including their age, age diversity, gender, tenure, and tenure diversity.
Part III: Departing CEOs and Part IV: Incoming CEOs are similarly structured, with the demographic profile of departing and incoming CEOs, the balance between incoming and departing female CEOs, and a review of the reasons (where stated) for CEO departures.
Part V: Placement Type and Other Practices complements the information of the previous sections with data on CEO placement type (whether an inside promotion or an outside hire), the tenure-in-company of inside CEO appointments, the inside appointment of “seasoned executives” who have been with the company for 20 years or longer, and the appointments as CEO of non-executive directors. The section ends with data on other succession practices, such as the joint election of incoming CEOs as board chairs, the choice of interim CEOs during phases of leadership transition, and the quarterly distribution of CEO succession announcement and effectiveness dates.
Throughout the five parts of the dashboard, data are segmented by business industry and company size. The industry analysis aggregates companies within 11 groups, using the applicable Global Industry Classification Standard (GICS). For the company-size breakdown, data are categorized along with seven annual-revenue groups (for manufacturing and nonfinancial services companies) and seven asset-value groups (based on data reported by financial and real estate companies, which tend to use this type of benchmarking). Annual revenue and asset values are measured in US dollars.
Drawn from such a review, the following are the key findings and insights.
CEO turnover rate during the COVID-19 pandemic started low but finished 2020 in line with earlier records. Despite an initial dip, the number of transition announcements picked up in the second half of 2020. Some CEOs attributed the decision to leave to their burnout after a tumultuous and exhausting year of crisis management.
In the previous edition of this report, we provided a preliminary assessment of the impact of the COVID-19 crisis on top leadership changes by complementing the 2019 CEO turnover review with data on succession announcements made in the first six months of 2020. [1] According to that analysis, only 71 Russell 3000 index companies had announced CEO changes in the first six months of 2020, a rate that was 11 percent lower than the average turnover level recorded in the two prior years. In that publication, we also projected that, had the pace of announcements stayed at the same level for the remainder of the year, the annual Russell 3000 CEO succession rate for all of 2020 would be 7.8 percent—or 32.8 percent lower than the average annual rate of 11.6 percent reported for the 2018–2019 biennial period.
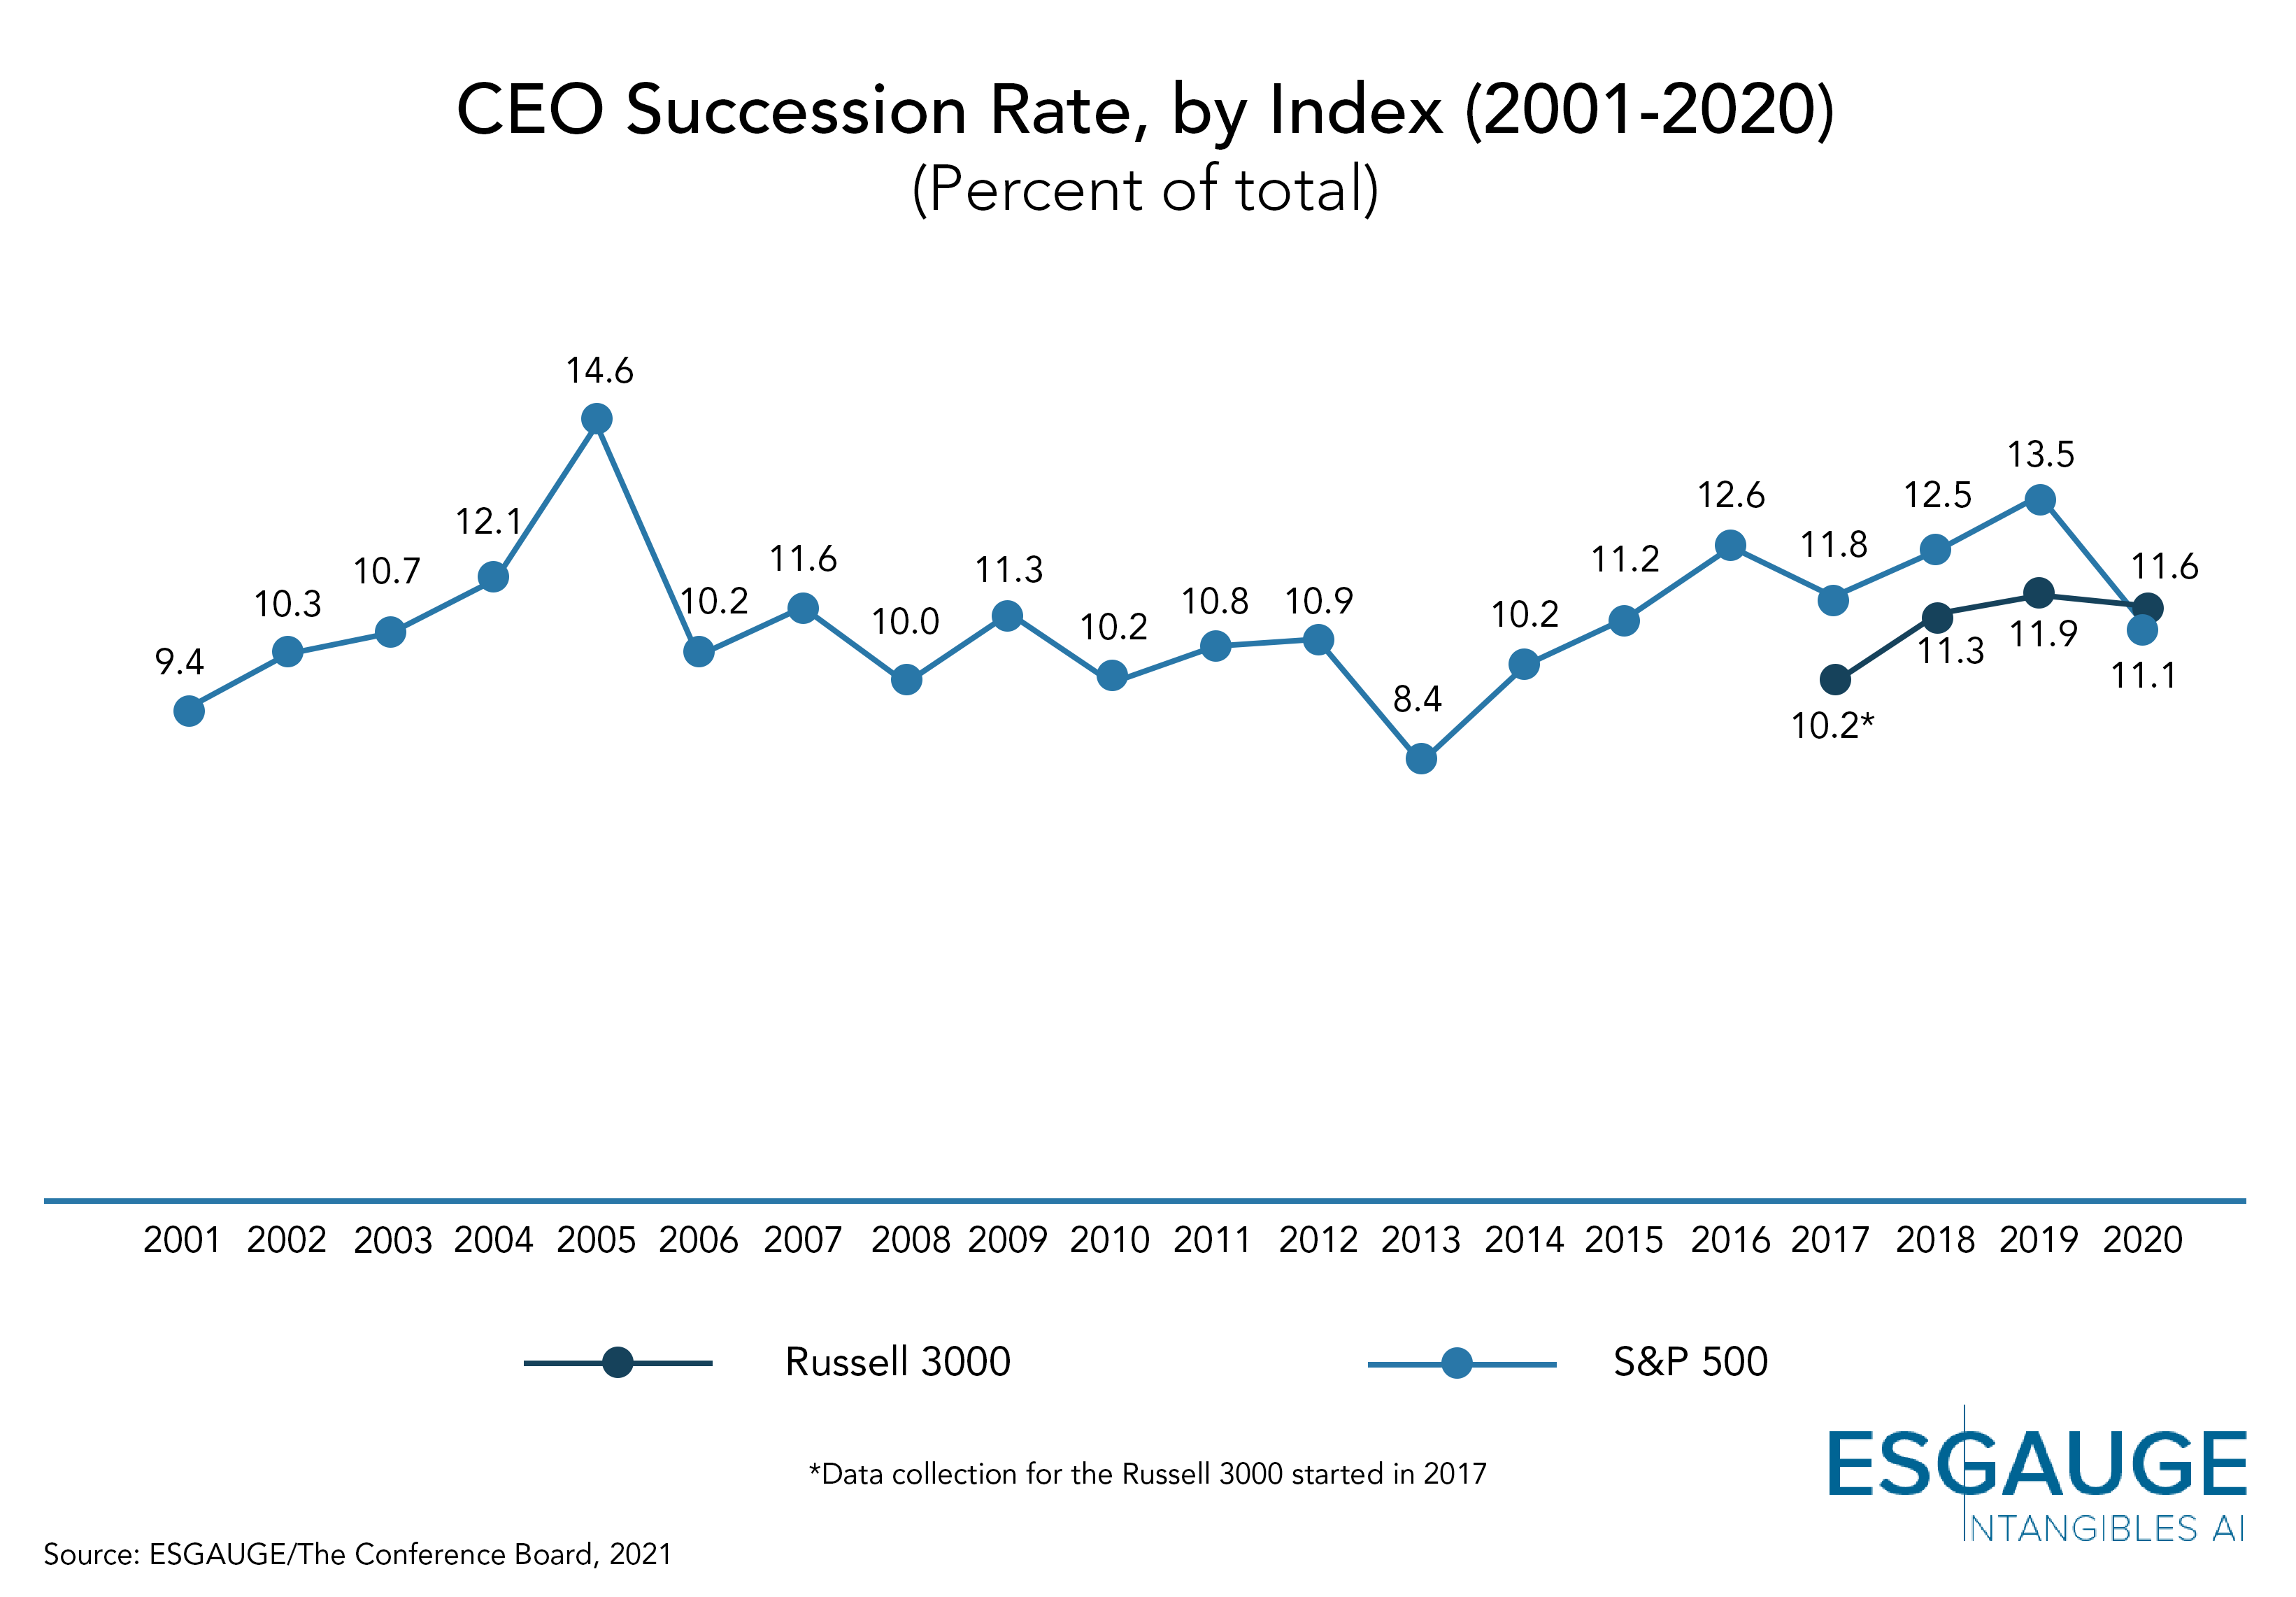
However, in the last half of 2020, CEO succession activity picked up significantly. For companies in the Russell 3000, the yearly succession rate has been relatively flat as far back as our data go. In 2020, the average rate of CEO succession was 11.6 percent versus 11.9 percent in 2019. The average CEO succession rate for Russell 3000 companies was 11.3 percent for the 2017-2020 period. The findings are quite similar in the S&P 500 index, where the 2020 CEO succession rate was 11.1 percent—only slightly lower than the average rate of succession for the most recent five-year period (12.3 percent in the 2016-2020 years), but a slight increase from the average for the prior fifteen-year period (10.8 percent in the 2001-2015 years).
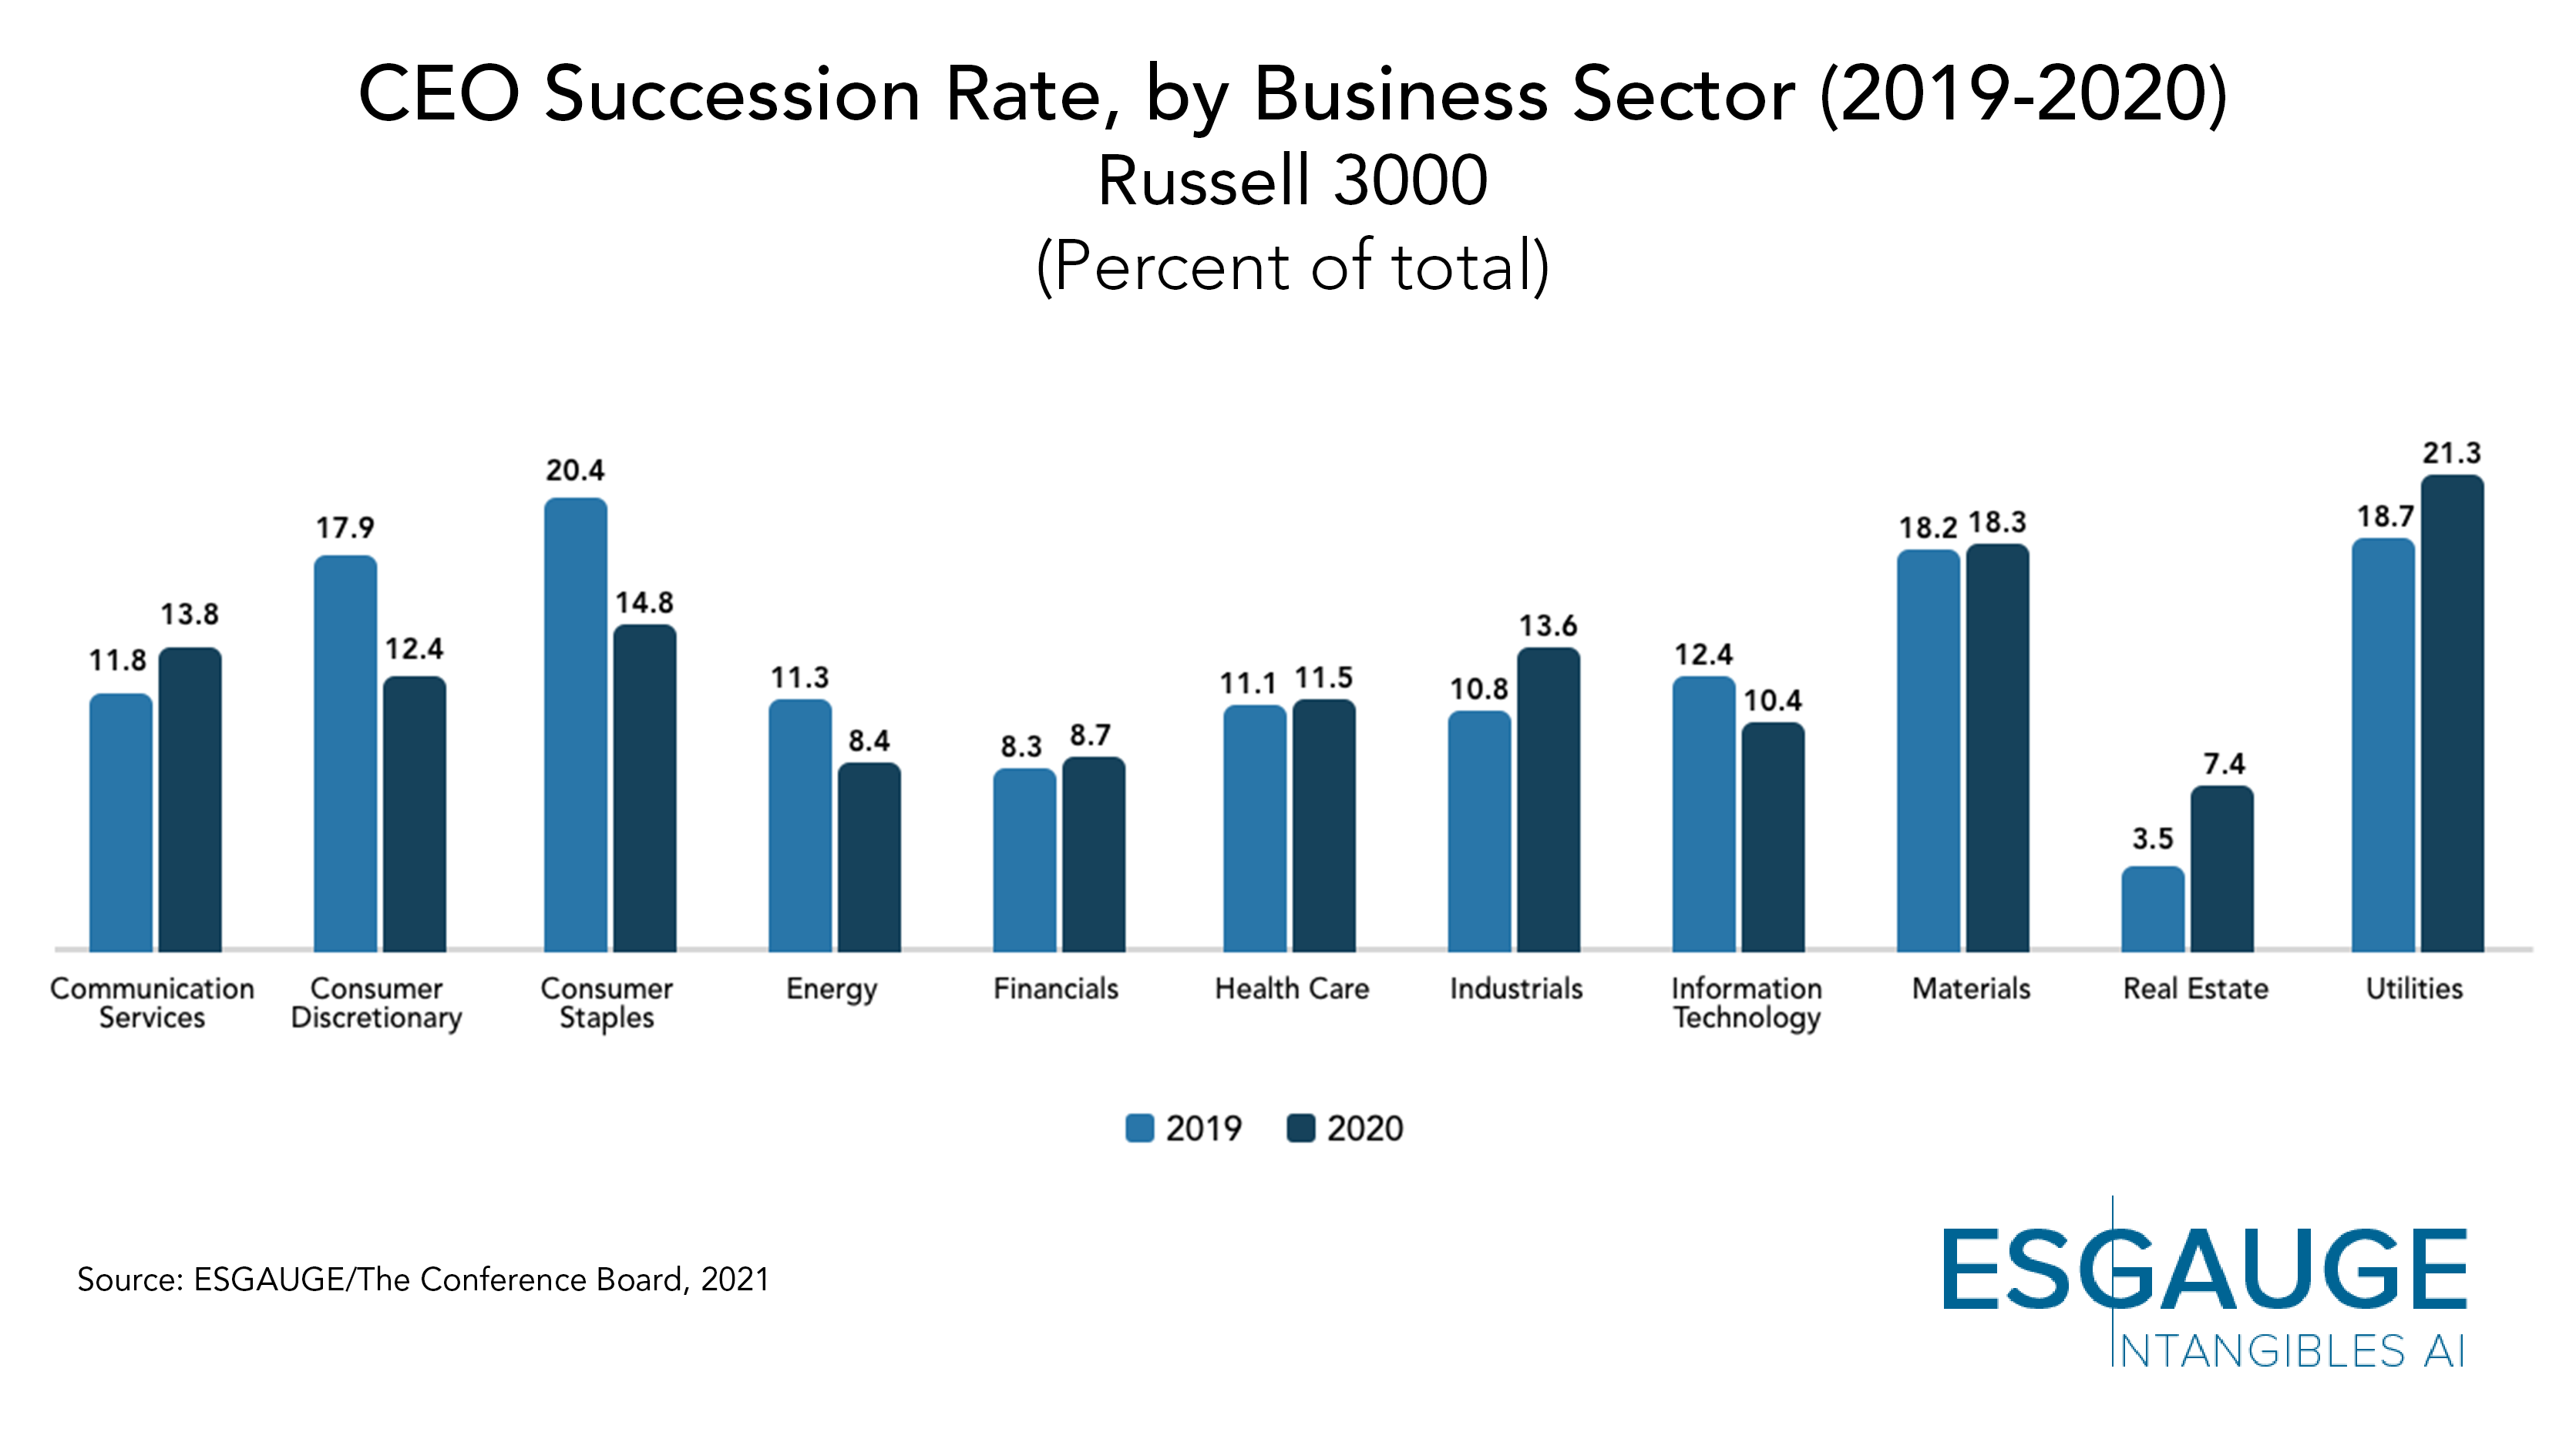
According to the analysis by business sector, the highest rate of CEO succession in the Russell 3000 was seen among Utilities (21.3 percent, up from 18.7 percent in 2019), while the Real Estate sector recorded the lowest (7.4 percent, up from 3.5 percent in 2020).
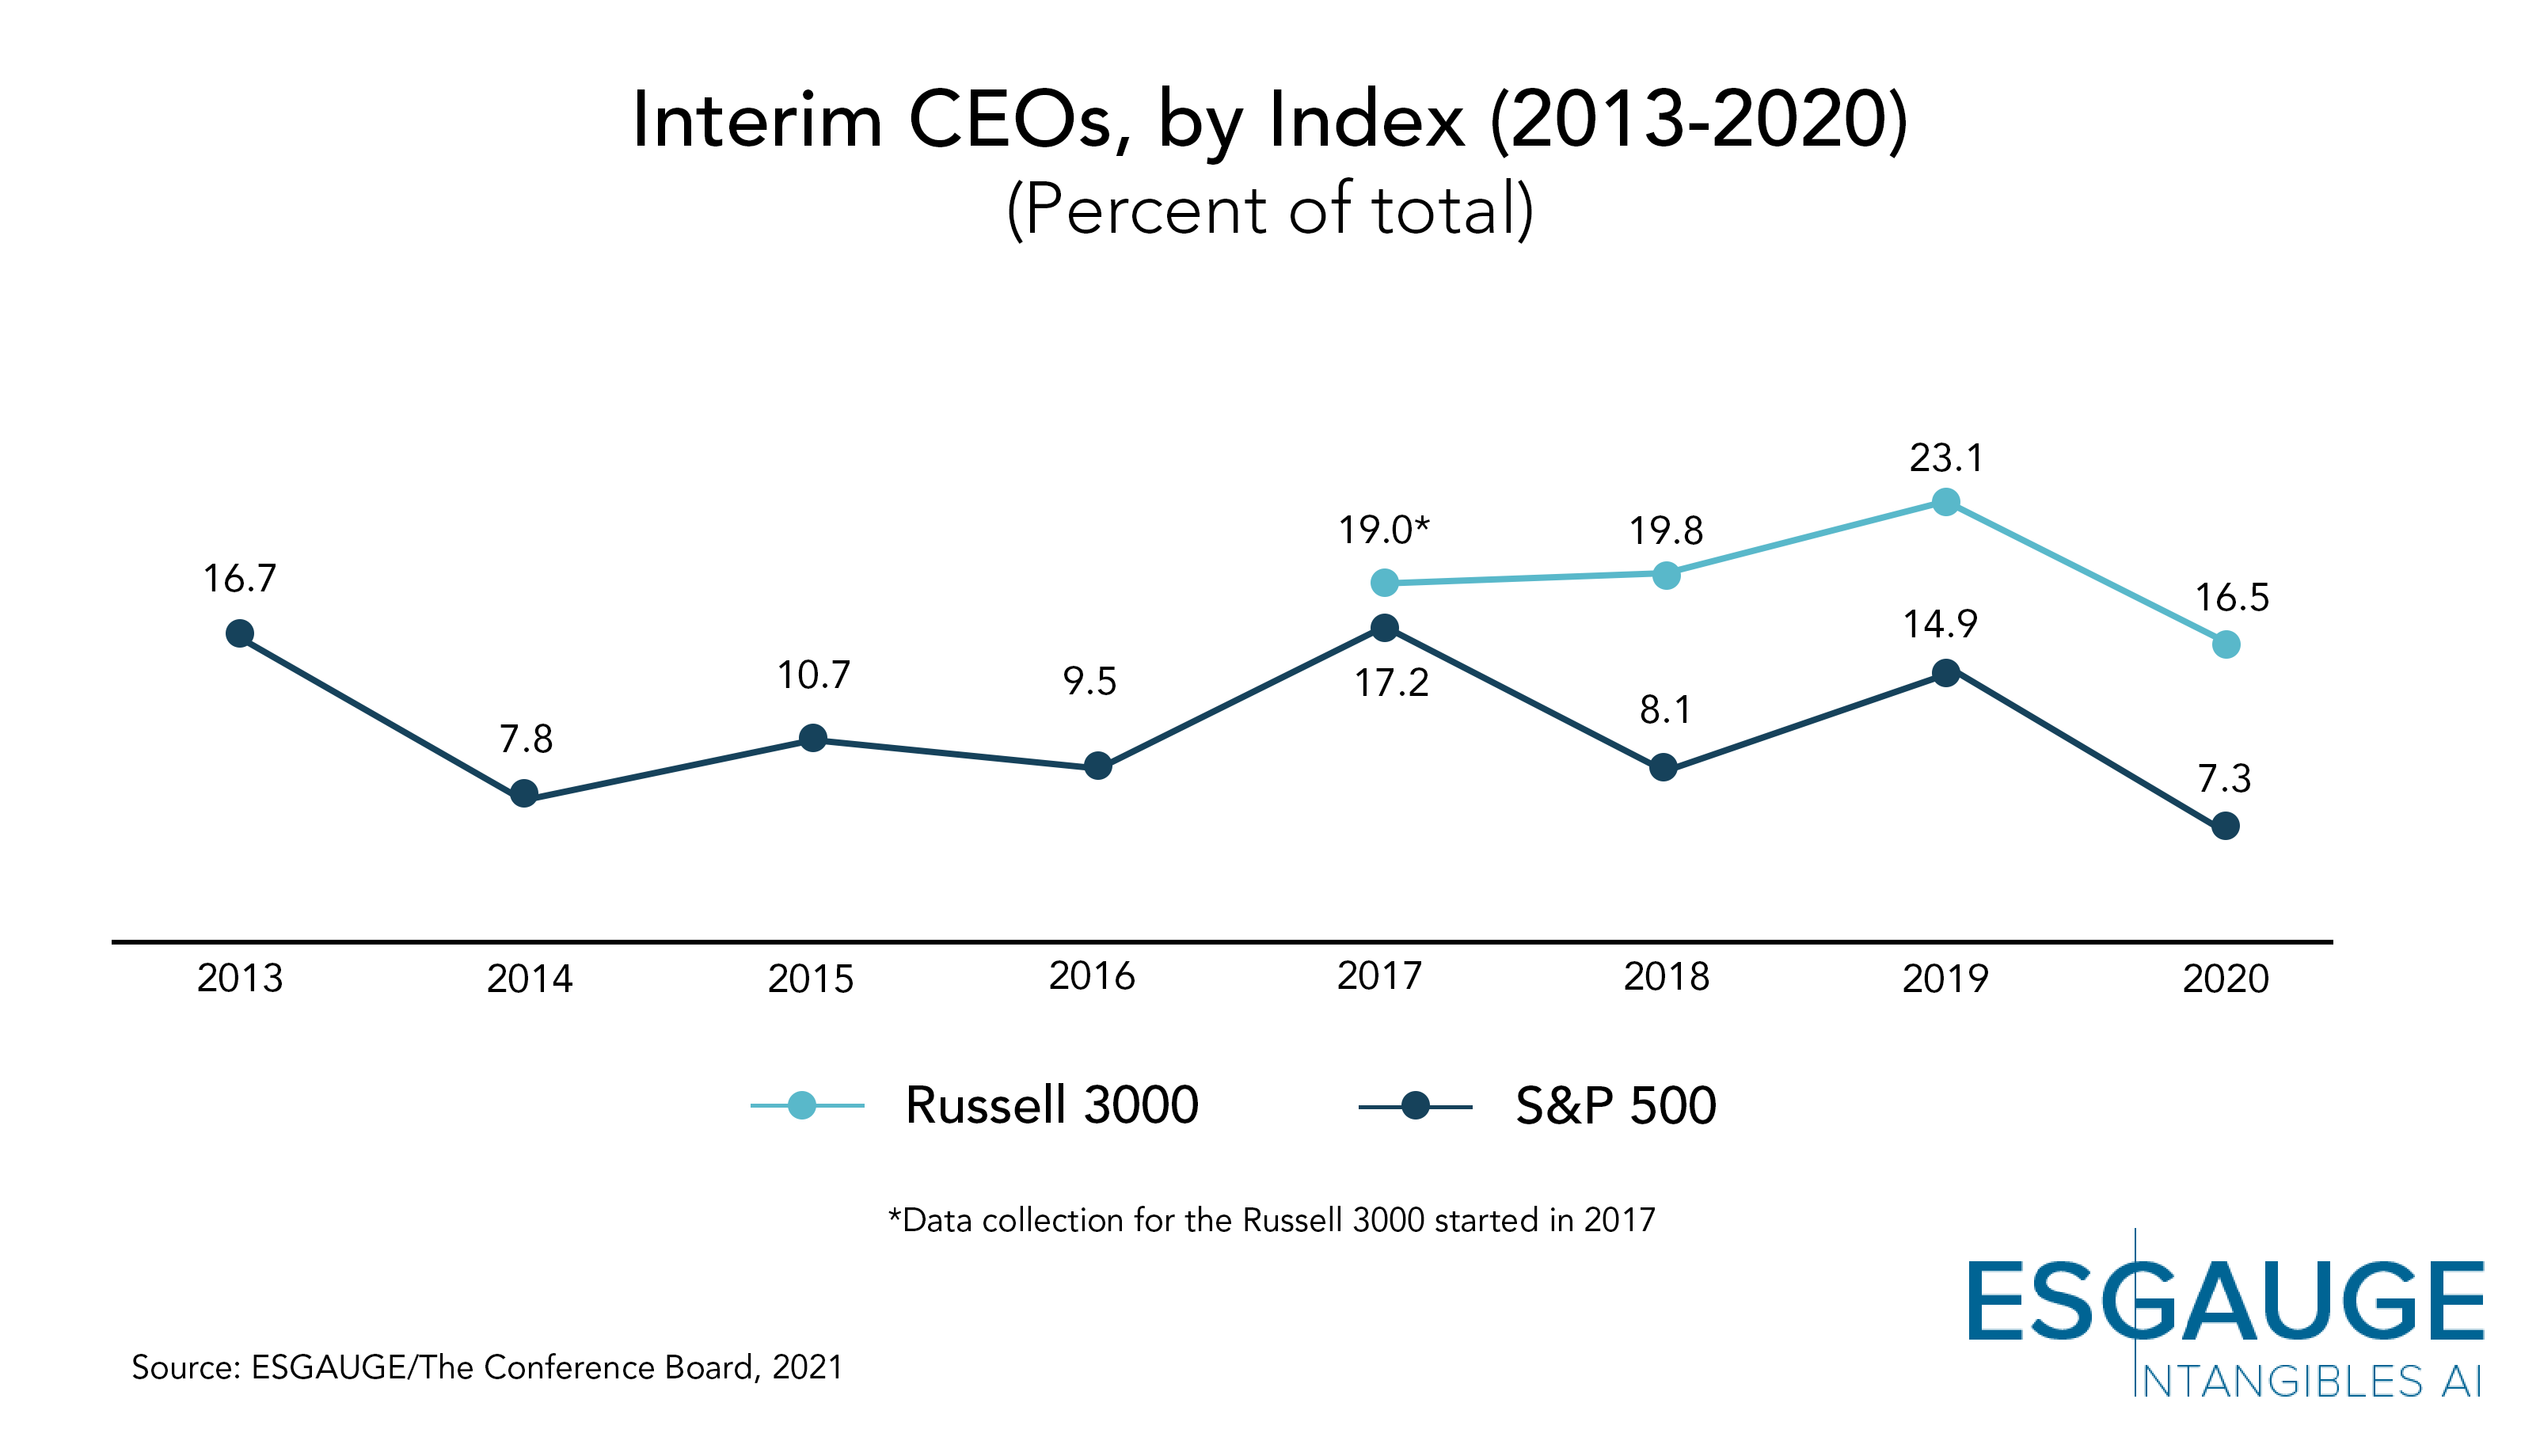
In December 2020, we also reported that the rate of interim CEO appointments for the first half of 2020 was 18.1 percent, down more than three percentage points from the average annual rate for 2018 and 2019 of 21.4 percent. That downward trend continued through the end of 2020. For the full year, only 16.5 percent of incoming CEOs were appointed on an interim basis. That rate is much lower than the 23.1 percent rate recorded in 2019 and lower than any of the rates reported during the 2017-2019 period. In the S&P 500, 7.3 percent of incoming CEOs in 2020 were appointed as interims—half the rate reported in 2019 (14.9 percent) and down from any of the rates reported in the 2013-2019 period.
What’s ahead? The COVID-19 pandemic and its impact on lives and livelihoods have driven an unprecedented public policy and fiscal response for more than a year. Since the first lockdown measures were implemented in the United States in the first quarter of 2020, boards and top management teams across the Russell 3000 have been working to mitigate the impact of the crisis. New worries about their employees’ health and well-being, the reliability of supply chains, the predictability of their customers’ behavior, and their companies’ financial viability took precedence over non-emergency actions.
CEO succession is one of the most significant events companies face, and potentially one of the most disruptive. The CEO sets the tone at the top on strategy, organizational culture, and the company’s relationship with all stakeholders, not just investors. So, when the COVID-19 crisis unexpectedly upended day-to-day life in the United States beginning in mid-March 2020, it was not surprising that companies chose to leave the same generals on the battlefield rather than compounding new, unexpected business risks with the uncertainties of a leadership turnover. Pausing the execution of a succession plan and reevaluating immediate priorities was an understandable choice, given the circumstances.
However, the rebalancing that took place in the second half of the year suggests that, after the initial assessment of the implications of lockdowns and other restrictive measures, most companies concluded that their succession planning process was robust enough to weather the volatile environment. In some cases, the pandemic may have accelerated the decision to implement changes in leadership due to strategic considerations.
To be sure, boards of directors that moved forward with their CEO succession plans opted for permanent replacements rather than interim CEOs. It may be because boards perceived investors and markets would respond positively to decisiveness during a period of uncertainty rather than a temporary solution. When all stakeholders are trying to eliminate as much uncertainty as possible, a permanent selection signals leadership continuity that increases the probability the company will make it through to the other side of the pandemic.
As it steers the company toward the post-COVID economy, the board of directors should continue to test the effectiveness of its succession planning process and strengthen leadership development. While it is common for companies to have succession plans and leadership development programs in place, it remains important to continue to ascertain that such tools work. Are the graduates of leadership development programs staying with the company or leaving? And, if they remain, are they succeeding in their new roles? Is the board genuinely comfortable that the potential internal successors to the CEO are the right ones? And how is each of them performing against their development plans to be ready to assume the top management role? There are numerous indications that the job market for top talent will become even more competitive in the expansionary phase that is expected to follow the massive injection of public capital in the economy approved by the US Congress. [2] There is also evidence of CEOs and other senior leaders who recently lamented a crisis-management burnout and announced their decision to move on. [3]
In particular, the board should consider:
- To reevaluate the company’s strategic needs during the recovery and expansionary phase that many analysts have been predicting. Since those needs might have changed from just a few months ago, directors may want to take a fresh look at the job description of the CEO to ensure it remains up to date—both accurate and complete.
- Similarly, to review the shortlist of candidates who meet the updated job requirements to ensure that, for any critical roles in the C-Suite, a successor or interim successor is ready to step in without any material loss of continuity in organizational leadership. There needs to be a pipeline of candidates at various stages in their careers, with a development plan for each that intends to intersect with the end of the planned tenure of the current CEO. Boards should conduct periodic executive preparedness assessments to gauge whether those individuals remain fit for the redesigned chief executive role. The board should also discuss: what weight to attribute to factors such as their performance during the pandemic; the new skills they may have demonstrated while operating in different circumstances or facing new challenges; and their ability to balance ever-expanding professional commitments with the need to attend to the safety and well-being of their teams and family.
- Whether the new strategy suggests the need to strengthen and adapt the company’s leadership development programs. Earlier editions of this study have discussed several tools the board may use to do so—including CEO auditioning (where an outside candidate is not placed directly into the CEO slot but is first trained and tested by the board through special tasks and stretch assignments), CEO apprenticeship (the period of time preceding the official succession announcement in which a CEO candidate works closely with the CEO on several strategic and highly visible tasks), the use of leadership coaches from outside providers, the mentoring of senior executives by board members, and the attendance of executive education courses. [4]
- Whether the opportunities that will arise in the new economic environment should warrant the search for outside talent. Executing a new strategy, in particular, may require a new set of skills and qualifications or the in-depth knowledge of a product market in which the company had not operated before. In the past, the board might have excluded the prospect of hiring a CEO successor rather than promoting an internal candidate. But changing economic scenarios and new strategic options may prompt the need to revisit this approach—or at least to reopen that old discussion.
For the first time in almost 20 years, the gap between the succession rates of better-performing and worse-performing companies narrowed sharply in 2020. It may signal that, while total shareholder return continues to be a key predictor of CEO turnover, when choosing whether to initiate a leadership change boards may also start to consider how senior management fares in the pursuit of extra-financial performance goals.
To investigate what drives leadership change, The Conference Board and ESGAUGE have been tracking the historical correlation between CEO succession rate and companies’ stock performance. Through the years, total shareholder return (TSR) has consistently been one of the most reliable predictors of leadership turnover events. In fact, the annual analysis has repeatedly highlighted meaningful differences in the incidence of successions between poorly performing companies and better performers.
For the purpose of the data calculation and analysis provided in this report, a company’s performance is defined as its two-year TSR minus the two-year TSR of all index companies in the same GICS industry. “Worse-performing companies” are those with an industry-adjusted TSR in the bottom quartile. In contrast, all other companies (i.e., companies with an industry-adjusted TSR in the top-three quartiles) are labeled “better performers.”
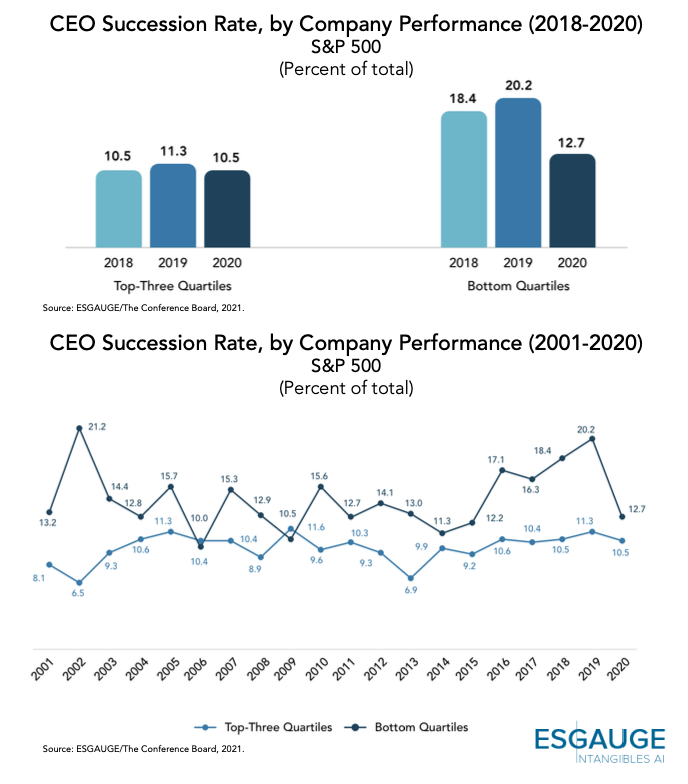
One of the widest gaps between the two groups was reported in 2019, when worse-performing companies in the S&P 500 index sustained a CEO succession rate of 20.2 percent (the highest ever recorded since 2002), compared to only 11.3 percent for better performers. These differences are further accentuated in the business sector analysis. For example, in the same year, as much as 75 percent of Utilities and 40 percent of the Consumer Staples companies in the Russell 3000 that fell in the bottom performance quartile for their industry underwent a leadership change.
For the first time in several years, however, the gap in succession rates narrowed significantly in 2020. In the Russell 3000, the average rate of CEO succession with stock performance in the top three quartiles was 10.2 percent, increasing from 9.4 percent in 2019. By comparison, in the same period, companies in the bottom quartile of TSR performance saw a decline of almost 4 percent, from 19.4 to 15.5 percent. What was a 10-percentage point gap in 2019 narrowed quite drastically to 5.3 percent last year.
A similar phenomenon can be observed among S&P 500 companies. In 2020, the gap in CEO succession rates in the S&P 500 was 2.2 percent (12.7 percent of poorly performing companies minus 10.5 percent of better performers), down from 8.9 percent in 2019—the second steepest decline in the 20-year history of our S&P500 database after 2002-2003 (when the rate gap between the two performance groups had shrunk from 14.7 to 5.1 percent).
In 2020, the business sector analysis shows that Utilities and Energy companies had the most significant succession-rate gaps—a 47.2 percentage-point difference between the succession rates of worse-performing and better-performing Utilities companies and a 43.8 percentage-point difference for Energy companies. The Industrials and Consumer Discretionary industries had the smallest succession-rate gaps—a 1.1 percentage-point difference between the succession rates of worse-performing and better-performing Industrial companies and a 2.7 percentage-point difference for Consumer Discretionary companies. It is also interesting to note that, in 2020, the Communication Services and Consumer Staples industries had higher succession rates among better-performing companies than among worse-performing companies. In the former, in particular, the difference was significant (19.4 percent versus 6.4 percent). This finding reminds us that, while financial underperformance is often a harbinger of change, CEO turnover is also influenced by long-term succession plans and unplanned events (e.g., health issues and cases of incapacitation or death; business combinations and other extraordinary corporate transactions; and diverging strategic viewpoints between the CEO and the board of directors; and cases of misconduct).

The gap between succession rates of better-performing and worse-performing companies in the Russell 3000 varies by company size. Notably, larger companies—Financials and Real Estate companies with at least $50 billion in asset value and all manufacturing and nonfinancial services sectors with at least $25 billion in annual revenue—had higher succession rates among better-performing companies and worse-performing companies in 2020.
What’s ahead? The sharp reduction in the gap between the CEO succession rates of better-performing and worse-performing companies raises the possibility that factors beyond stock market performance are starting to weigh more prominently in the board’s decision to retain a sitting CEO or promote a leadership change.
As The Conference Board has amply documented in recent research, [5] boards of directors, investors, regulators, and corporate governance advocates, among others, are increasingly emphasizing the importance of extra-financial measures of performance. These performance measures can motivate lasting shareholder value creation by nurturing the company’s relationship with other stakeholders (whether employees, customers and suppliers, and local communities where the company operates). In general, the notion of performance is evolving beyond the short-term TSR metrics to account for factors that play a crucial role in the sustainable success of the business—from promoting a diverse, fair, and inclusive workplace to optimizing the use of natural resources, and from protecting employees’ security and well-being to advancing the prosperity of those people whose livelihoods also depend on the natural resources used by the company.
The increasing popularity of a stakeholder-centric model of the business organization brings new conversations in boardrooms throughout the economy. The variety of demands on senior management that extend beyond the focus on quarterly earnings targets is becoming more salient—whether it be taking swift action when uncovering misconduct to protect corporate values and workplace culture, tackling inequities throughout the talent acquisition and development process, or pressing for strategic changes that reduce a company’s impact on the environment.
It would be speculative to predict whether the narrowing of the succession rate gap between worse-performing companies and better performers will continue in 2021 and beyond. To be sure, progress made on extra-financial corporate practices can hardly erase the pressure for corrective actions that boards of directors typically feel when the company faces prolonged lackluster stock performance. Similarly, directors may be reluctant to change a leader who delivers, albeit in the short-term, stellar shareholder return. Whatever the future holds, however, there is little doubt that the notion of business success is expanding to accommodate considerations of sustainability and accountability to multiple stakeholders. [6]
Personal misconduct, including instances of sexual harassment and abuse of power, was the most frequent cause of CEO dismissals in 2020—a clear indication that #MeToo continues to reshape social norms. The board of directors should be at the forefront of these changes, leading by example and taking a hard look at corporate culture.
Of the 18 unplanned CEO successions announced in the Russell 3000 in 2020, 38.9 percent were due to situations of personal misconduct—whether sexual harassment or abuse of power or other types of violation of the company’s code of conduct—that the board of directors considered reasons for termination of the employment relationship. The percentage was much higher than what The Conference Board and ESGAUGE recorded in 2019 (11.1 percent) and more in line with the figures found at the peak of the #MeToo scandals in 2018 (44.8 percent). In the S&P 500, the percentage of cases of dismissal due to personal misconduct equaled the one due to underperformance (33.3 percent).
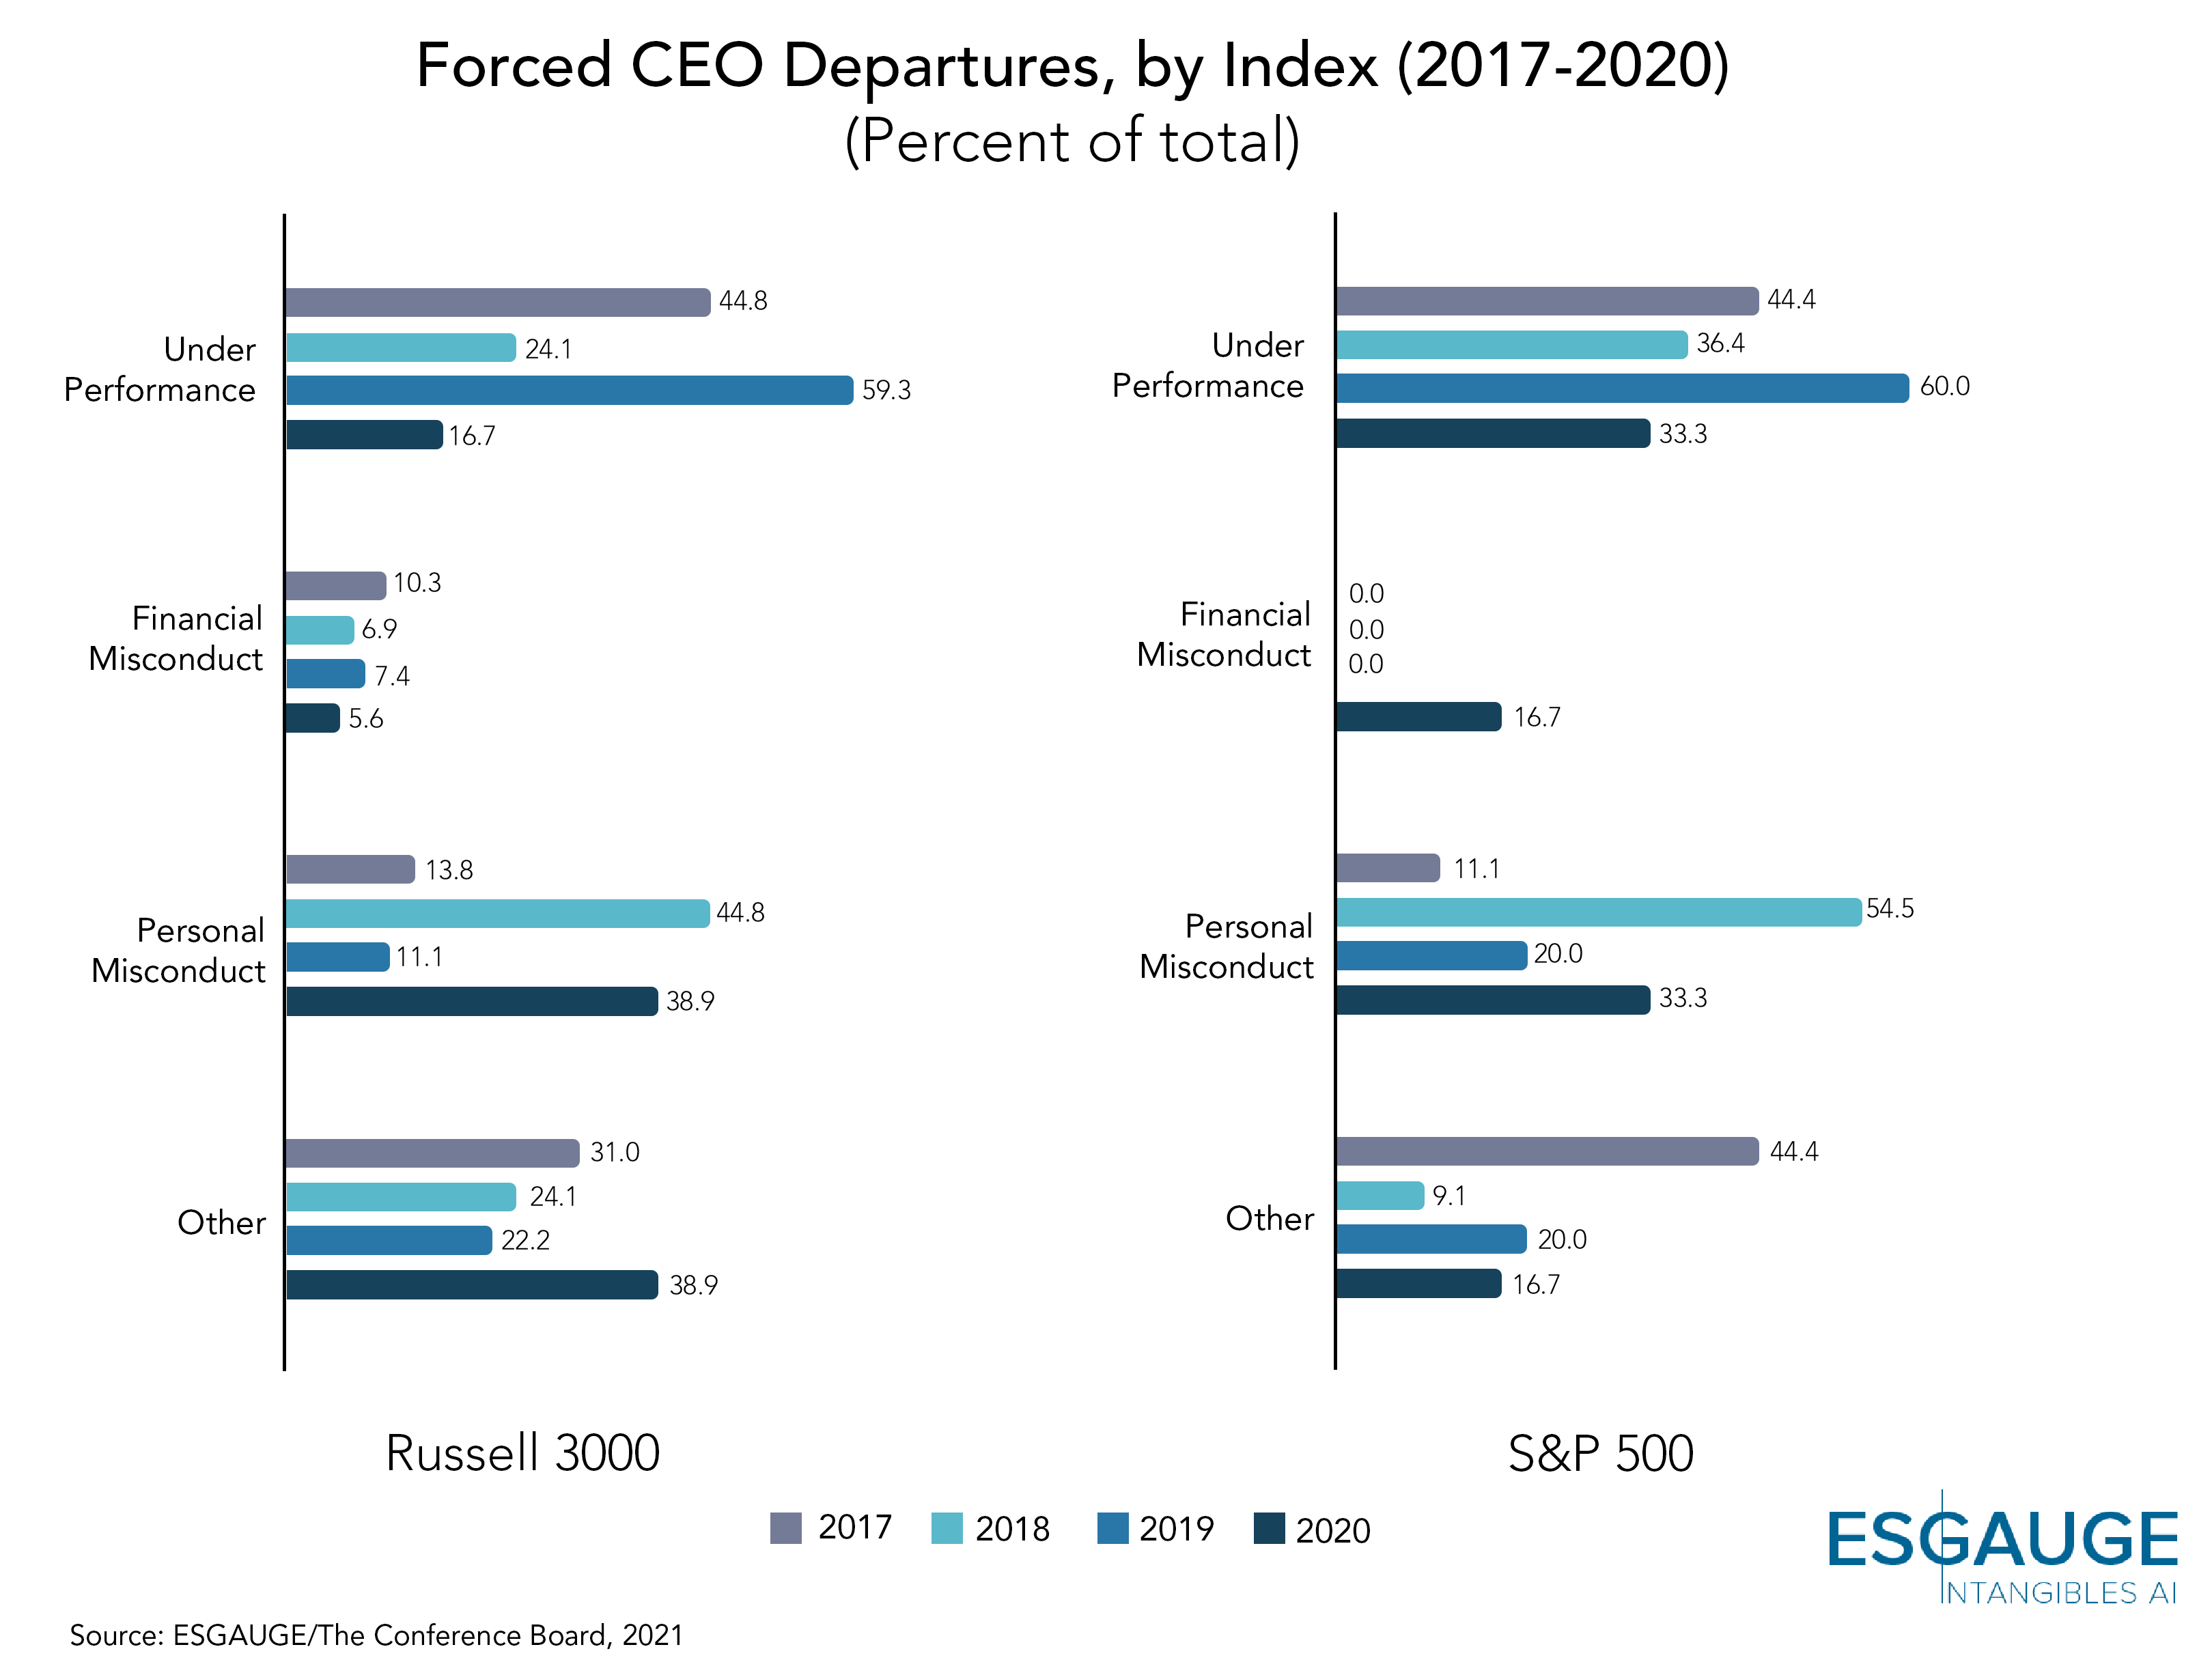
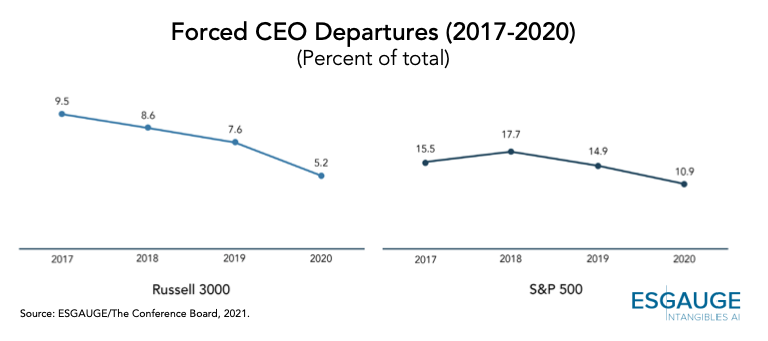
In the study, transitions prompted by the personal misconduct of the departing executives are categorized as “forced” (together with those due to underperformance, financial misconduct, and strategic disagreements between the chief executive and the board of directors). The numbers on personal misconduct are even more remarkable if one considers that the overall rate of forced CEO succession has been declining. In 2020, particularly, the share of forced successions among companies in the Russell 3000 was 5.2 percent, down from the 7.6 percent and 8.6 percent reported in 2019 and 2018, respectively. For S&P 500 companies, the percentage of forced successions declined to 10.9 from the 14.9 reported in 2019 and was the lowest of the last four years.
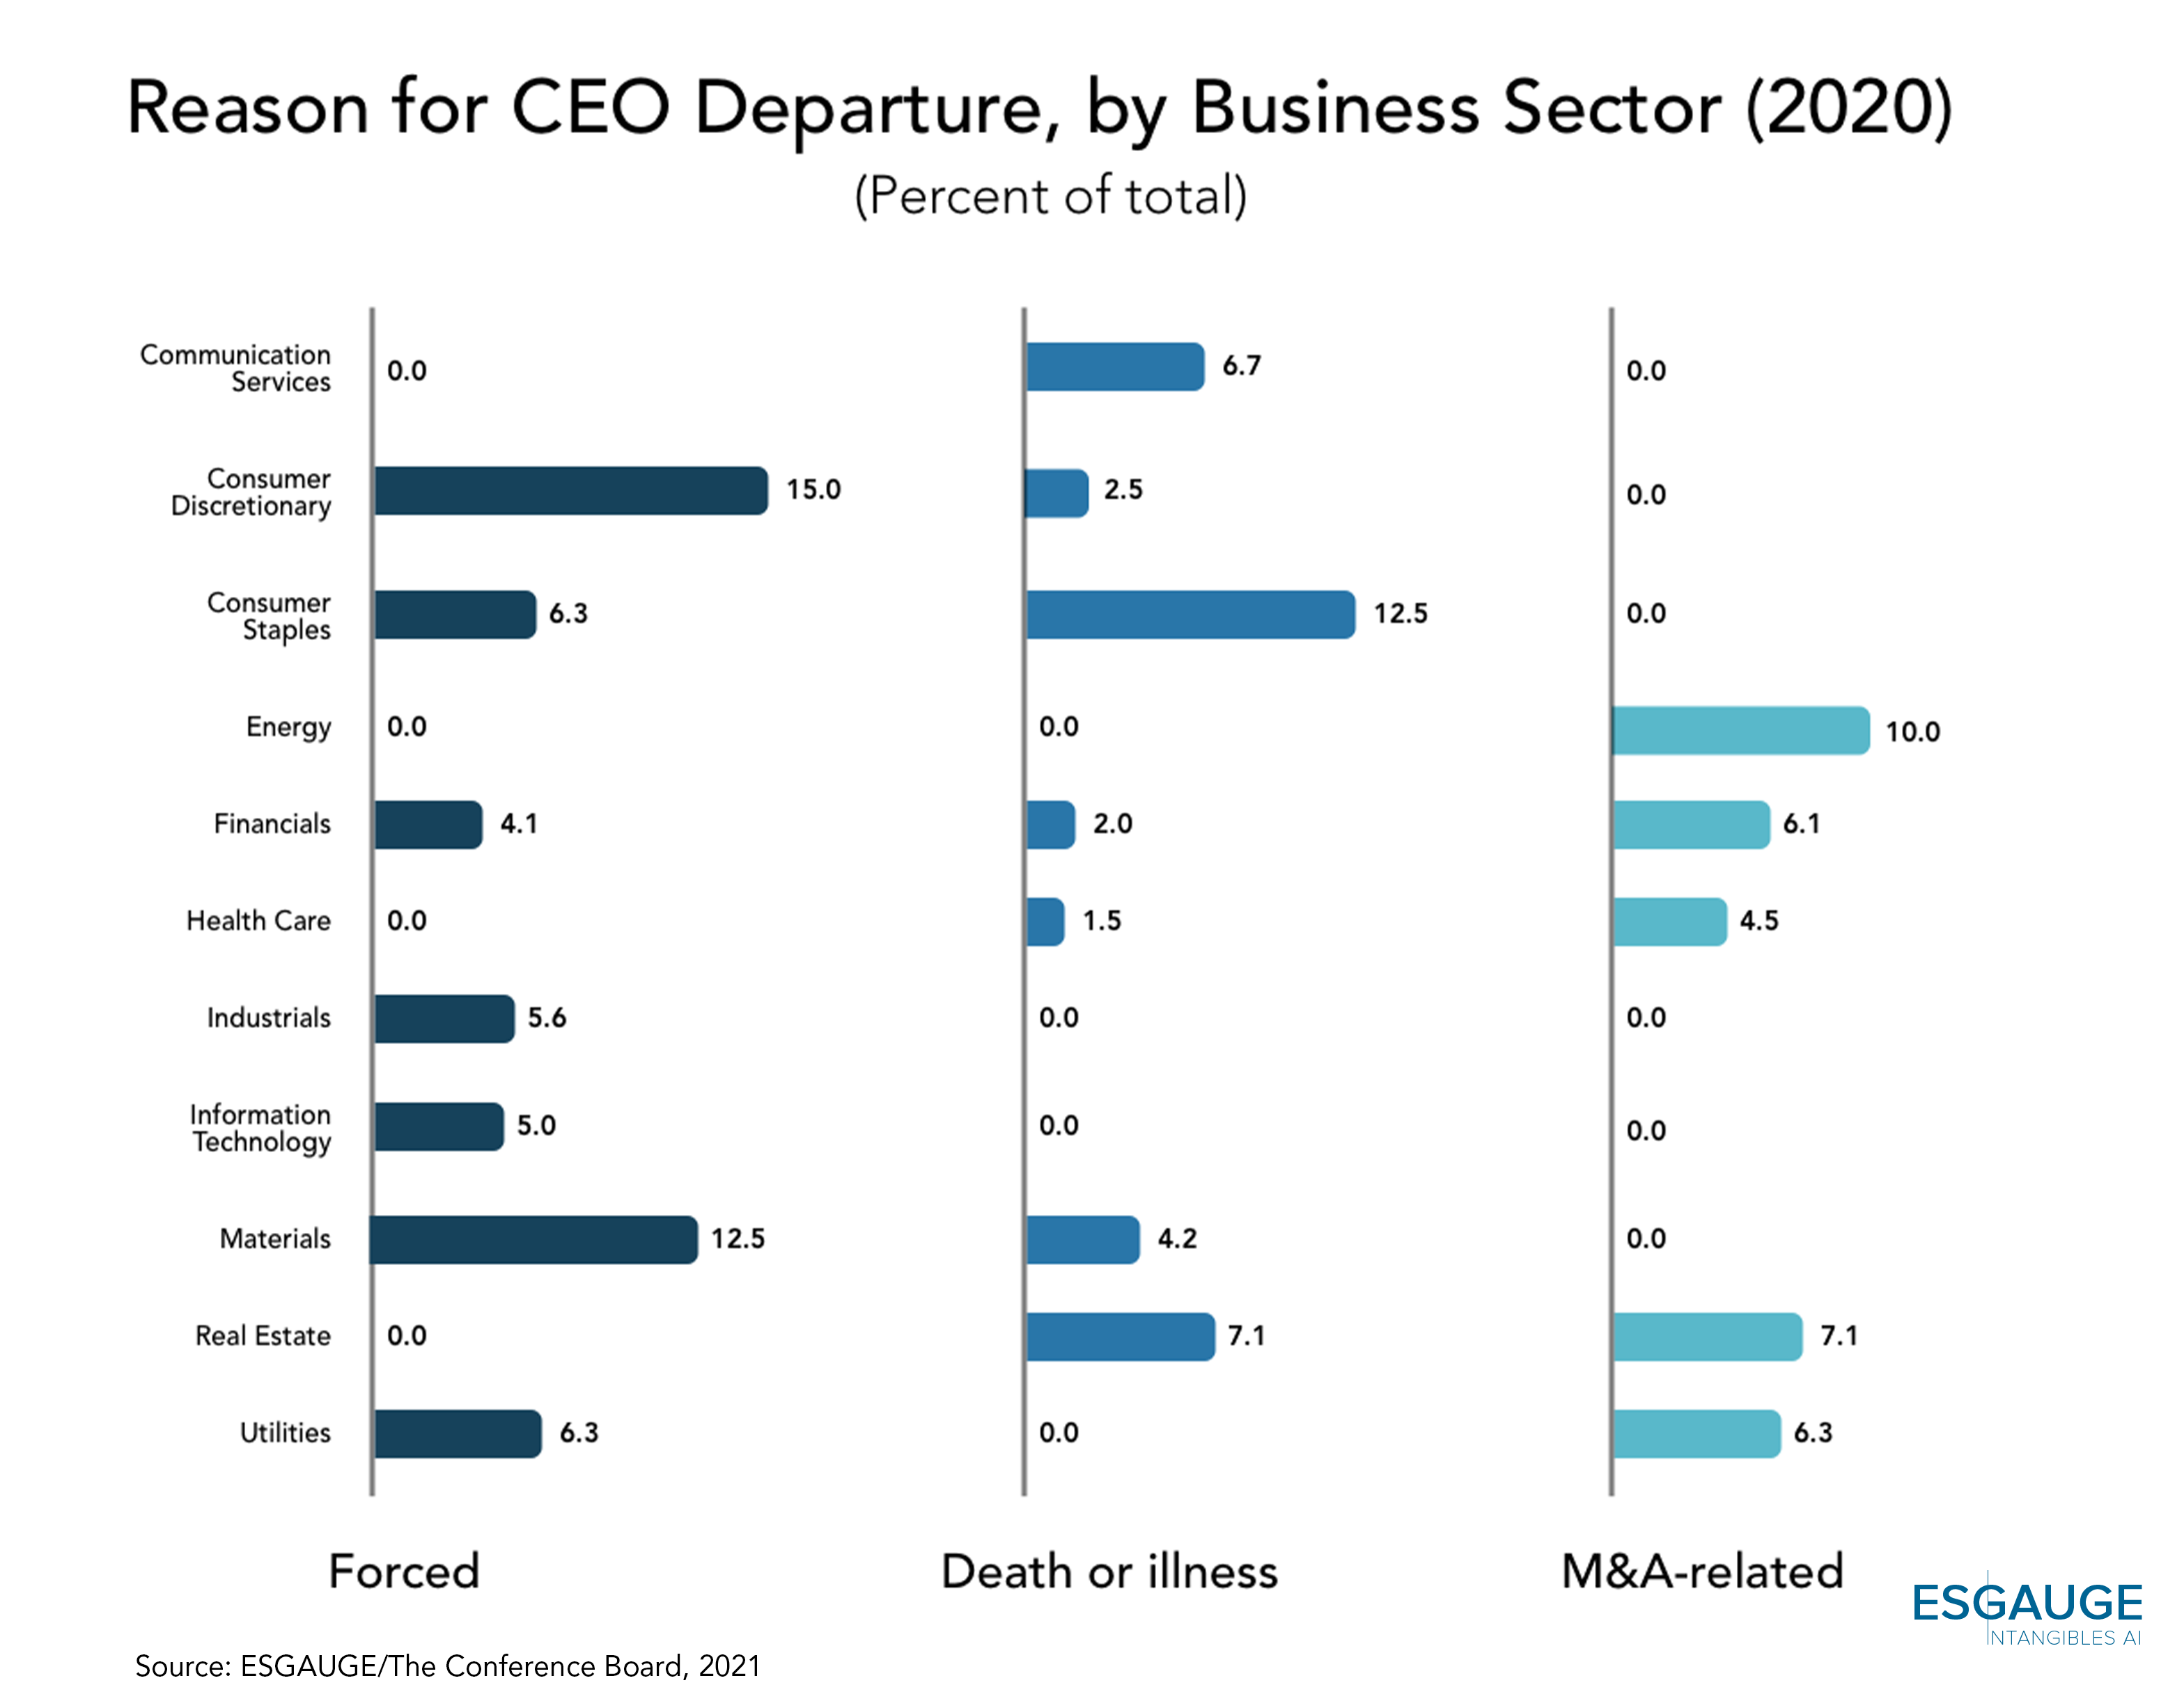
Because of the nature of these cases, it is difficult to establish a correlation with other external events affecting a specific business industry. As shown in the past, they appear scattered across multiple sectors. Of all Russell 3000 CEO successions announced in 2020, the highest percentage of forced successions was in Consumer Discretionary companies (15 percent), followed by Materials companies (12.5 percent). Communications, Energy, Health Care, and Real Estate companies reported no forced successions. Utilities experienced a four-year high 21 percent CEO succession rate in 2020, but its forced succession rate was only 6.3 percent.
What’s ahead? Boards of directors have every reason to want to know what it really feels like to work for their organizations. Incidents of personal misconduct by CEOs or other senior leaders of a public company can have disastrous consequences and undermine the company’s ability to attract and retain top talent. If played out in the media, they can also lead to profound reputational effects, which can erode investor confidence and alienate customers or other key stakeholders.
The following is what directors can do to assess corporate values, strengthen workplace culture and, where needed, mitigate the consequences of situations of misconduct—whether by the CEO or another senior leader: [7]
- Fully appreciate the link between corporate culture and shareholder value creation. As an intangible asset, corporate culture can be challenging to define and measure. Directors should share their opinion of what makes the culture of an organization and their experience of how such culture drives successful, sustainable business environments. Directors are seasoned professionals. They often bring to their role decades of on-the-job observations of the dynamics needed for people to work together productively and reach common objectives. And yet, each of their experiences is different. As boards become more diverse, these conversations can enrich each director’s perspective on the subject, help to clarify what the board should expect from management, and ultimately inform the tone at the top of the organization.
- Know how their company fares on culture. Directors should expect periodic information from management on crucial indicators of corporate culture—from reports of misconducts received by HR to data on settlements and separation agreements, and from the analyses of pay gaps that companies are increasingly conducting to the reviews of the diversity profile of new hires and promotions. They can also directly engage with cohorts of employees beyond the C-Suite or hire independent assessors to regularly survey employees and gather additional insights into engagement and inclusion in the work environment.
- Be a key driver of improvements. Culture is one of those issues where tone at the top is of the essence. The board can make the difference, not only in the example set by their own conduct but also through the multiple levers they can pull relating to corporate culture. For example, directors can promote transparency in recruitment and promotion decisions and explore how to integrate into executive compensation plans extra-financial performance metrics related to corporate culture and diversity, equity, and inclusion. They can also drive cultural change by strengthening codes of conduct, requesting cultural sensitivity training (including courses to help recognize unconscious biases and stereotypes), and educating employees on the role of bystanders in forestalling abusive behavior.
- Act swiftly and investigate thoroughly. In no situation, when facing allegations of misconduct by the CEO or other senior business leader, should the board of directors minimize the incident and hope for the problem to go away. While at times facts may be easy to ascertain, a full investigation is often required to help inform the company’s decision and to prepare for (and mitigate the risks associated with) litigation that can arise from dismissal or by a failure to dismiss an executive. The board may choose to entrust outside counsel with litigation and employment law experience to conduct a full investigation, including anonymously interviewing employees, examining emails, and obtaining access to digital servers and physical documents. In addition to helping to achieve a good result and reduce the risks associated with litigation, directors receive the protection of the business judgment rule if their decision is informed by the thorough investigative report of an independent advisor.
- Employ strategic communication. Communicating with employees, investors, and other key stakeholders is critical. In the event of a CEO or senior executive dismissal, the board of directors should require a clear communication strategy to assure these groups about its commitment to a safe and healthy workplace where senior management can be trusted and leads by example. When they choose to terminate the CEO or another senior executive, board members should promptly activate the company’s emergency succession protocol and publicize their vision of the future and their plan to restore confidence in business management.
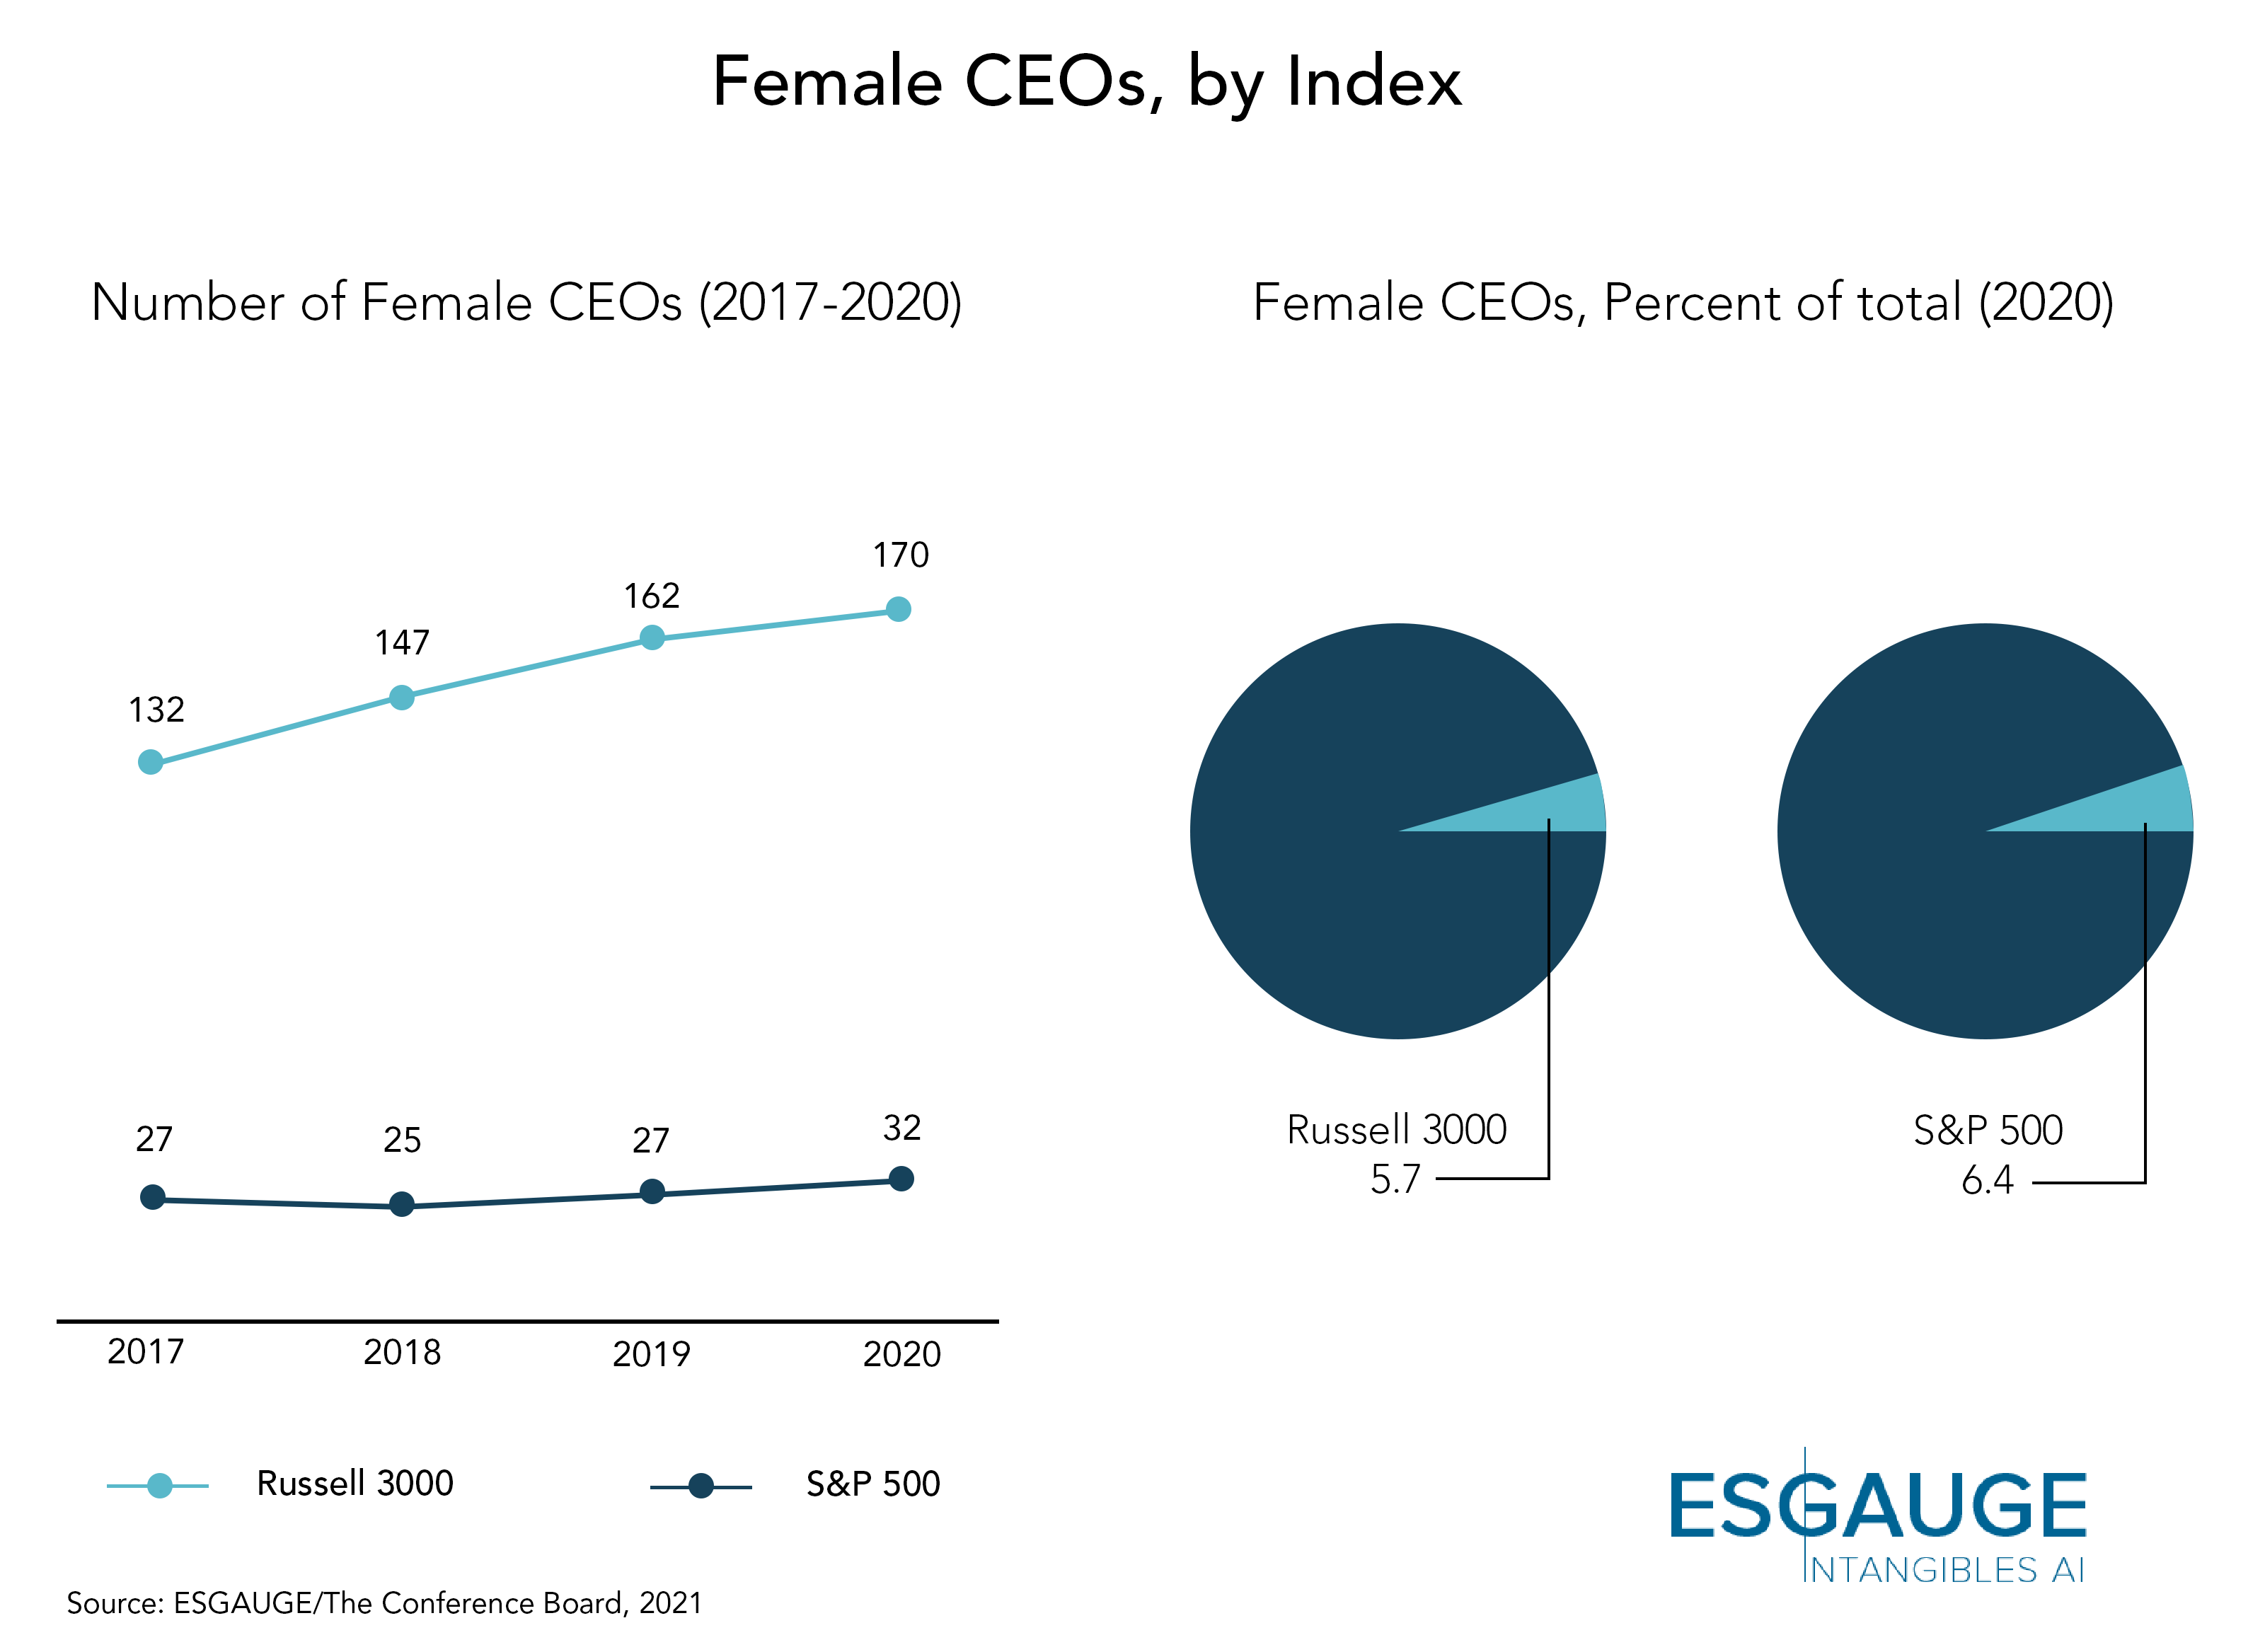
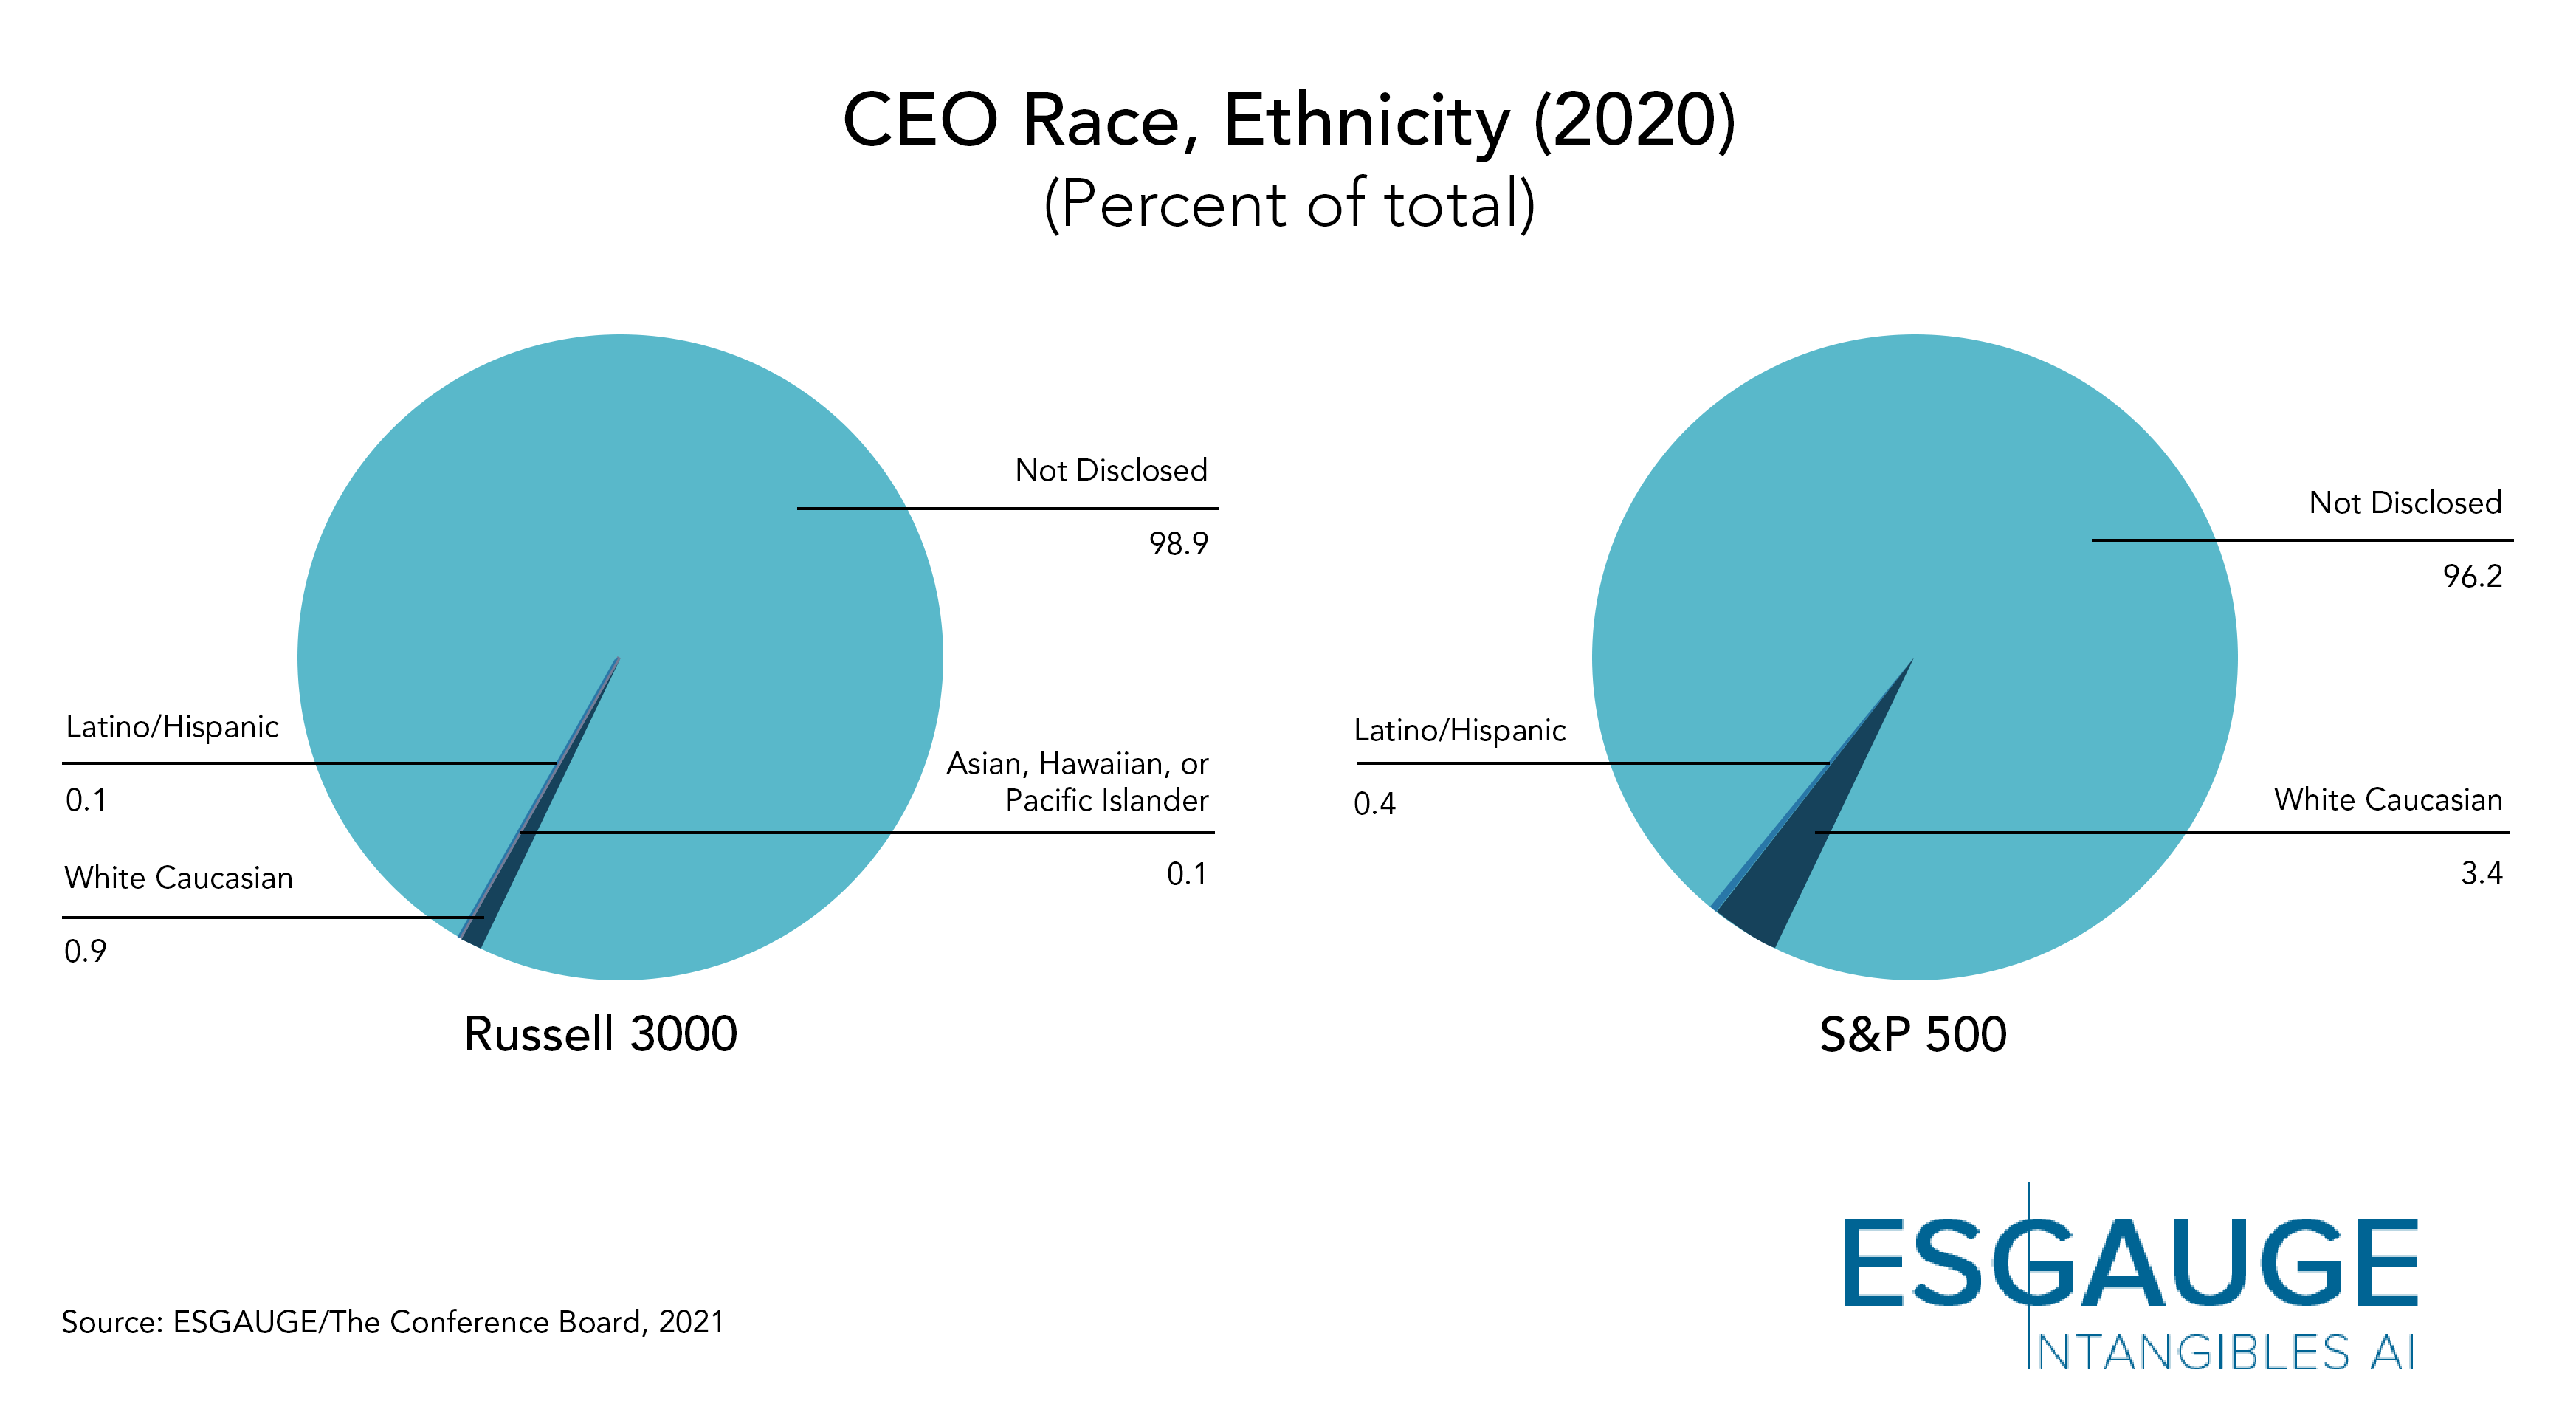
The continued focus on diversity in upper management has yet to exhibit transformative gains in the chief executive demographics. Among the Russell 3000, 5.7 percent of CEOs are women, a net increase of only eight female CEOs in 2020 driven almost entirely by leadership changes at smaller companies. The lack of disclosure makes it difficult to assess CEO racial diversity—98.9 percent of Russell 3000 companies do not include ethnic background information in their proxy statements.
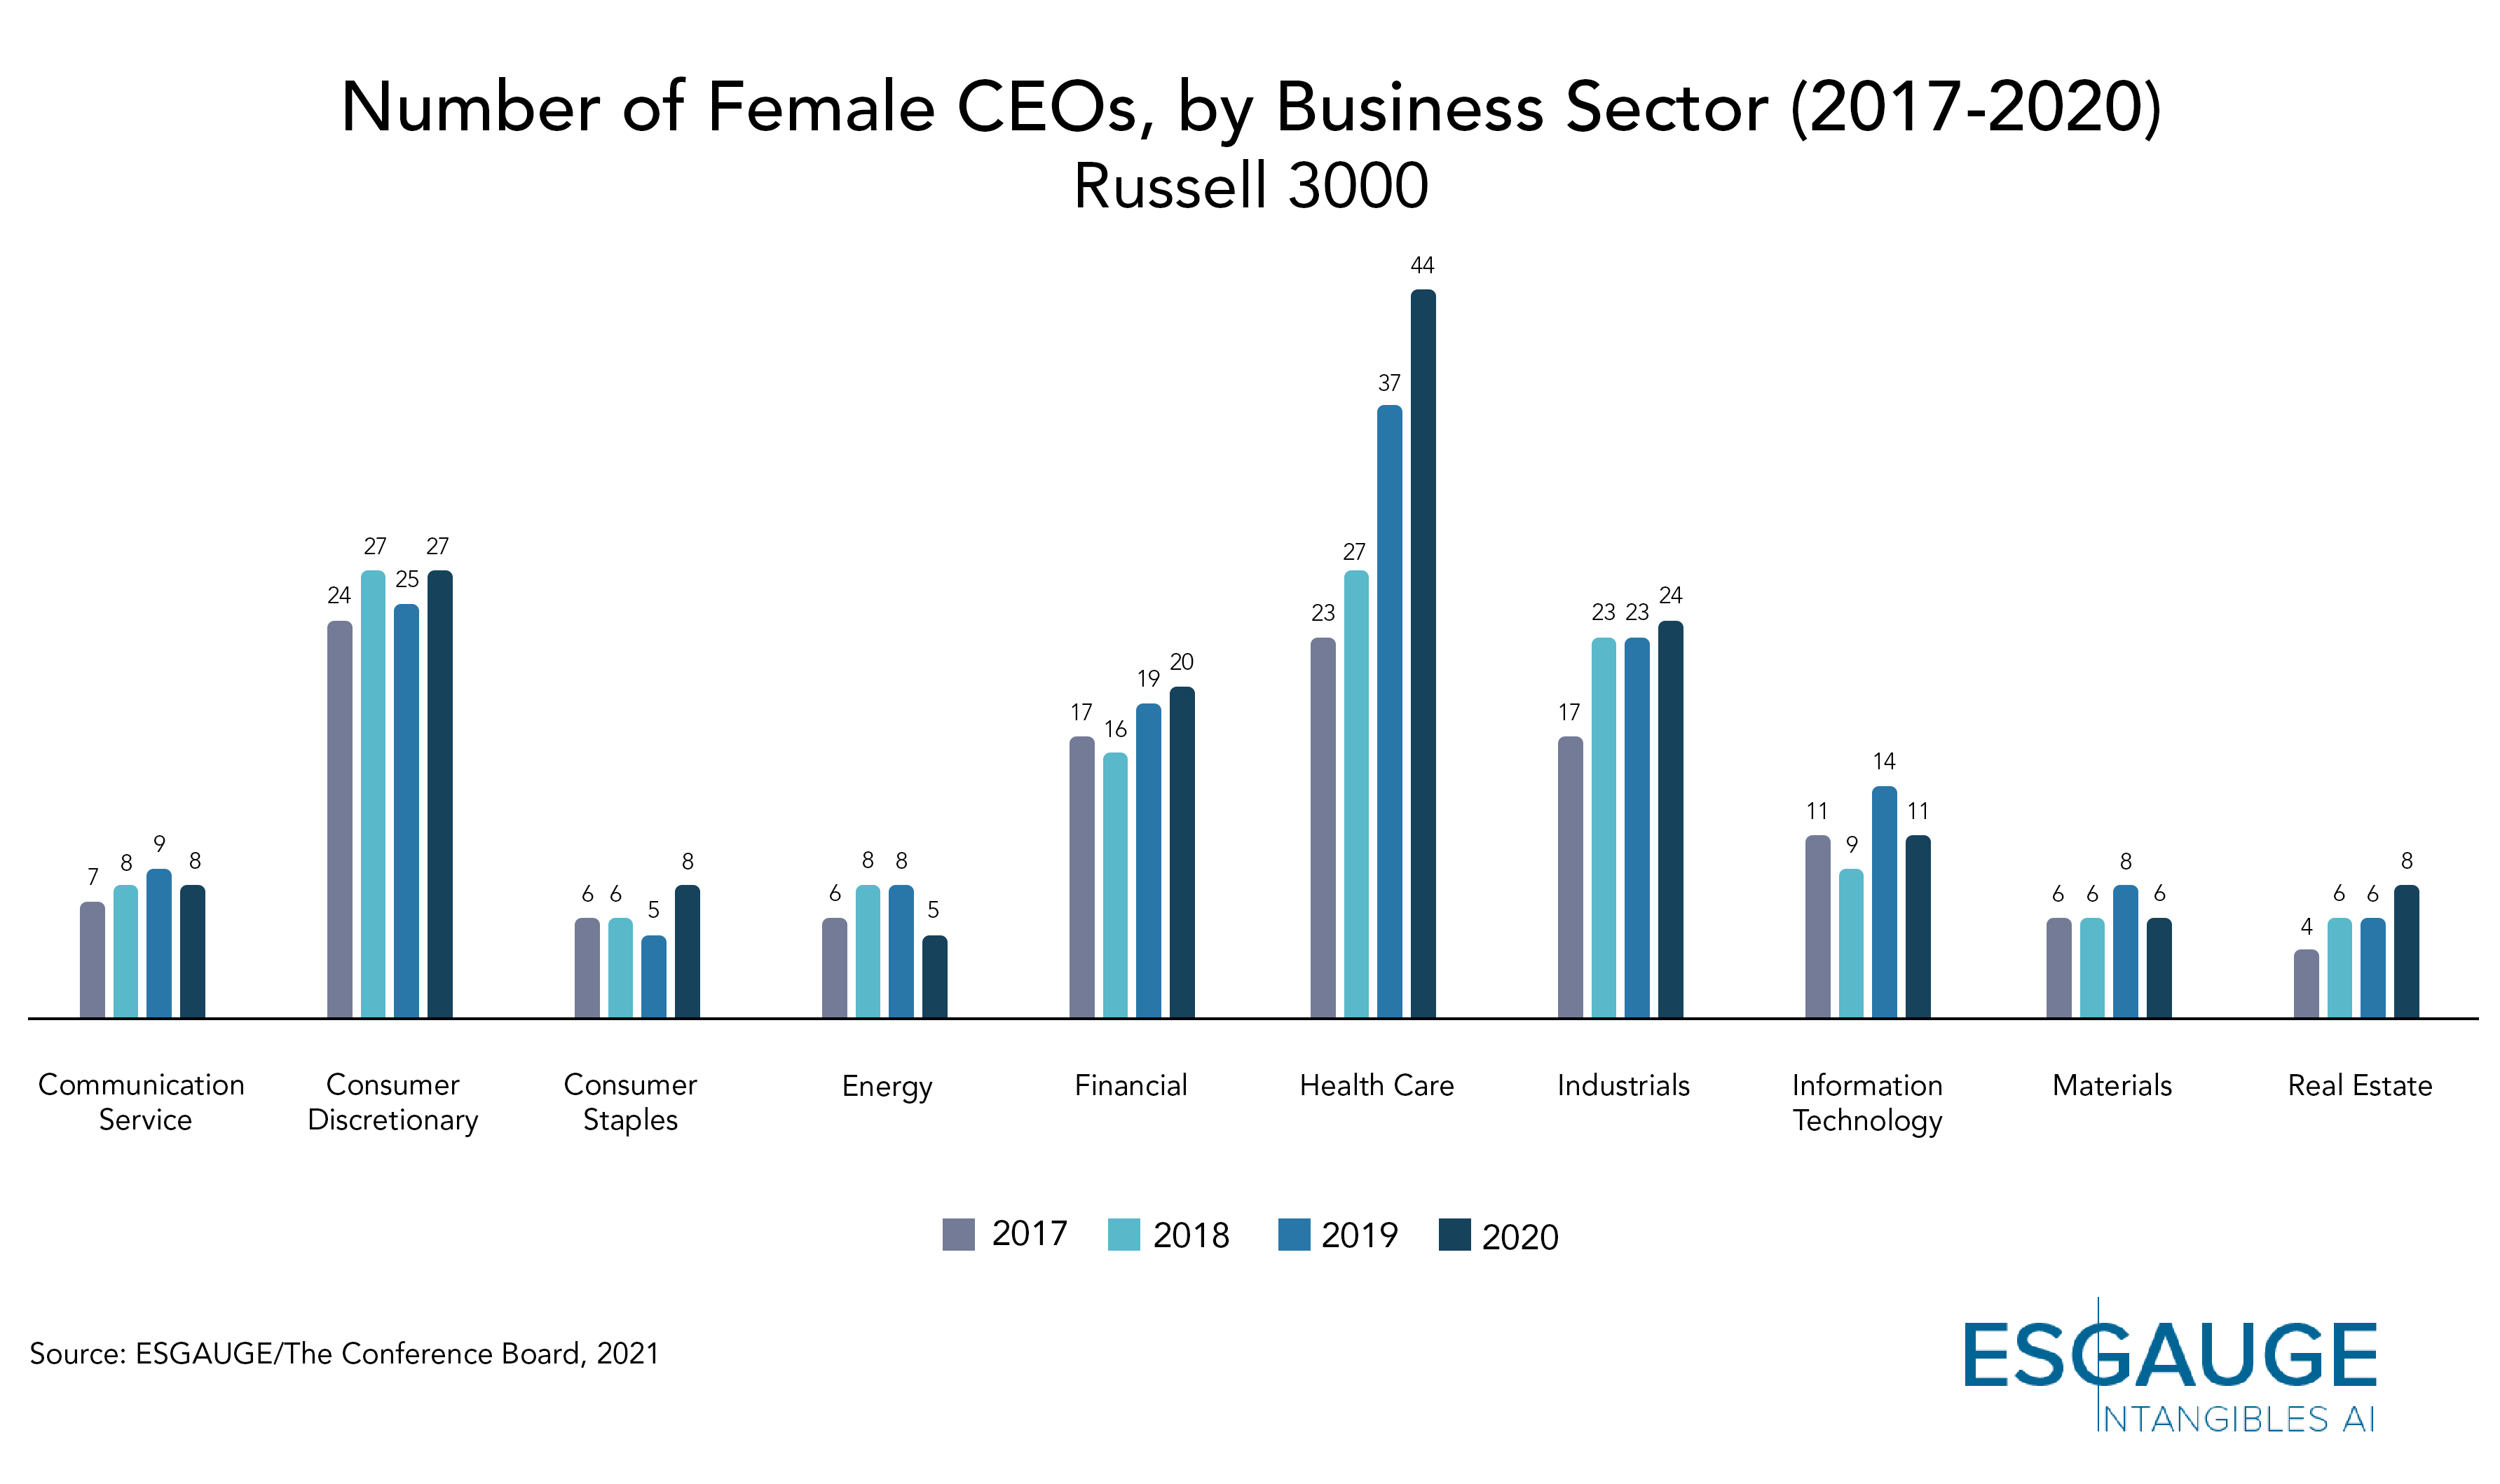
In 2020, there were 170 female CEOs in the Russell 3000, representing 5.7 percent of total CEOs—an increase of eight CEOs from 162 female CEOs recorded in the index in 2019 and a net increase of 23 CEOs since 2018. There were 32 female CEOs in the S&P 500, representing 6.4 percent of total CEOs—a rise of five CEOs from the total of 27 female CEOs recorded in the index in 2019 and a net increase of seven CEOs since 2018.
Among Russell 3000 companies, four out of 11 business sectors reported a net decrease in female CEOs in 2020. These are the Information Technology (a net decrease of three female CEOs), Energy (net decrease of three), Materials (net decrease of two), and Communication Services (net decrease of one) sectors. The remaining seven business sectors reported a net increase in female CEOs in 2020, with Health Care (a net increase of seven female CEOs) and Consumer Staples (net increase of three) having the most significant net increases. The Information Technology sector had the same number of female CEOs in 2020 as it did in 2017. The Energy and Utilities sectors had fewer female CEOs in 2020 than in 2017.
It is also interesting to note that, in the Russell 3000, the rise in the number of female CEOs occurred among the smallest companies. In particular, the 2020 analysis by company size shows a net increase of six female CEOs among manufacturing and nonfinancial services companies with annual revenue under $5 billion and a net increase of four female CEOs among Financials and Real Estate companies with less than $25 billion in assets. In contrast, there was a decline of one female CEO in manufacturing and nonfinancial services companies with annual revenue of $5 billion or higher and a net decrease of one female CEO in Financials and Real Estate companies with asset value over $25 billion. Among Financials and Real Estate companies, 28 out of 759 CEOs are women, a rate of only 3.6 percent.
While the expectation is that companies will become more forthcoming in disclosing the racial diversity of their leadership teams, as much as 98.9 percent of Russell 3000 and 96.2 percent of S&P 500 companies did not include in their 2020 disclosure documents any information about the ethnic background of their CEO. Of the companies that did provide this information, approximately 90 percent of S&P 500 CEOs identified as White/Caucasian.
What’s ahead? The continued focus on diversity in upper management has yet to exhibit transformative gains in chief executive demographics. While companies provide insight into gender diversity, the lack of disclosure about racial and ethnic diversity prevents meaningful large-scale analysis of these trends. Expect that to change in the near future as companies become more transparent on their diversity, equity, and inclusion efforts.
As for gender diversity, one factor that receives less discussion but appears essential in the 2020 CEO succession trend analysis is the unequal distribution of female CEOs by company size and business sector. What may be even more concerning than the minimal gains in the number of female CEOs is where these gains are concentrated.
The net gain in female CEOs in 2020 has taken place among the smallest companies in the Russell 3000, with gender diversity stalling or declining among larger firms. With an increase of 10 female CEOs among the smallest firms offset by a net decrease of two female CEOs among the largest firms, the net gain of eight female CEOs is concentrated among the smallest public companies.
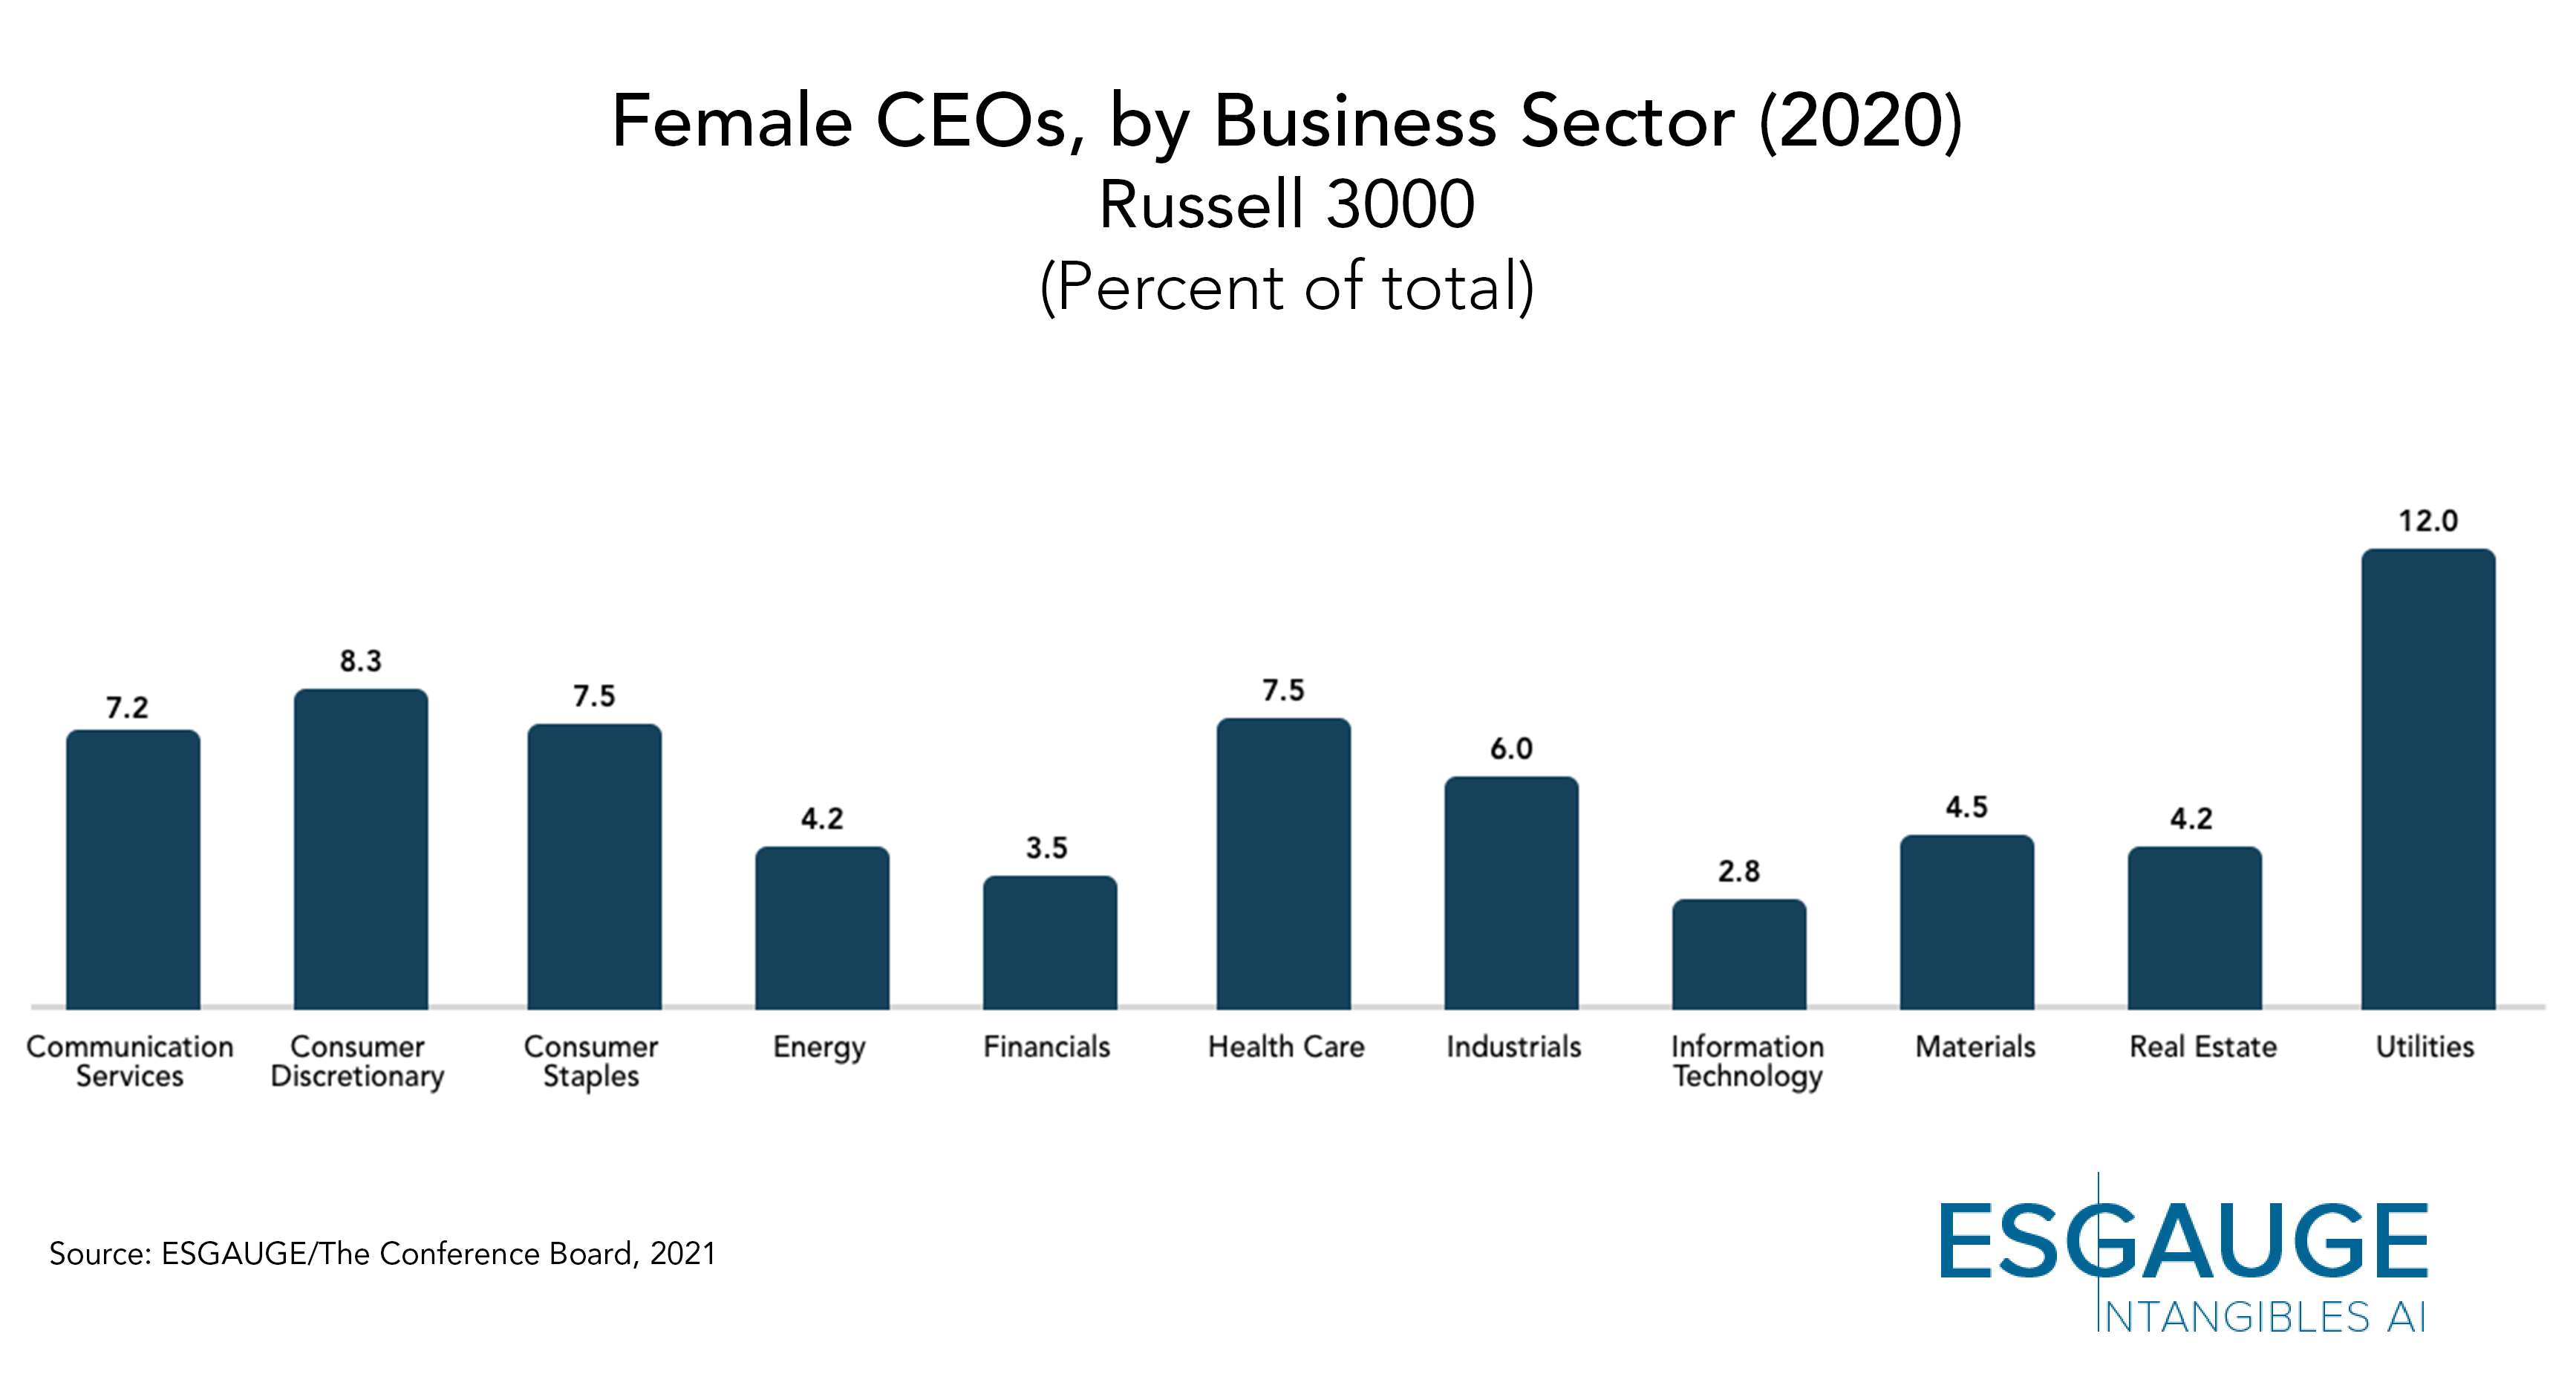
Additionally, several business sectors continue to have meaningfully lower female CEO representation. Most notable are the Information Technology and Financials sectors. Among the 387 Information Technology companies in the Russell 3000, only 2.8 percent have a female CEO, well below the average rate of 5.7 percent. Among the 570 Financials companies in the Russell 3000, only 3.5 percent have a female CEO, well below the average rate of 5.7 percent. If each sector were to increase its share of female CEOs to reach the average rate of 5.7 percent, the Information Technology sector would have twice as many female CEOs (22 female CEOs instead of 11 in 2020) and the Financials sector would have 65 percent more female CEOs (33 female CEOs instead of 20 in 2020).
These company size and business sector trends mean that the minimal gender diversity gains registered among chief executive officer positions are not equal. Even when women reach the CEO position, it tends to be among the smallest firms in a limited number of business sectors.
Other Notable Findings
On Departing CEOs
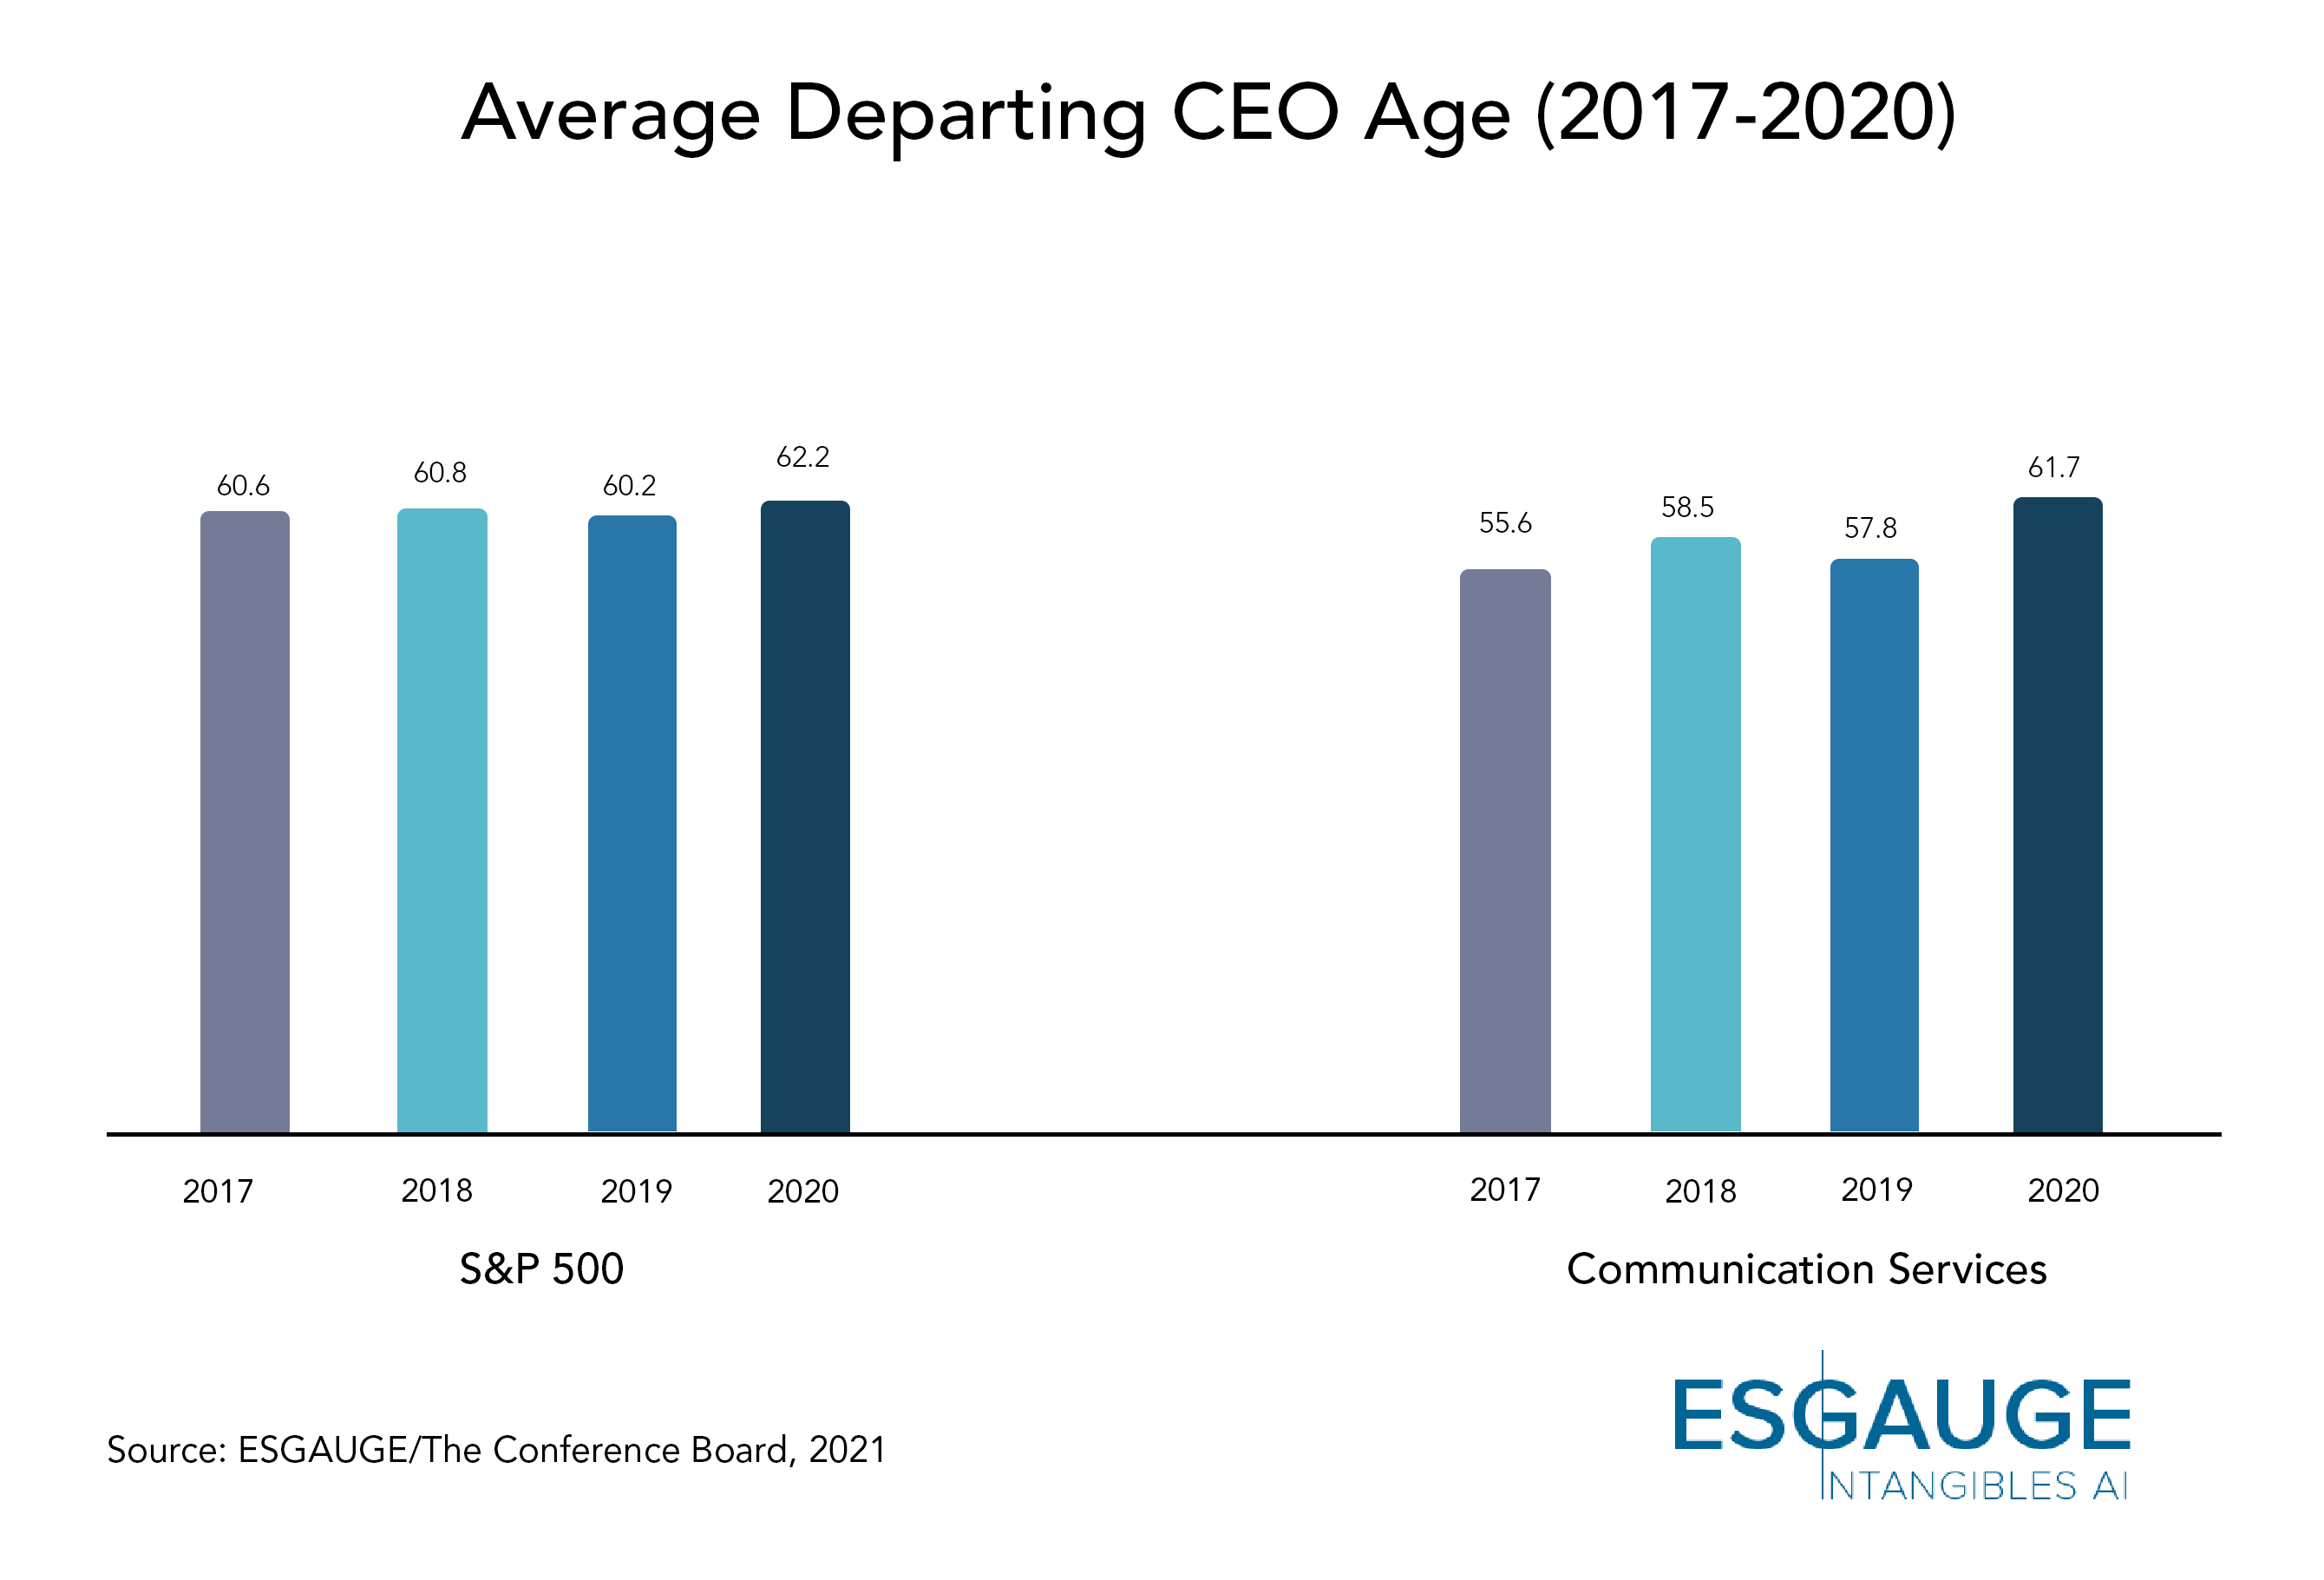
- In the Russell 3000, the average age of a departing CEO is nearly 61 years old, up slightly from 2019 at 59.7 years. The figure is somewhat higher in the S&P 500 (62.2 years) and has been relatively consistent during the last two decades. Some business sectors that had lower average CEO ages saw steady increases in recent years, presumably because the bull market of the 2010s prolonged the tenure of many executives. For example, CEOs in the Communication Services sector went from an average departing age of 55.6 in 2017 to 61.7 in 2020.
- The top-three oldest departing CEOs in the Russell 3000 were also very long-tenured CEOs: Norman Asbjornson of AAON was 85 when he transitioned to the role of Executive Chairman in 2020 and had been CEO for 31 years; Leslie Wexner of L Brands was 83 and had been CEO for 57 years; Alan Miller of Universal Health Services was also 83 and had been CEO for 43 years. The top three-youngest departing CEOs in the Russell 3000 were not always very short-tenured: Adam Price of Waitr Holdings left the post at age 36 and had been CEO for one year only; Andrew Witt of Colony Credit Real Estate was 42 and went in and out of his CEO job in 2020; however, Artur Bergman of Fastly Inc. was 41 when he stepped down and had been CEO for the previous nine years.
- Despite the efforts to increase the gender diversity of business leadership, the share of female departing CEOs in the Russell 3000 grew in 2020 to 6.7 percent from 6.2 percent in 2019 and 3 percent in 2017. In the S&P 500, 5.5 percent of CEO departures were women, which is higher than the average 19-year departure rate of 3.8 percent recorded from 2001 to 2019. Materials companies had the highest percentage of female CEO departures in 2020 (12.5 percent, or three departing female CEOs). The company size analysis is also quite insightful: Among the smallest companies with annual revenue under $100 million, the number of female departures rose from two in 2019 (5.4 percent of the total number of CEO succession announcements in that size group) to eight in 2020 (16.7 percent).

- It continues to be impossible to comment on the racial or ethnic diversity of the departing CEO population due to the lack of official corporate disclosure on this matter in 2020.
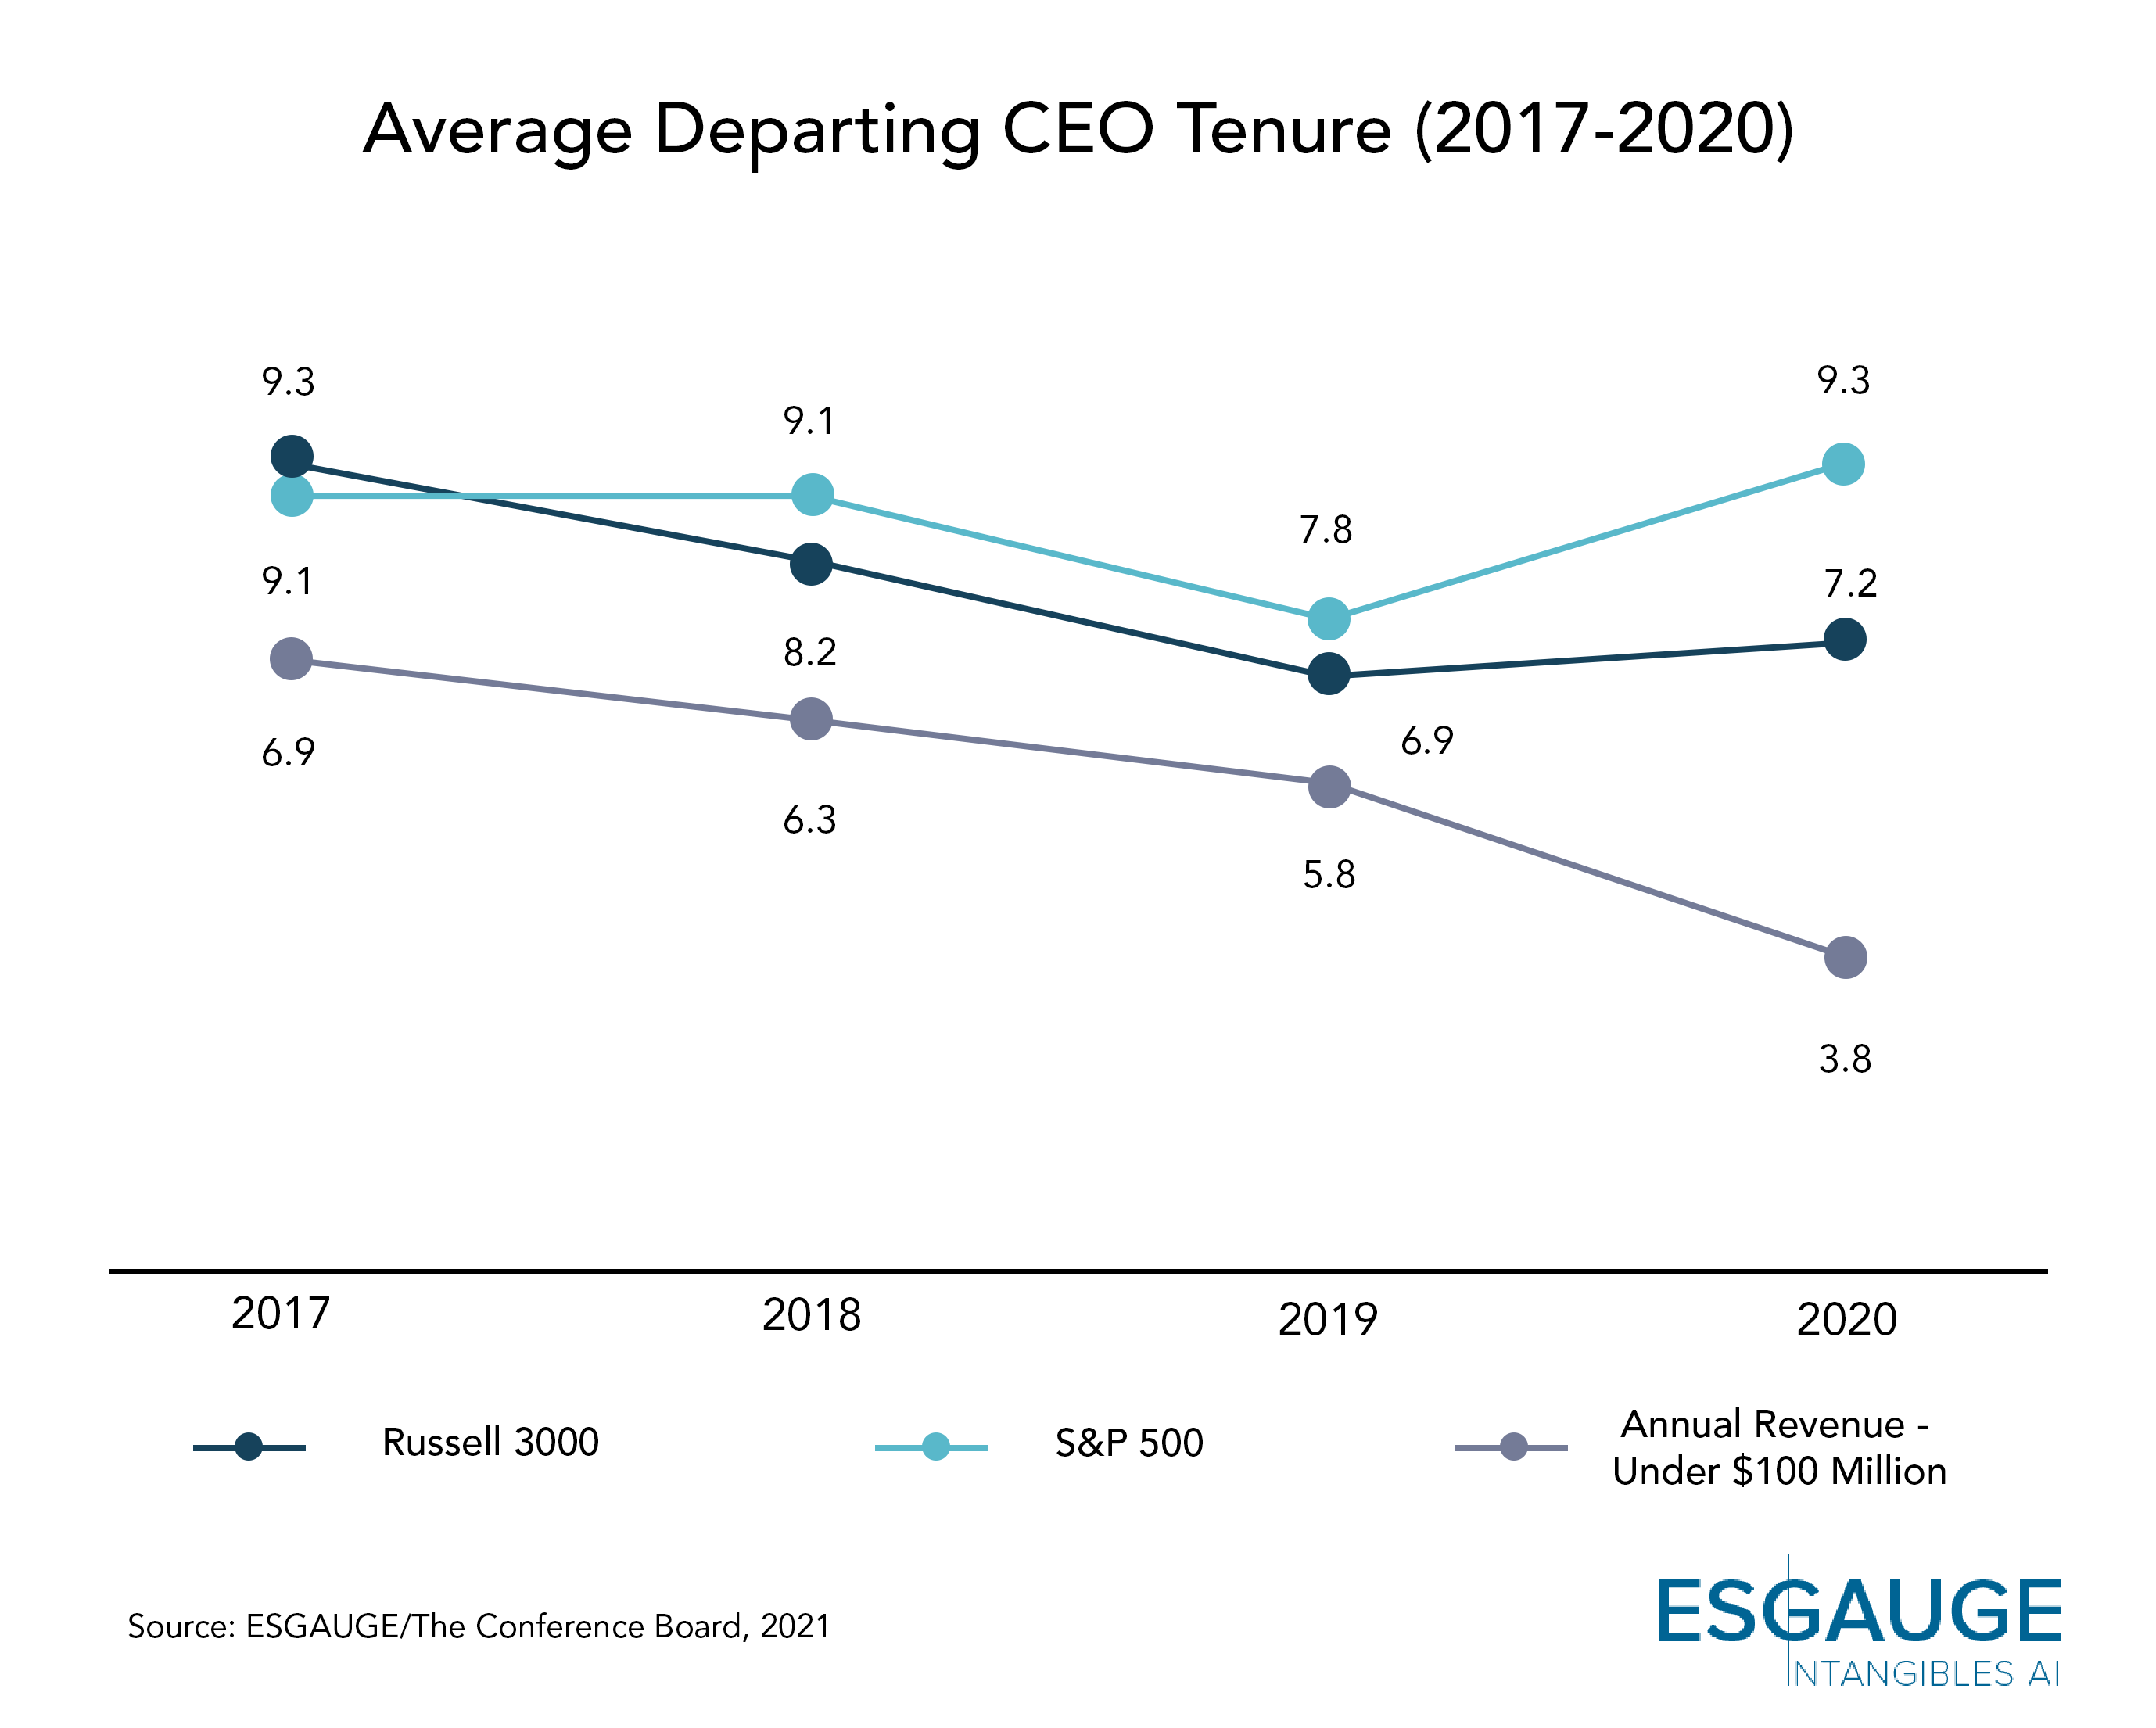
- The tenure of departing CEOs has been fluctuating in the last few years, mainly due to the two conflicting driving forces: a buoyant stock market, which has prolonged many leadership tenures, and the aging CEO population, which continues to be the primary driver of change. In the Russell 3000, the average departing CEO tenure was 7.2 years in 2020, down from the 9.3 years recorded in 2017 but up from the 6.9 years reported in 2019. The S&P 500 average departing CEO tenure was 9.3 years in 2020, up from 7.8 years in 2019 and 9.1 years in 2017. The 2020 tenure of 9.3 years is the longest tenure observed for departing S&P 500 CEOs since 2015, which reported 10.8 years. The highest tenure in the last 20 years, 11.3 years, was recorded in 2002. CEOs tend to stay less in their job at smaller companies: The average departing CEO tenure of 3.8 years was lowest in the group with annual revenue below $100 million, marking a decrease from 2019 when it was also the lowest at 5.8 years.
- The list of longest-tenured departing CEOs includes Leslie Wexner of L Brands, who was 83 when he stepped down and had been CEO for 57 years, and Alan Miller of Universal Health Services, also 83 and CEO for 43 years. The time spent as CEO for the shortest-tenured is recorded in months. Most of these cases are situations where a senior executive was asked to assume the chief executive responsibilities as an interim during a phase of transition: For example, Andrew Witt of Colony Credit Real Estate was 42 when appointed interim CEO and served in that role for one month in 2020.
On Incoming CEOs
- The average age of an incoming CEO was 54.2 years in the Russell 3000 and 54.7 years in the S&P 500—somewhat higher than the 53.2 years found on average for the entire 20-year historical period for which The Conference Board and ESGAUGE have collected annual data. Across business sectors, the oldest incoming CEOs are seen in the Energy sector (60.1 years, on average), while Communication Services and Real Estate companies had the youngest (51 years in both groups). While the Information Technology sector is often portrayed as having younger executives, the median incoming CEO age in this sector is 56 years, and it had increased since 2017 when it was 53. The median incoming CEO age in the Materials and Industrials sectors, traditionally thought to be bastions of older executives, is 55.5 years and 54 years, respectively. While there is no direct correlation between company size and the age of incoming chief executives, companies with annual revenues over $50 billion reports the oldest incoming CEO age among all size groups (or 59 years of age at the median).
- The oldest incoming CEO in 2020 was Peter Harf of cosmetics company Coty Inc., who was appointed CEO at the age of 74. Robert E. Mellor of auto service Monro, Inc., was asked to assume the role at the age of 76, but on an interim basis. The Consumer Discretionary and Consumer Staples sectors accounted for five of the 25 oldest incoming CEOs, all over 70. The youngest incoming CEO in 2020 was Jayme Mendal of online insurance marketplace Everquote, Inc.; Mendal was promoted to the top leadership position at 35 years of age after serving as chief operating officer and chief revenue officer. The Health Care and Financials sectors account for 11 of the youngest 25 incoming CEOs, with incoming ages ranging from 37 to 44.
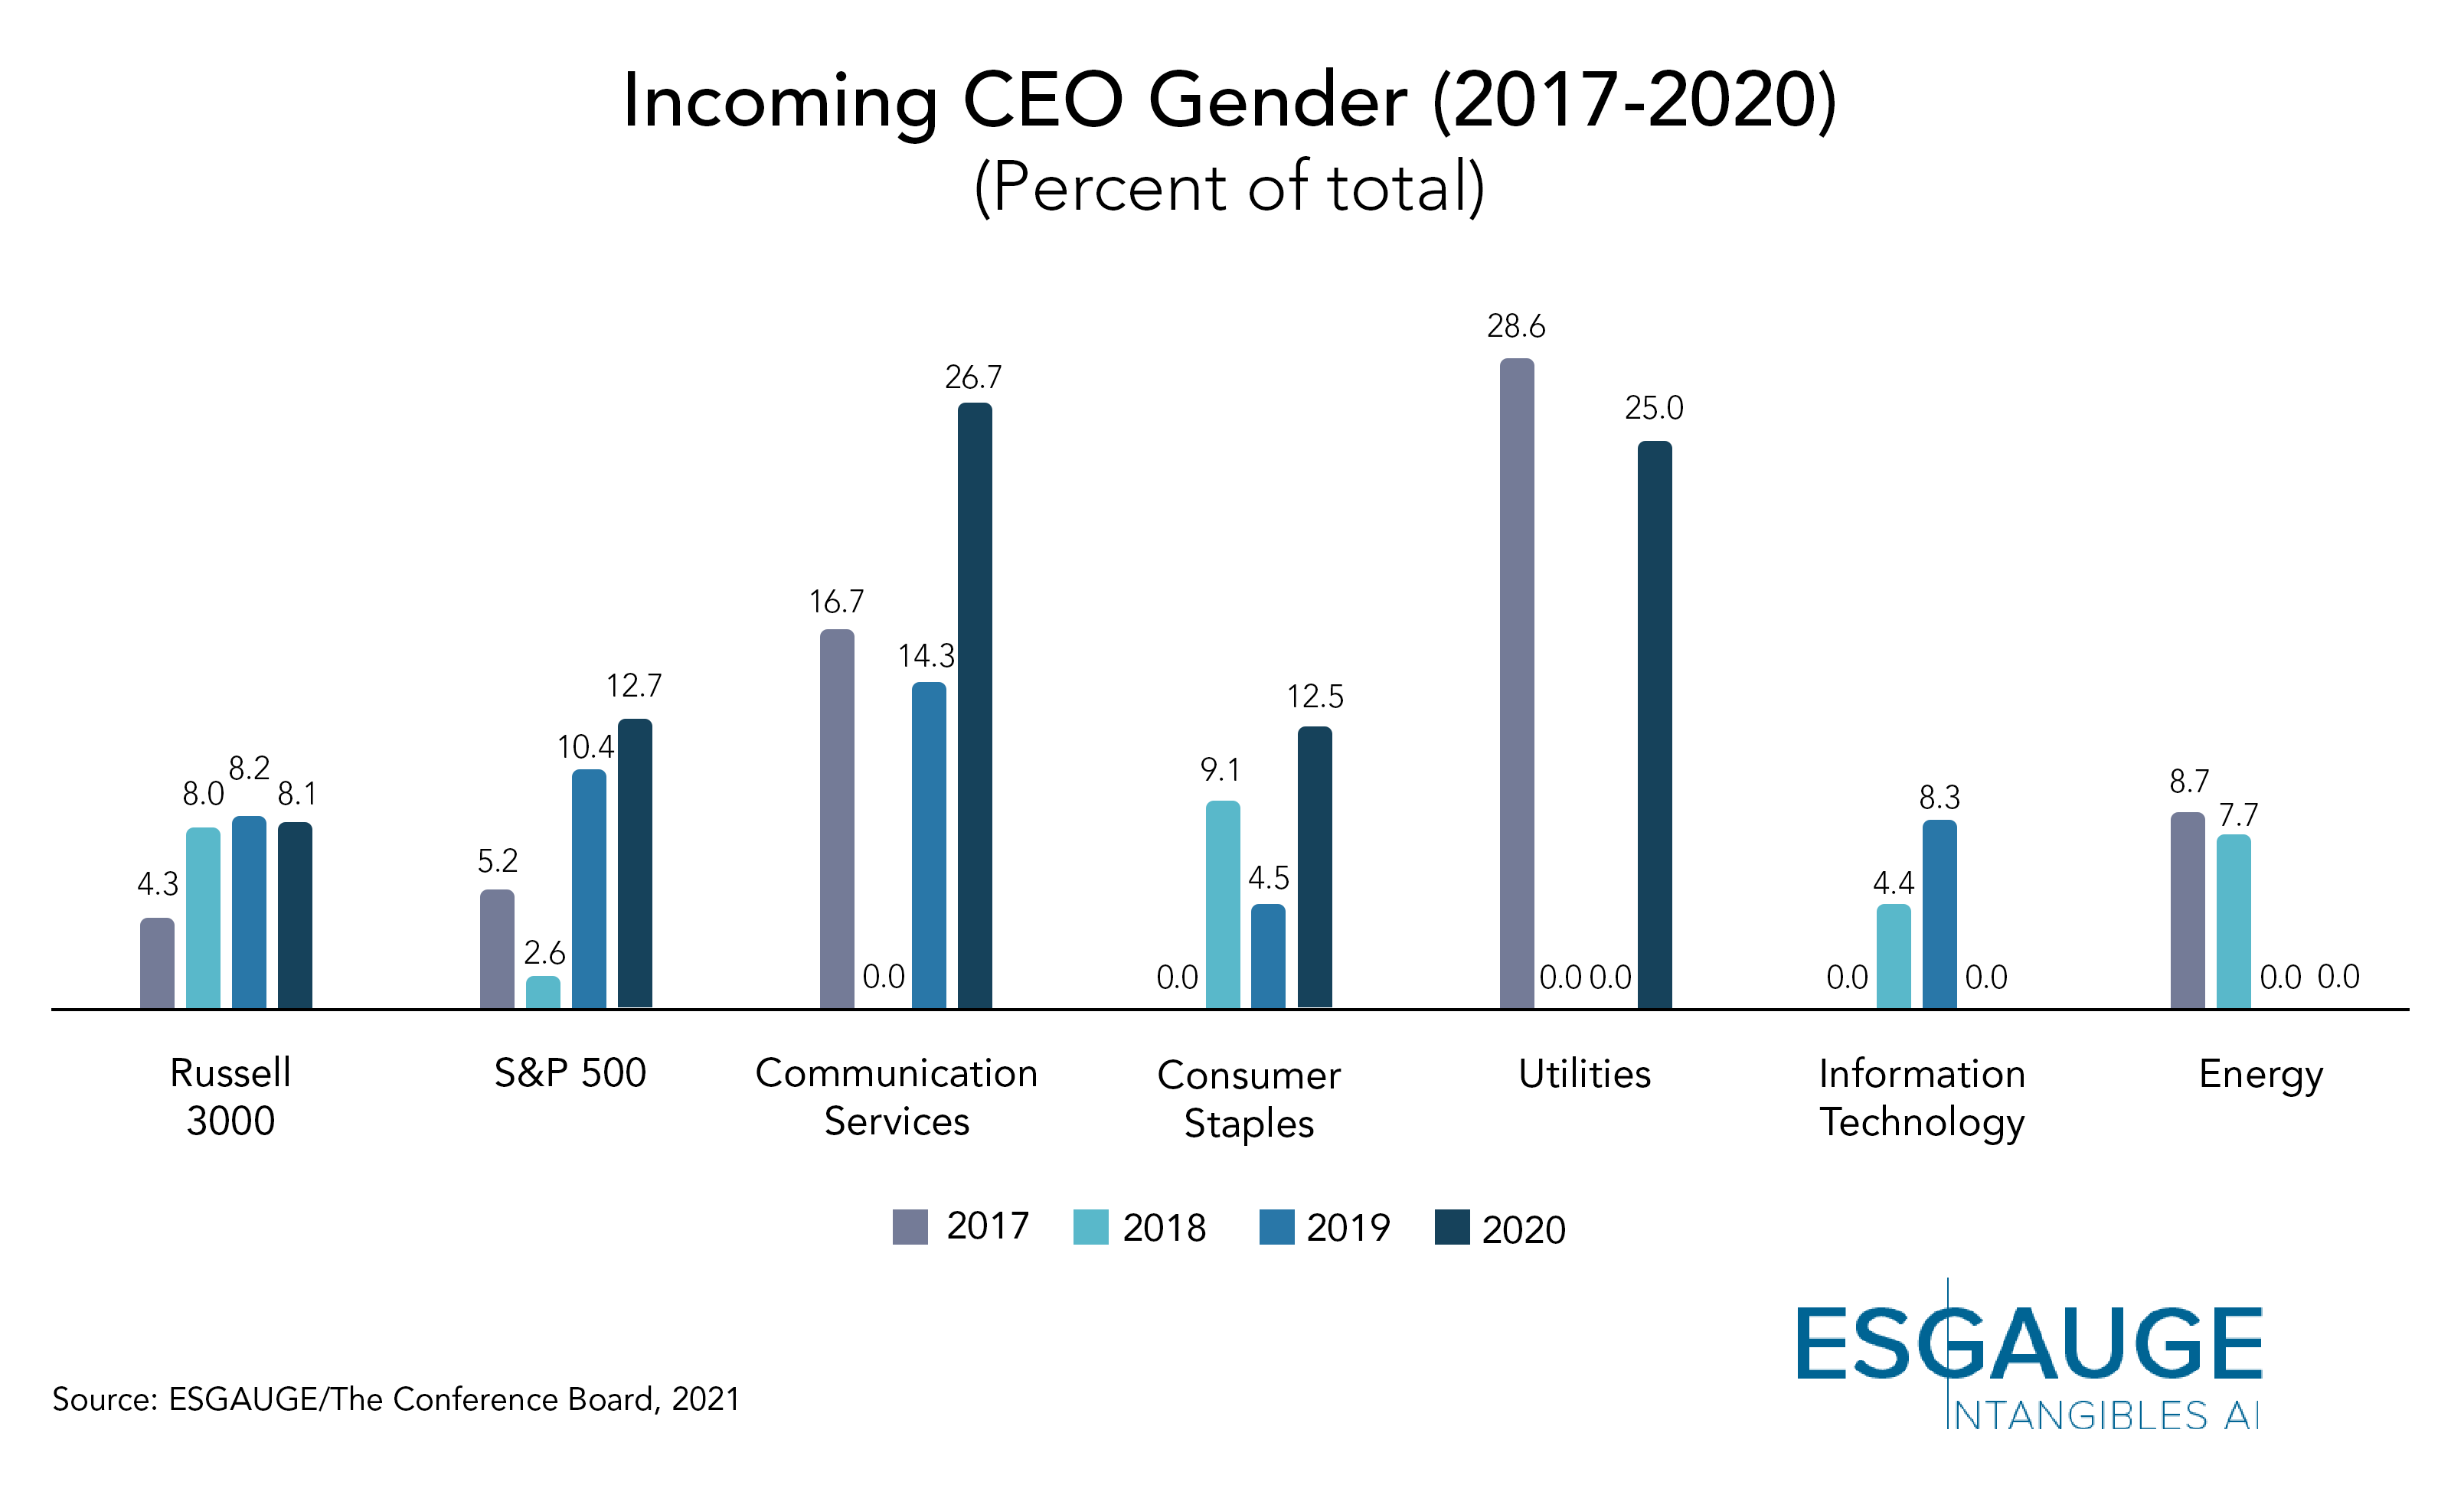
- As for gender diversity, in the Russell 3000, 8.1 percent of the class of 2020 incoming CEOs were women—essentially on a par with the data recorded in 2019 but twice as high as the percentage found in 2017 (4.3 percent). In the S&P 500, 12.7 percent of incoming CEOs were female CEOs—a higher rate than the average annual rate of 6.1 percent recorded by The Conference Board and ESGAUGE in the entire period from 2001 to 2019. In fact, the S&P 500 rate of 12.7 percent of female appointments is the highest rate since 2013 and the third-highest rate in the 19 years tracked by this report. Unfortunately, due to the exits mentioned above, the increased rate of female appointments had a limited net effect on the total presence of female CEOs in the indexes. Of the 2020 incoming CEOs in the Communication Services sector, 26.7 percent were female CEOs. The second and third highest percentages were recorded in the Utilities (25 percent) and Consumer Staples (12.5 percent) sectors. The Energy and Information Technology sectors, with a total of 10 and 40 CEO successions, respectively, had no female incoming CEOs in 2020.
- The 2020 appointment list includes three female CEOs in the Financial Services sector, two of whom were tapped to lead large banks. By way of comparison, there had been none in the entire Russell 3000 in the 2017-2019 period. Jane Fraser made headlines last year when appointed as the new CEO of Citigroup. Lynne Fox was named interim CEO of Amalgamated Bank, which has more than $100 billion in assets, and then gave the permanent position in May 2021 to another woman, Priscilla Sims Brown. Finally, Katherine Antonello was hired to lead insurance company Employers Holdings, Inc. Fox is also the second oldest of the new female CEOs named in 2020, at 62 years of age. The oldest new female CEO is Carol Tomé of United Parcel Service, who is 63. The youngest new female CEO of 2020 is Linda Rendle of The Clorox Company, who is 41.
- It continues to be impossible to comment on the racial or ethnic diversity of the incoming CEO population due to the lack of official corporate disclosure on this matter in 2020.

On Placement Types and Other Practices
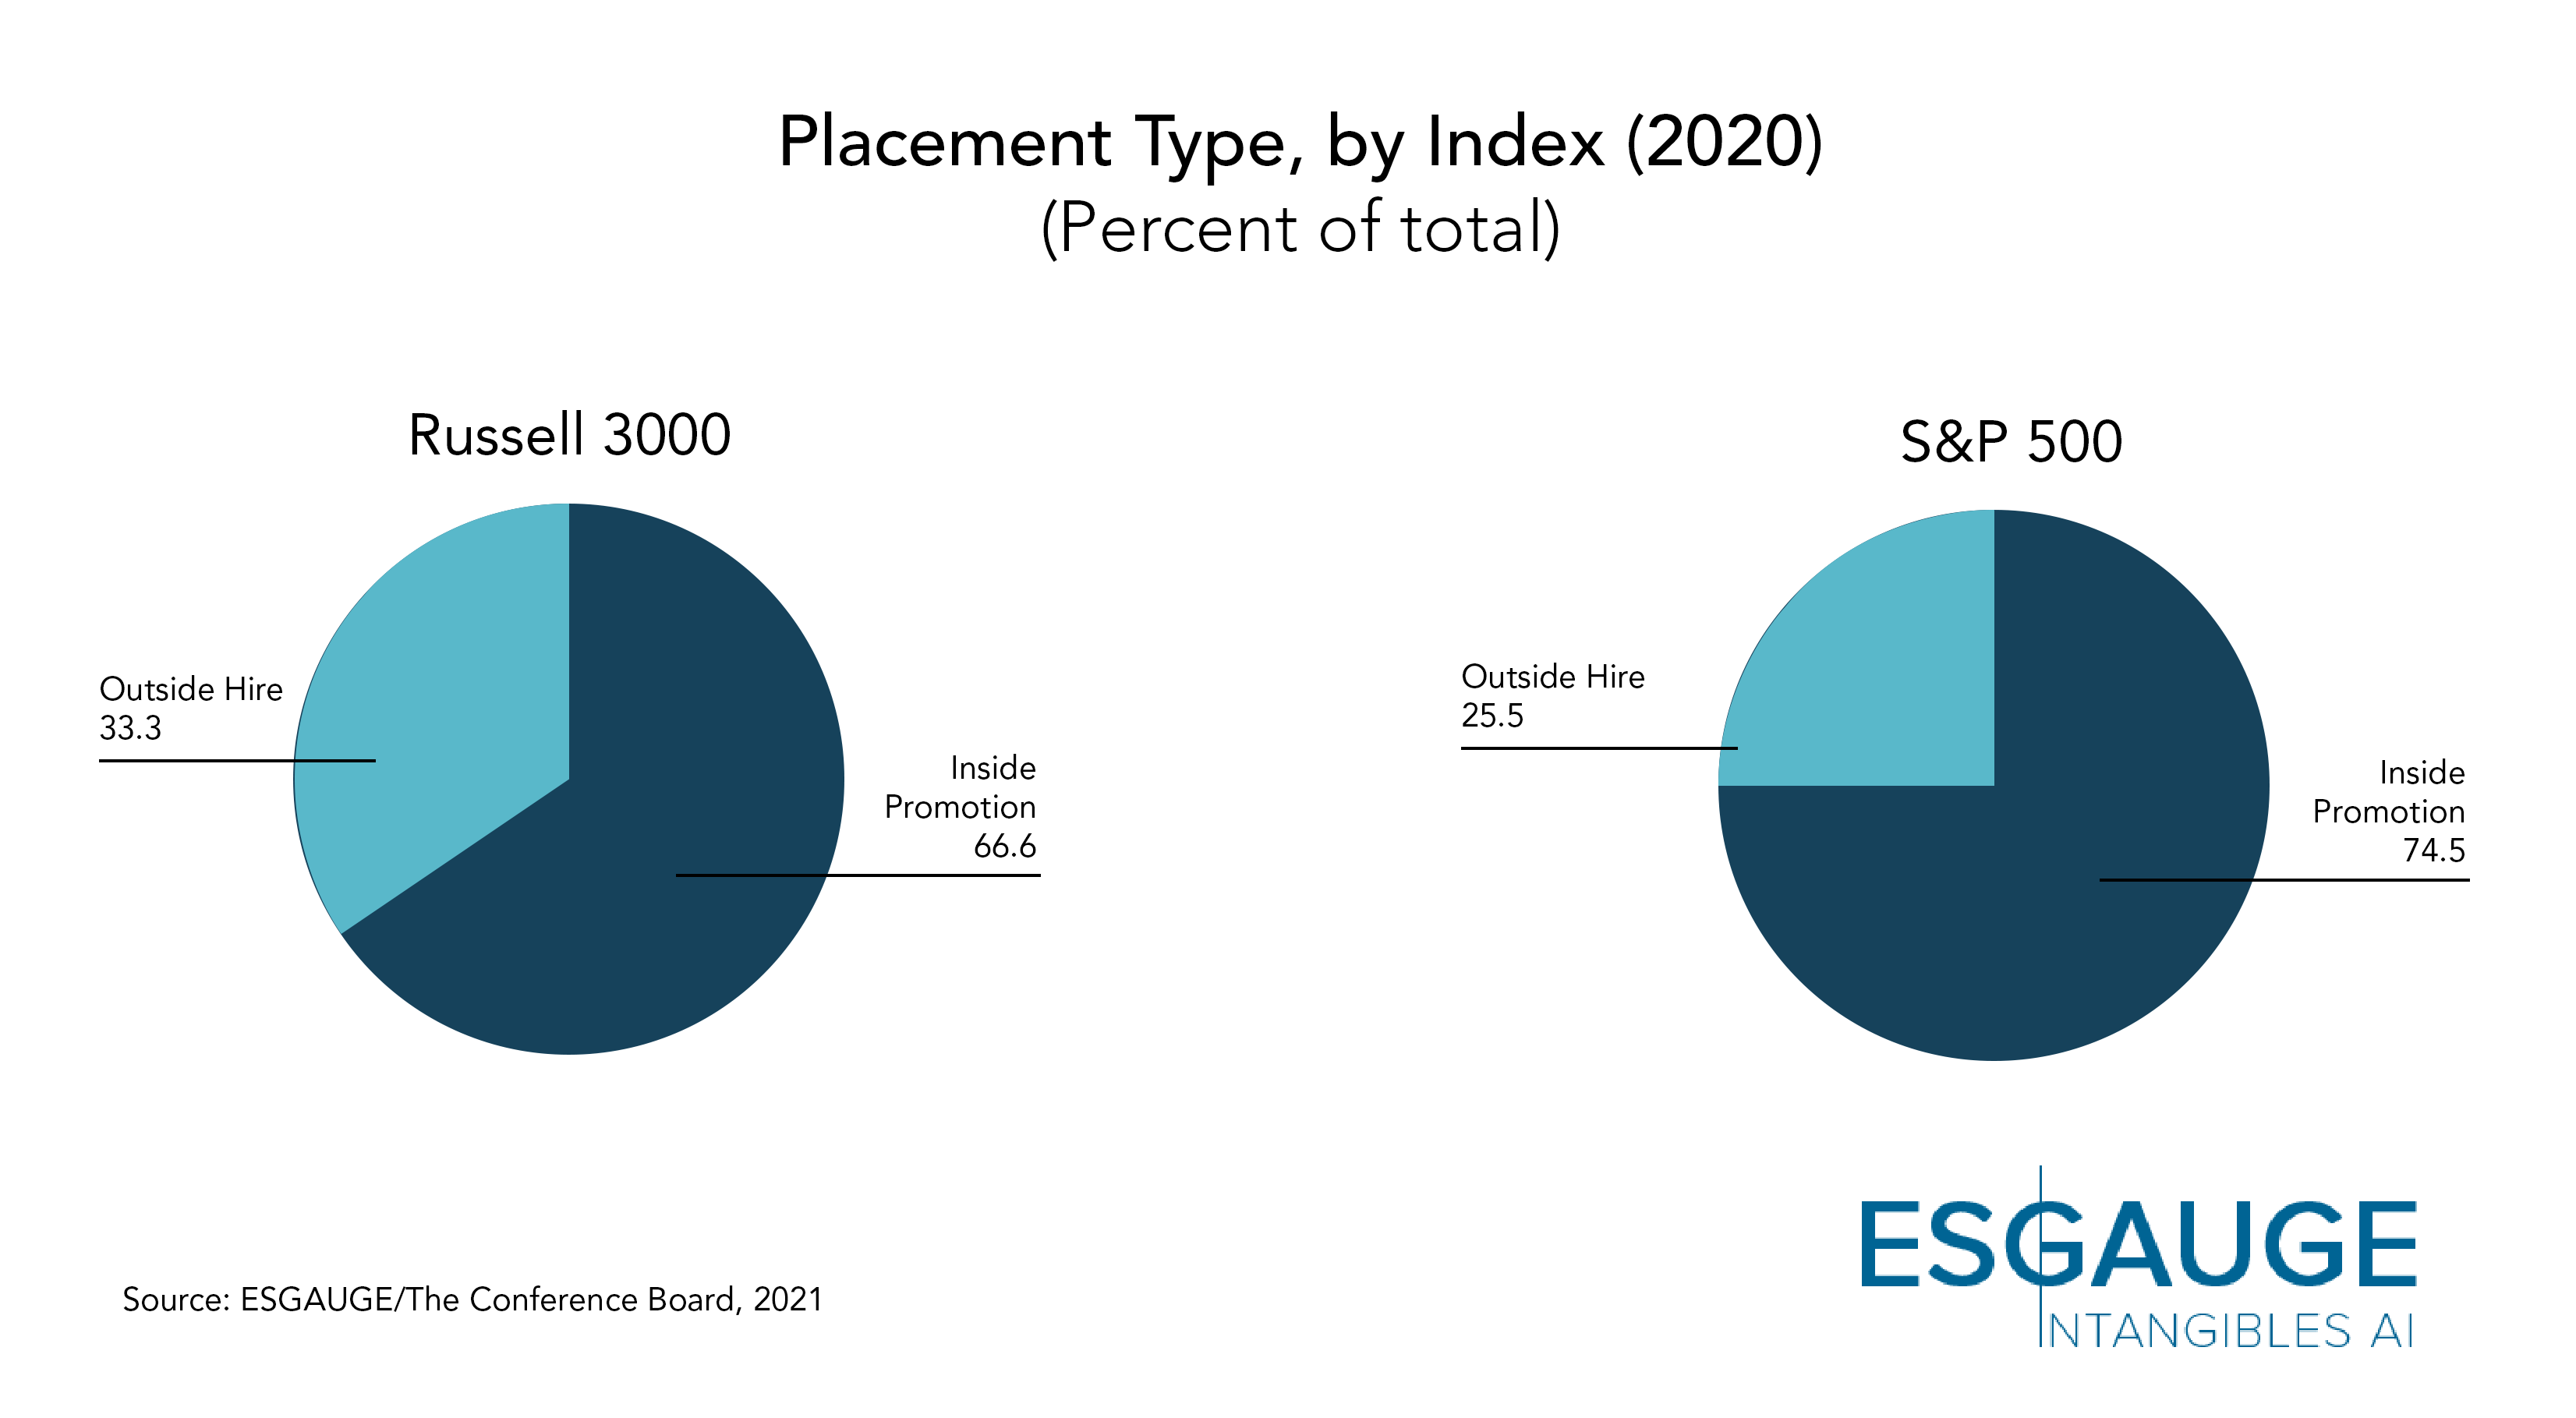
- Our analysis delved into CEO succession placement types—whether the CEOs were promoted internally or hired outside. The appointment of outsiders to the CEO position continues to be more prevalent among Russell 3000 than S&P 500 companies. In the Russell 3000, 33.3 percent of 2020 incoming CEOs were outsiders, while the remaining 66.7 percent were insiders. (For this report, an “insider” CEO is defined as an executive who served at least one year with the company before being promoted to the CEO position. An “outsider” CEO is an executive who served less than one year with the company before being elevated to the CEO position.) The numbers are lower in the S&P 500, where outsiders represented 25.5 percent of all successions in 2020, compared to 74.5 percent of insiders. The rate of 74.5 percent is in line with the ten-year rate of inside CEO appointments of 77 percent calculated for the entire 2011–2020 period.
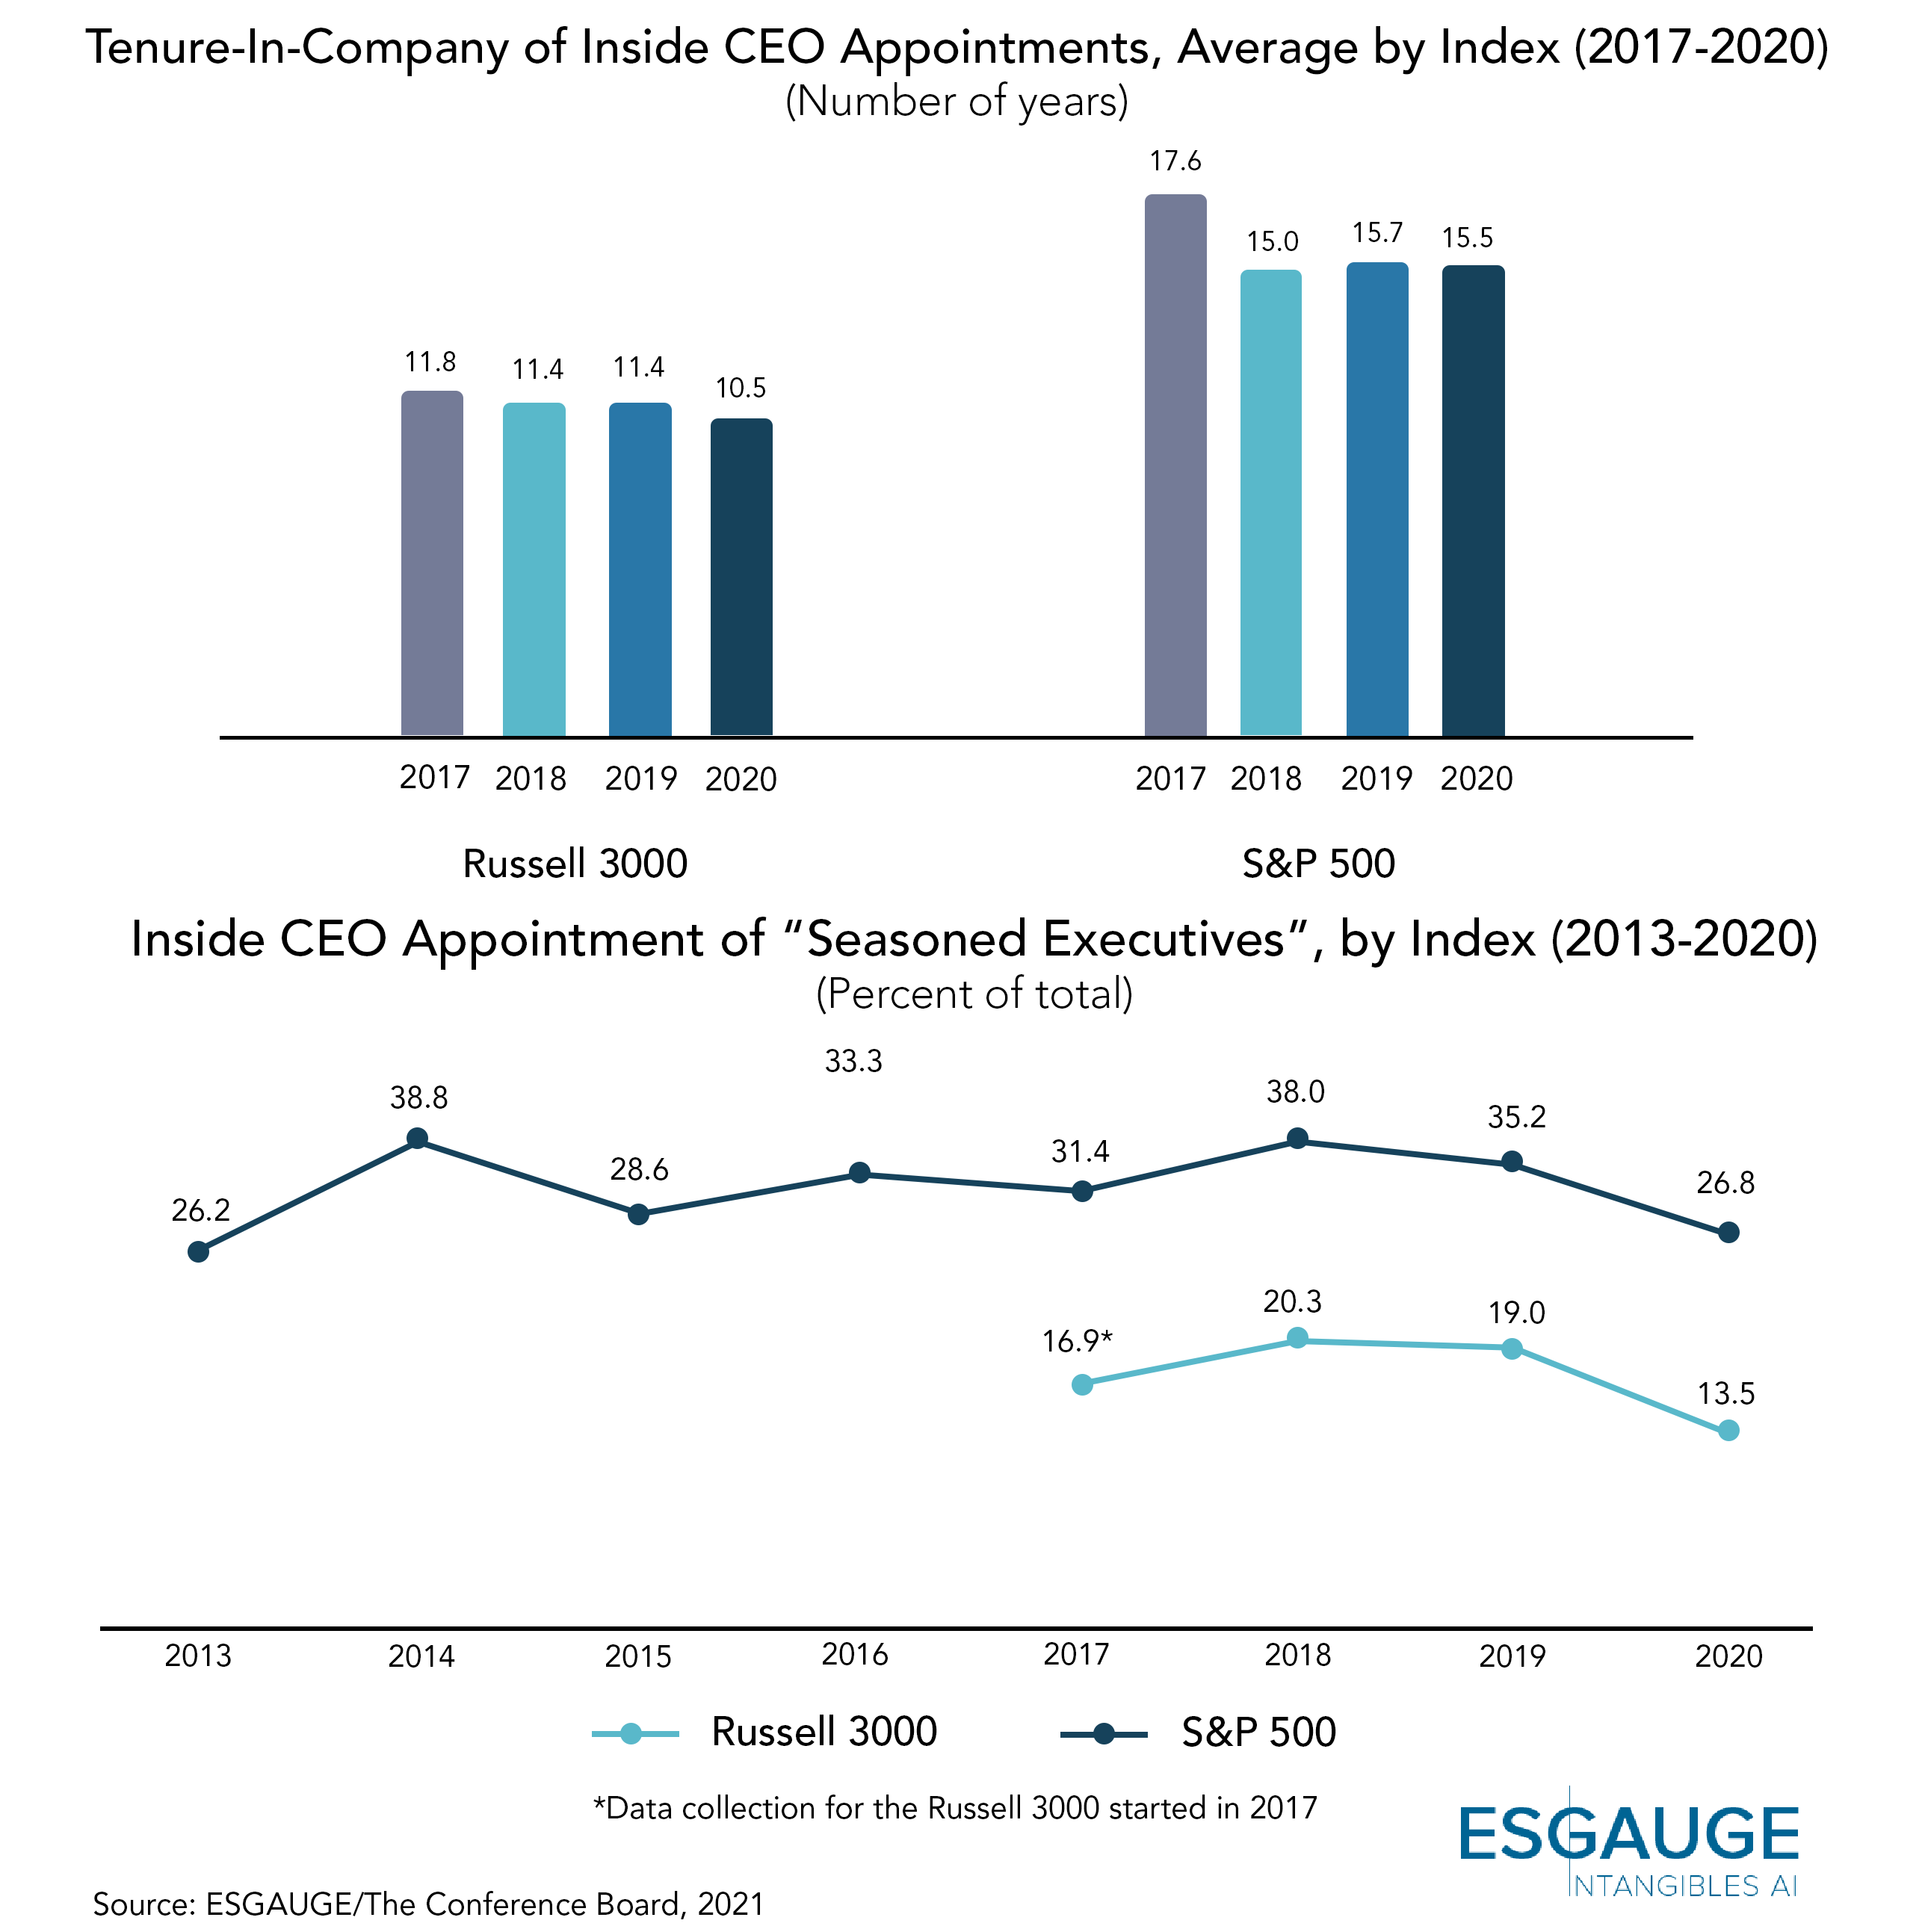
- In the Russell 3000, insiders promoted to the CEO role had an average tenure-in-company of 10.5 years in 2020, with 13.5 percent reporting a “seasoned executive” tenure, or a tenure of more than 20 years at the company. This figure compares with an average tenure-in-company of 15.5 years found in the S&P 500 index (or five years longer than their counterparts at Russell 3000 companies) and is consistent with the 20-year average of 15.5 years from 2001 to 2020. Of the 2020 insider CEOs, 26.8 percent have a seasoned executive tenure of more than 20 years with the company, which is lower than the eight-year average rate of 32.3 percent reported from 2013 to 2020.
- Cases of companies that choose to appoint a non-executive director as their next CEO continue to rise. Non-executive directors have become a significant source of CEO talent, representing 23 percent of insider CEO appointments among the Russell 3000 in 2020. The rate has been growing steadily and is the highest recorded in recent years. It was 16.4 percent in 2017, 18.9 percent in 2018, and 20.8 percent in 2019. Among the S&P 500, 14.6 percent of insider CEO appointments were serving as non-executive directors at the company—up from 10 percent and 14.3 percent in 2018 and 2017, respectively. The practice of appointing a non-executive director to the CEO role is particularly prominent among smaller companies. In 2020, 42.9 percent of inside CEO promotions at manufacturing and nonfinancial services companies with annual revenue under $100 million involved an individual who had been serving as a non-executive director at the company. The finding compares to only 25 percent of those at companies with annual revenue exceeding $50 billion and none of those with annual revenue in the $25 billion to $49.9 billion group.

- Strategic needs and talent availability in individual industries may explain the notable differences found in the sources of CEO talent across the 11 GICS business sectors. The proportion of insider CEOs who previously served as a non-executive director of the company board was highest among companies in the Health Care and Utilities sectors (44.4 percent and 36.4 percent, respectively) and lowest among companies in the Real Estate sector (9.1 percent). In 2020, there were no instances of such type of insider CEO appointments in the Energy or Communication Services sectors. The average tenure-in-company of an insider CEO appointment was highest among Consumer Staples (21.1 years) and Utilities (16.1 years) and lowest among companies in the Health Care (5.5 years) and Real Estate sector (8.4 years).
Endnotes
1Matteo Tonello and Jason Schloetzer, CEO Succession Practices in the Russell 3000 and S&P 500: 2020 Edition, The Conference Board, Research Report, December 2020.(go back)
2Gad Levanon et al., US Labor Shortages: Challenges and Solutions, The Conference Board, Research Report, January 2020.(go back)
3Global Study: C-Suite Execs Experienced More Mental Health Challenges Than Their Employees in Wake of Global Pandemic, Press Release, Oracle, February 3, 2021. The findings are based on a survey of more than 12,000 executives around the world.(go back)
4Specific attention to leadership development practices is dedicated in the 2019 edition, where the analysis of succession events is complemented with findings from a survey of corporate secretaries, general counsel, human resources officers and investor relations officers. See Matteo Tonello, Jason Schloetzer, and Gary Larkin, CEO Succession Practices: 2019 Edition, The Conference Board, Research Report, November 2019.(go back)
5See, for example, Matteo Tonello, 2021 Proxy Season Preview and Shareholder Voting Trends (2017-2020), The Conference Board, Research Report, January 2021, which discusses the rising volume of shareholder resolutions filed by institutional investors and other shareholders to request changes to corporations’ environmental and social policies, including in the area of human capital management. Also see Paul Hodgson and Matteo Tonello, CEO and Executive Compensation Practices in the Russell 3000 and S&P 500: 2020 Edition, The Conference Board, Research Report, November 2020 for a discussion of the integration of performance metrics related to environmental, social, and governance factors (ESG) into executive compensation plans.(go back)
6The Conference Board also found that, in the aftermath of the COVID-19 pandemic, boards of directors are ascertaining more than ever business leaders’ soft-skills, including their ability to engage with empathy, with employees and other stakeholders. See Board Practices: A Look Ahead, The Conference Board, ESG Watch series, July 13, 2020.(go back)
7See Solange Charas et al., Brave New World: Creating Long-Term Value Through Human Capital Management and Disclosure, The Conference Board, Research Report, December 2020.(go back)
