Print
PrintJohn Borneman is Managing Director, Tatyana Day is Senior Consultant, and Olivia Voorhis is a Consultant at Semler Brossy Consulting Group LLC. This post is based on a Semler Brossy memorandum by Mr. Borneman, Ms. Day, Ms. Voorhis, Kevin Masini, Matthew Mazzoni, and Jennifer Teefey. Related research from the Program on Corporate Governance includes The Illusory Promise of Stakeholder Governance by Lucian A. Bebchuk and Roberto Tallarita (discussed on the Forum here); For Whom Corporate Leaders Bargain by Lucian A. Bebchuk, Kobi Kastiel, and Roberto Tallarita (discussed on the Forum here); Socially Responsible Firms by Alan Ferrell, Hao Liang, and Luc Renneboog (discussed on the Forum here); and Restoration: The Role Stakeholder Governance Must Play in Recreating a Fair and Sustainable American Economy—A Reply to Professor Rock by Leo E. Strine, Jr. (discussed on the Forum here).
“I cannot recall a time where it has been more important for companies to respond to the needs of their stakeholders. We are at a moment of tremendous economic pain. We are also at a historic crossroads on the path to racial justice—one that cannot be solved without leadership from companies.”
— Larry Fink, 2021 Letter to CEOs
At the start of the new decade, corporate engagement with environmental, social, and governance (“ESG”) issues was already accelerating—part of a large large-scale shift in corporate purpose toward responsibility to a broad group of stakeholders. 2020 had a profound impact on corporate governance and responsibility, with the pandemic shining a spotlight on health and safety and the national focus on racial justice drawing sharp attention to diversity and inclusion in corporate America.
As a result, ESG has become one of the most prominent set of issues discussed in boardrooms across the country over the past year. As stakeholder and investor focus on these issues continues to increase, corporate leadership has worked to demonstrate their commitment to progress. Inclusion of ESG metrics in incentive compensation is often seen as a key part in publicly demonstrating this commitment. As a result, ESG metrics have proliferated throughout incentive plans.
Last year, Semler Brossy began publishing an annual report series to track ESG integration in executive incentive plans, beginning with the Fortune 200. This year the report series cover the full S&P 500, a broad sample set that includes the country’s largest and highest highest-profile companies. In total, 57% of the S&P 500 companies disclose using some form of ESG to determine incentive compensation outcomes. This first report delves into key trends in the 2021 proxy season and highlights the shifts in ESG metrics over the past year. Later reports will cover insights around ESG incentive design and industry industry-specific trends.
S&P 500 Dataset
This year’s study encompasses the full S&P 500. These companies range across all industries, with a median market cap of $30B and prominent representation from financials, industrials, and healthcare. The breadth of the dataset compared to last year’s Fortune 200 study provides a more complete picture across industries and practices (including less prevalent ones) and extends the research to companies that aren’t covered in the headlines. For this first issue, we’ve examined public disclosures filed between March 2020 and March 2021. We found that 57% of the S&P 500 include an ESG metric in either the annual or long-term incentive plan.

Sustainability vs. Operational Metrics
Various measures of stakeholder interests are often categorized as “ESG.” However, many of these metrics do not explicitly relate to progress toward the long-term, broad sustainability objectives that are at the center of more recent shareholder demands. For the purpose of this distinction, we have split ESG metrics into two categories:
| Sustainability ESG Metrics
Measures concerned with longer-term, broad social / economic stability |
Operational ESG Metrics
Other stakeholder metrics that are more aligned with day-to-day business results |
|---|---|
|
|
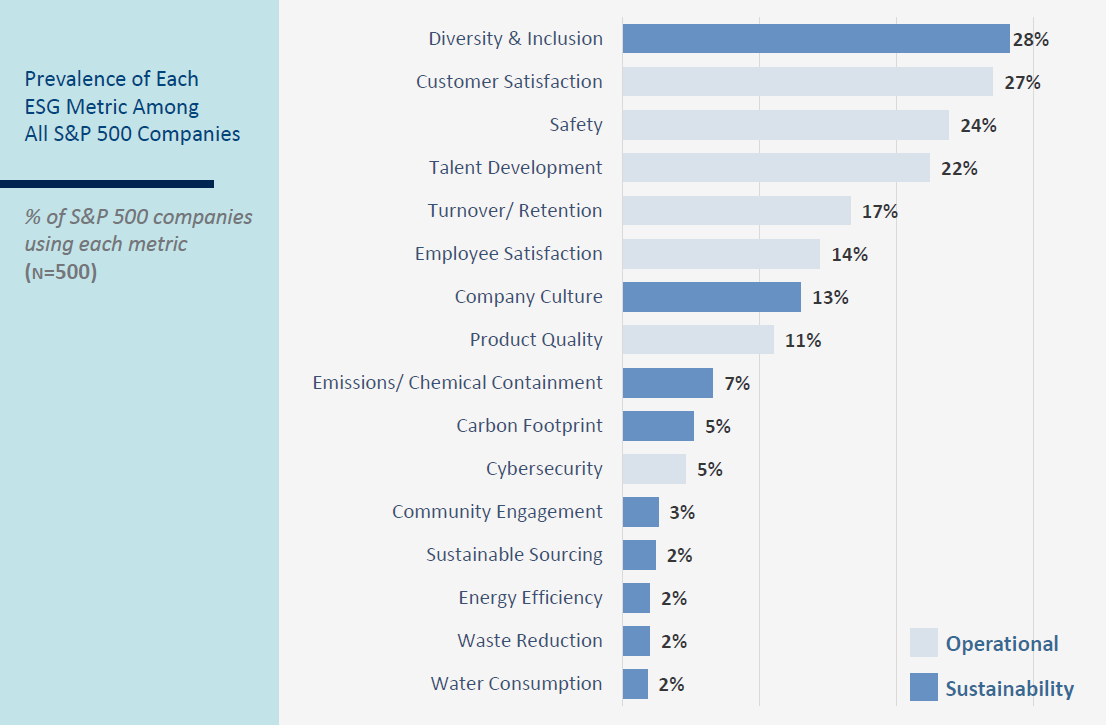
Diversity & inclusion (D&I) is now the most prevalent ESG metric included in executive compensation plans, ahead of more traditional metrics such as customer satisfaction and safety. Other human capital management metrics (i.e., talent development and retention) also fall among the top five. In total, human capital management incentive metrics are found at 41% of S&P 500 companies.
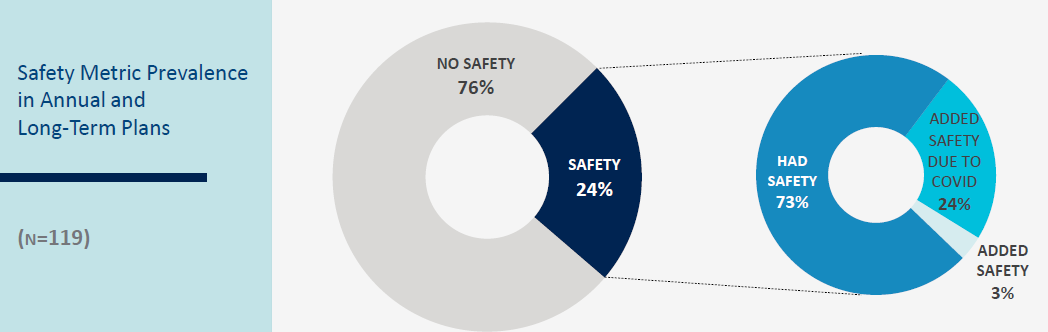
Employee safety was within the top three ESG metrics in 2020, perhaps unsurprisingly, given the increased focus on worker health and safety amidst Covid-19.
Environmental measures continue to round out the bottom of the list, with only 14% of companies including these metrics. Emissions/ chemical containment and carbon footprint are the only environmental metrics within the top 10. The low prevalence of environmental metrics is surprising given shareholder focus on climate change, and we expect these metrics’ prevalence to continue growing as investors increase calls for net zero targets and integration of ESG in compensation.
“They’re not even tea leaves anymore; there’s big block letters in front of every CEO in every company around sustainability, around diversity.”
— Ursula Burns, 2021 Teneo Insights Webinar
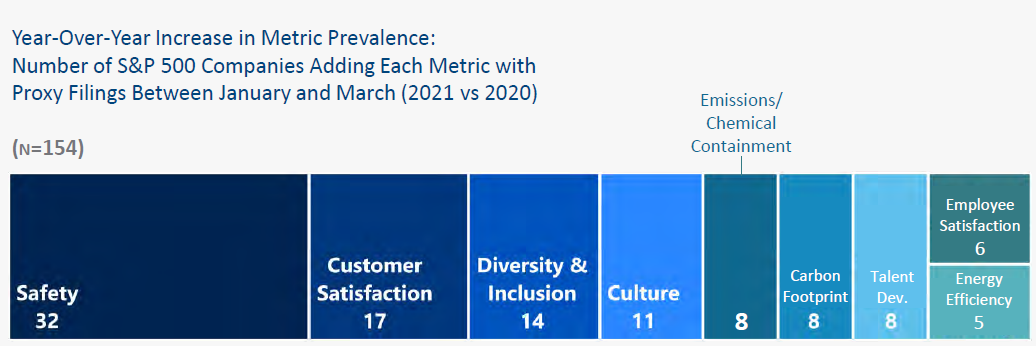
Year-over-year the most frequently added metrics were related to safety, customer satisfaction, and diversity & inclusion. Spikes in safety and customer metrics were likely driven by the response to the Covid-19 pandemic, and in the case of safety, the increased prevalence may be transitory (see next page for detail). As for the most common ESG metric in incentive plans, D&I is at the center of two distinct trends: the growing national focus on racial inequity, brought to the forefront in 2020, and the increased attention on human capital management.
Diversity and Inclusion
D&I prevalence among S&P 500 increased by 19% year-over-year for proxies filed between January and March (2021 vs. 2020). These figures do not include companies that have disclosed go-forward incentive design changes for fiscal 2021. While adding a new performance metric can take considerable time, many companies were spurred to add D&I in response to the issue’s increased focus in 2020. High-profile companies such as Nike and Starbucks have also made headlines this year for incorporating D&I in go-forward plans, and we are already seeing continued proliferation of D&I incentive metrics in fiscal 2021.
The rapidity of the metric’s adoption hints at its design. Perceived difficulties around measurement, target-setting, and disclosing performance likely delayed D&I’s initial adoption, but many companies now appear to be adding it as a more qualitative component, whether as part of individual goals or as a discretionary modifier. We anticipate that over time, more experience with measuring, managing, and disclosing D&I goals, along with investor and public sentiment, may pressure companies to design and disclose more quantitative measures.
Impact of COVID-19 on ESG Metrics
Most companies that adopted safety measures in response to Covid-19 incorporated the metric as part of the individual performance assessment rather than as an ongoing, weighted component
Although the Covid-19 pandemic began after many companies had already set goals, in many cases it had a profound impact on the incentives for fiscal 2020. Most notably, the pandemic increased the need for and use of discretion in determining incentive outcomes at many companies. Given the year’s extreme macro-economic volatility and the disruptions to company plans, boards were forced to consider a wide range of non-standard metrics and KPIs in judging executive performance. The broader uncertainty and shift toward working from home also impacted ESG.
Safety metrics registered one of the largest year-over-year increases for fiscal 2020, with 89% of those added explicitly tied to the response to Covid-19. The significant increase demonstrates both how rapidly metrics can evolve and how discretionary measurement can be. Nearly all Covid-related safety additions were incorporated into individual components, implying that boards considered the company’s treatment of employees during the pandemic (i.e., employee health and safety) in a retrospective assessment of executive performance. As a result, we do not anticipate that the increase in the use of safety measures will be permanent.
While the fact that Covid-19 drove such a large portion of safety adoption may make the focus on employee wellbeing seem transient, the movement is also part of a broader ESG trend around responsibility to a broader group of stakeholders. Many more companies felt the need to disclose their approach to employee wellbeing than they have in the past, particularly as investors have called on companies to demonstrate their responsiveness to all stakeholders.

ESG Metric Use by Revenue Size
The largest companies use ESG metrics more frequently, with 62% incorporating ESG compared to 55% of smaller companies. Larger companies also focus more on sustainability vs. operational measures
The broader sample set this year allows us to examine whether the largest, highest-profile companies integrate ESG differently from smaller ones. The chart above compares the prevalence of each metric for the largest 200 companies by revenue vs. the smallest 300 in the S&P 500.
One of the first differences to emerge is in overall prevalence: 62% of the largest 200 companies incorporate ESG, compared to 55% for the smaller 300. This follows expectations—high-profile companies are often among the first to adopt new governance trends and face more public scrutiny.
Differences also emerge in the types of metrics. Larger companies more frequently included talent-, culture-, and environment-related metrics, while smaller ones focused more on traditional operational measures such as customer satisfaction and product quality. Larger companies may also compete more fiercely for top talent, leading to the focus on more talent-related metrics.
Over time we anticipate that ESG metrics will become more common across all public companies, regardless of size, as the practices of the largest companies often influence the rest of the market.
Conclusion
Subsequent ESG + Incentives reports will incorporate findings from recent proxy filings and address how ESG metrics vary across industries
When looking at the fiscal 2020 proxy season updates, it’s clear that the form of ESG in compensation plans is highly influenced by broad external trends. Some of the changes are circumstantial and will likely revert to original levels next year, as evidenced by the quick incorporation of employee safety across a range of individual performance evaluations. Others are part of longer-term trends that are here to stay. D&I measures continued to grow and are expected to accelerate in adoption as both investors and the general public increase pressures for greater transparency, attention, and progress on the core issues. Environmental sustainability metrics, while remaining a rarity in incentive plans, also presented some movement and we expect their inclusion to increase over time as investors become more focused in their demands. Boards should move with caution—as with any other new metric, a board should craft ESG metrics to reflect the company’s context and priorities—but they should move.* As measurement and disclosure of the issues becomes more robust and standardized across firms, including ESG metrics in incentives will likely become the expectation for most compensation programs.
*See Moving Cautiously on ESG in Compensation for a more complete discussion of the considerations for implementing ESG metrics in incentives.
Case Studies
Diversity and Inclusion
Diversity and inclusion became one of the most talked-about metrics in 2020, with social unrest accelerating a trend already well underway. Many notable companies added or enhanced D&I in 2020 and continue to do so, with companies such as McDonald’s, Chipotle, and Starbucks, disclosing go-forward D&I metrics for 2021. The examples below highlight the quantitative, standalone designs that we expect to become more common and prominent for these metrics going forward.
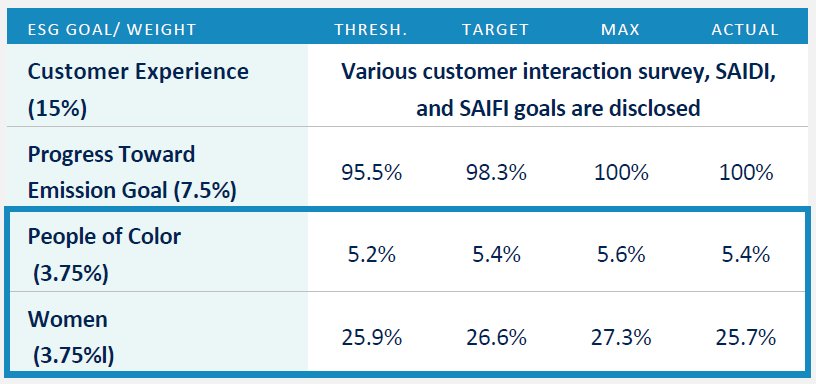
Alliant Energy
30% of Alliant’s annual incentive pool is tied to customer experience, environmental, and D&I goals. Specific weightings, targets, and achievement are disclosed for each.
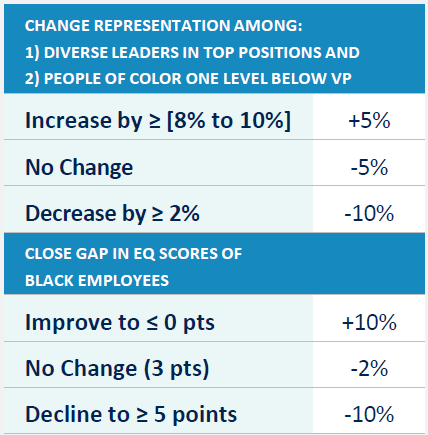
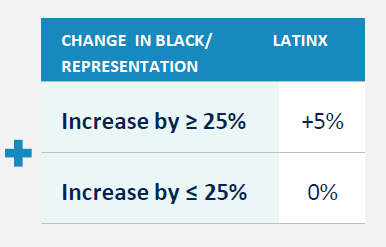
Prudential Financial
Prudential includes a D&I modifier (±10%) on performance shares. While originally targeted for improving representation among senior management, the metric has been expanded in 2021 to focus on all organizational levels. Representation and engagement goals are quantitative and “no change” results in a negative modifier.