 Print
PrintMike Kesner, Brian Lane, and Tara Tays are partners at Pay Governance LLC. This post is based on their Pay Governance memorandum.
Pay Governance reviewed 368 initial public offerings (IPOs) in 2021 to understand equity program practices which included: dilution at IPO, new share pools, evergreen provisions, and overhang levels.
Companies typically enter into an IPO with pre-IPO equity awards to management/employees representing approximately 5.4% of shares outstanding (commonly referred to as dilution).
Virtually all companies request additional shares for a new equity plan prior to or at IPO, with the typical new share request representing 8.2% of fully-diluted shares outstanding.
Within these new equity programs, the vast majority of IPOs in 2021 (73% across all IPOs as well as 85% and 90% among Biotech/Pharma and Tech IPOs, respectively) included an automatic annual refresh provision (i.e., an evergreen).
Our analysis found considerable differences by industry, with certain industries — namely, Bio-Tech/Pharma, Health Care Equipment/Services and Tech — leading others in terms of equity dilution and overhang.
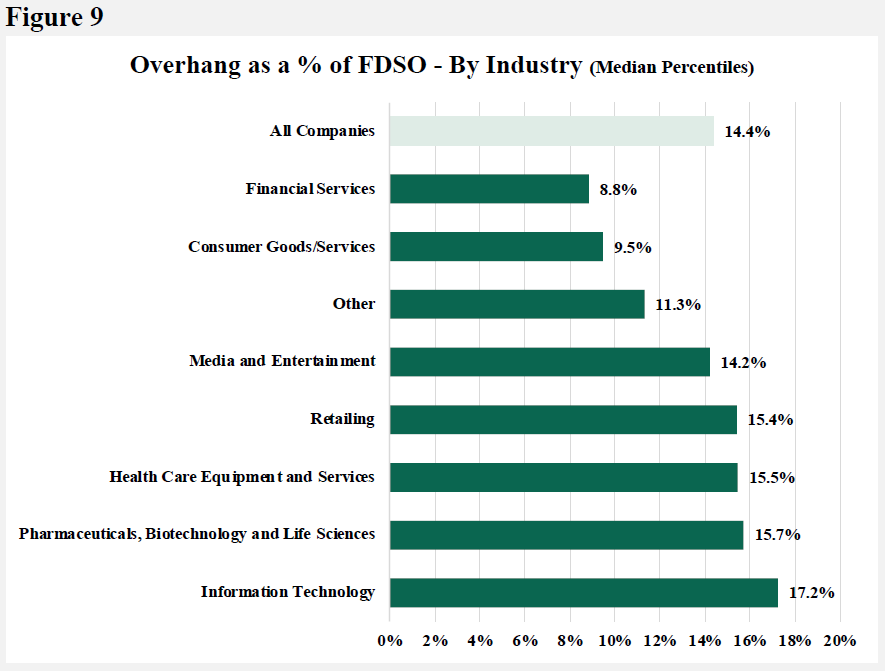
For example, Tech companies had the highest overhang (17.2%) and Financial Services had the lowest overhang (8.8%) at IPO, with median overhang for all 368 companies at 14.4%.
Conversely, our research showed that market capitalization appears not to be a significant factor in differentiating equity award pools although Boards typically factor in relative size when making equity pool decisions.
Introduction
The initial public offering (IPO) market has seen unprecedented activity in 2021. According to Nasdaq’s IPO Calendar database, there were 1,043 U.S. public offerings between January 1, 2021 and December 31, 2021 (includes micro and small caps), with 289 of these offerings listed on the New York Stock Exchange, 754 listed on Nasdaq Exchange, and total equity raised just shy of $334 billion. By comparison, in all of 2020, listings on these exchanges raised $158 billion (less than half of 2021’s aggregate value). While there has been a 119% increase in the number of companies that went public in 2021, there are likely many others that started their public offering journey with expectations for a potential 2022 IPO (though we predict that 2022 IPO activity will likely be lower than 2021 given current macroeconomic and geopolitical uncertainties). If an IPO is on the horizon, we believe early planning for compensation program decisions can help smooth the intensive transition process. See our earlier post for an overview of the key compensation related areas for management and board members to consider.
Several key terms are referenced throughout this post— see below for specific definitions.
Key Definitions for this Post
- Dilution—sum of stock options and full-value shares outstanding divided by post-IPO fully diluted shares outstanding
- Fully-diluted Shares Outstanding—sum of common shares outstanding, equity awards outstanding, and shares remaining in equity plan reserve (for the purposes of this post, we have not included warrants or other convertible securities)
- Overhang—sum of stock options and full value shares outstanding, plus new share pool reserve, divided by post-IPO fully diluted shares outstanding
One of the most important areas of focus for companies facing the transition from private to public company status is their equity compensation program strategy. The current red-hot talent market heightens the need for flexibility to grant equity awards to attract, motivate, and retain talent while acknowledging public company norms and governance environment.
When developing a public company equity strategy and establishing a new equity plan, including the initial reserve and other features, companies must balance several external and internal considerations. External factors include prevailing governance norms as well as competitive data from similarly situated recent IPO companies or industry peers, and internal factors include projected equity needs, headcount growth expectations, desired compensation philosophy with respect to cash vs. equity, and managing dilution and share usage levels.
To better understand some of these external factors and prevailing practices among recent IPOs, Pay Governance researched 386 public offerings from January 1, 2021 through December 31, 2021. More specifically, we examined key aspects of these companies’ equity plans, including new shares reserved for issuance, equity dilution and overhang at the time of IPO, and the prevalence of automatic share refresh (i.e., evergreen) provisions. Further, we analyzed the data for notable differences based on market capitalization and industry. A follow-up post will address equity granting practices, including the issuance of equity award grants leading up to or at IPO and the types of awards granted.
In addressing key equity program considerations, one approach we encourage includes the following steps:
- Understand current outstanding equity and expected level of dilution at IPO.
- Review remaining shares available for grant in existing equity plan(s) and understand/decide whether the shares are cancelled or rolled over into a new equity plan. Our research found the amount of available shares is typically relatively low at the time of IPO, but this varies widely by company.
- Project expected equity needs for the first several years as a public company to establish the required new share reserve and evergreen provision.
- Compare aggregate equity pool requirement and resulting total overhang to competitive information for reasonableness.
Summary of Key Findings
Our research revealed several interesting findings which are summarized below:

Dilution at IPO
- Founders and investors use dilution to understand how equity awards to employees could dilute the value of their ownership. Our research shows the median dilution from outstanding equity among IPO companies equaled 5.4%.
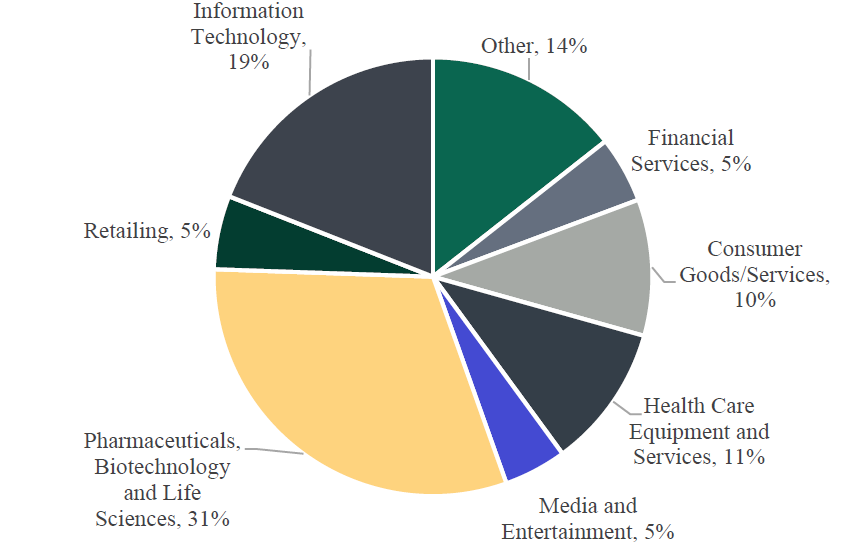
- As summarized in Figure 2, dilution levels vary based on industry. The industries with the highest dilution were Heath Care Equipment/Services, Retailing, Tech, and Bio-Tech/Pharma, while Financial Services and Consumer Goods/Services had the lowest dilution levels.
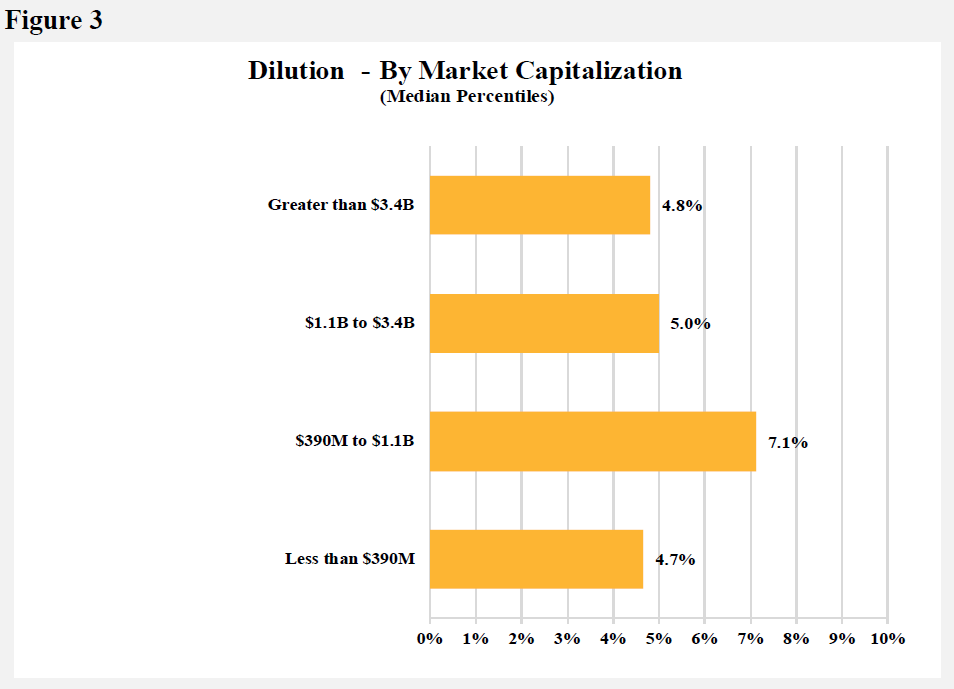
- There is a significant variance in dilution levels based on industry; however, it does not appear dilution levels vary much based on market capitalization other than the $390 million to $1.1 billion market capitalization range. This variance is attributable to a sizable number of Bio-Tech/Pharma industry companies (~62%) who have high levels of dilution within this market cap range. (See Figure 3.)
New Share Requests
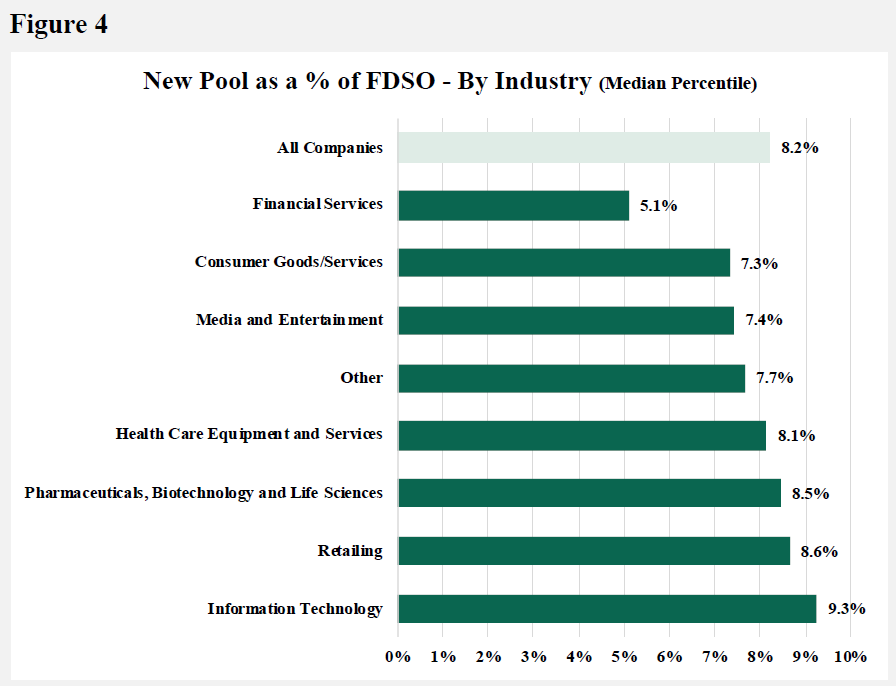
- The median share request for newly funded equity plans equaled 8.2% of fully diluted shares outstanding.
- To no surprise, Tech companies’ new share requests were the highest (as a percentage of fully diluted shares outstanding), while Financial Services had the lowest. (See Figure 4.)
- Interestingly, new share pools did not vary significantly based on companies’ market capitalization at IPO. This is in contrast to established public companies where larger market cap companies’ new share requests and dilution levels are much lower in comparison to smaller market cap companies. (See Figure 5.)

Evergreen Provisions
- Evergreen provisions are frowned upon by proxy advisory firms and some institutional investors, which can make it difficult for an existing public company to obtain significant shareholder support for a new equity plan that includes an evergreen provision. Newly public companies, however, only need to have their pre-IPO shareholders approve an equity plan with an evergreen provision, and it appears from the data many recent IPO companies have included this provision.
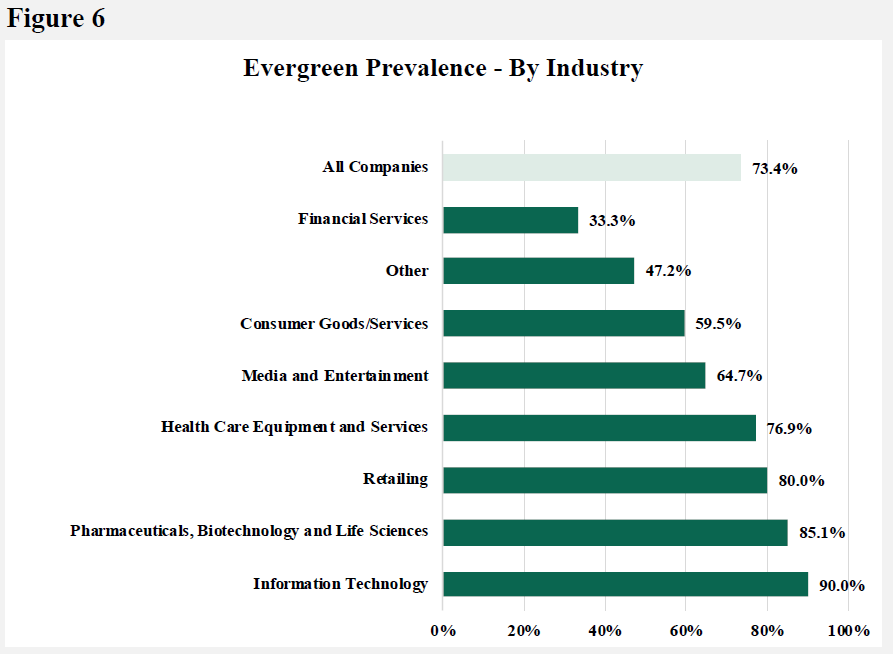
- Among companies that went public in 2021, 73.4% included an evergreen provision in their long-term incentive plan document. They are especially common among Tech, Bio-Tech/Pharma, and Retail companies with approximately 85.0% prevalence (on average). Evergreens are less prevalent among Financial Services companies. (See Figure 6.)
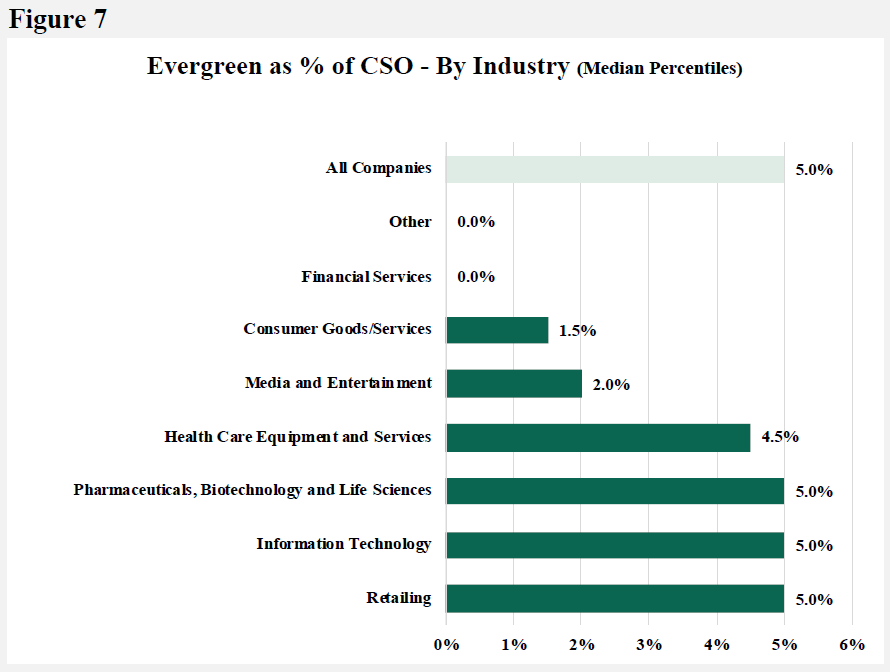
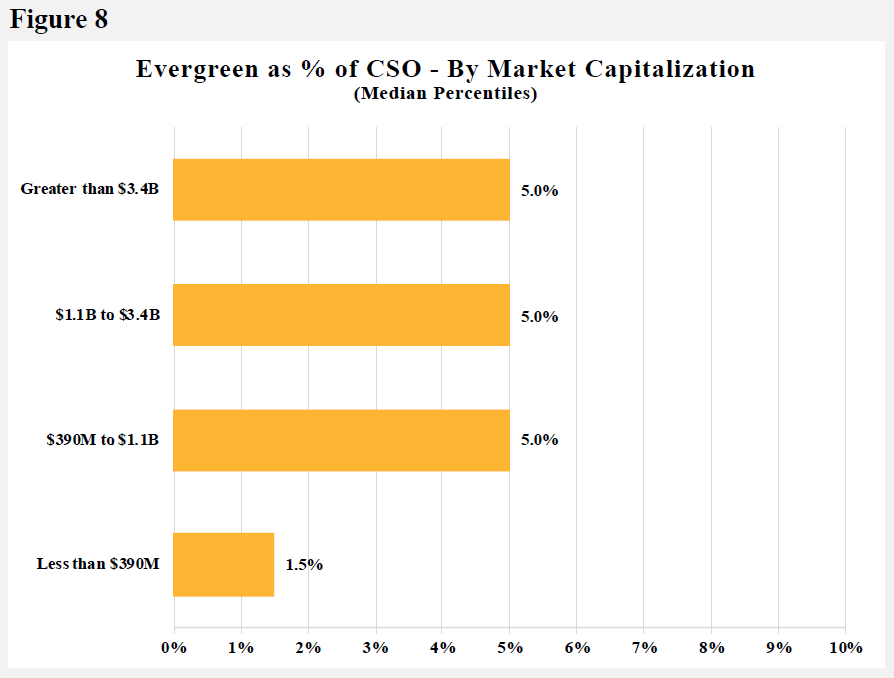
- The median evergreen refresh percentage was 5.0% of common stock outstanding (CSO) across all industries; however, the percentage for Consumer Goods/Services and Media and Entertainment was considerably lower. The median evergreen percentage of zero for the Other and Financial Services industries stems from the fact that less than half of companies in those industries had an evergreen provision. When reviewing the median evergreen refresh rate based on market cap, the percentage of common stock outstanding remained about the same (5.0%). (See Figures 7 and 8.)
- Over half (74%) of evergreen provisions were established for 10 years, the maximum allowed period under the stock exchange listing requirements.
Overhang
- As shown in Figure 9, median overhang at IPO equaled 14.4% across all industries. Tech companies had the highest median overhang at 17.2%, while Financial Services had the lowest at 8.8%.
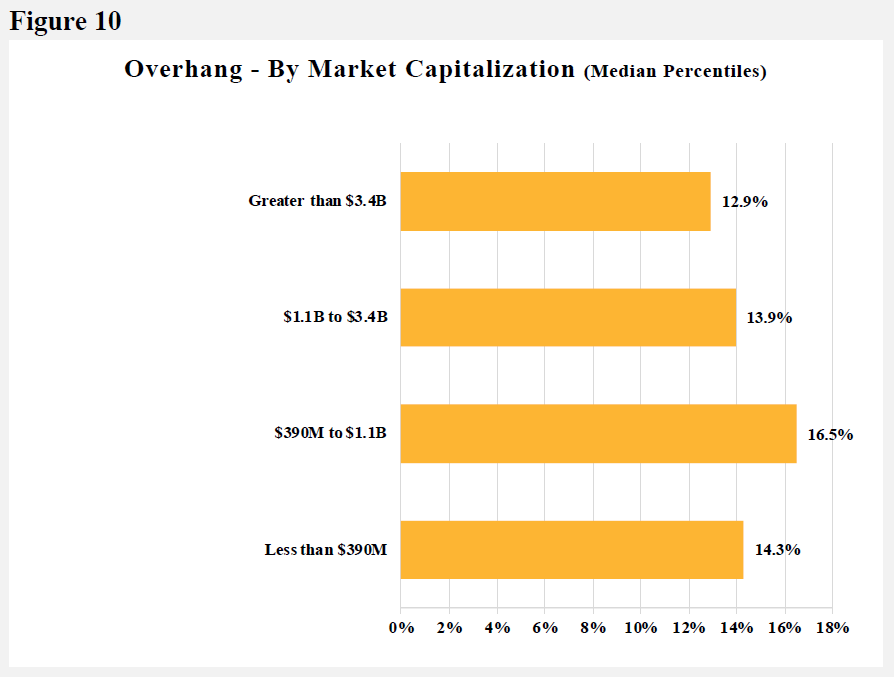
- Figure 10 shows that overhang did not vary much based on market capitalization, which is consistent with the dilution and share request data noted above. The somewhat higher median overhang level in the $390M to $1.1B market capitalization company range is attributable to the higher dilution level from Bio-Tech/Pharma companies as noted in Figure 3.
Conclusion: Balancing the internal and external perspectives
Strong IPO activity in 2021 provides companies considering a 2022 IPO with a road map for developing an equity plan, including dilution levels, the size of new share requests, and overhang at IPO, as well as the use of evergreen provisions. To achieve an appropriate balance of internal needs with external expectations, companies should first prepare a detailed multi-year projection of future equity awards based on previously authorized shares, the value of equity grants by level in the organization, current and projected headcount, analysis on the range of future stock prices, and the types of equity award vehicles that may be used (i.e., potential mix of stock options and full value shares such as restricted stock units and performance shares). Once a baseline level or range of future equity needs is established, companies should compare it to the 2021 IPO data discussed above — which varies by industry and, to a lesser extent, market capitalization — to evaluate if share needs are in line with market expectations and the company-specific conditions that require more or fewer shares.
