 Print
PrintEric Shostal is Senior Vice President of Research and Engagement, and Krishna Shah is Manager of Executive Compensation at Glass, Lewis & Co. This post is based on their Glass Lewis memorandum. Related research from the Program on Corporate Governance includes Paying for Long-Term Performance by Lucian Bebchuk and Jesse Fried (discussed on the Forum here), and The Perils and Questionable Promise of ESG-Based Compensation by Lucian Bebchuk and Roberto Tallarita (discussed on the Forum here).
Introduction
Stemming from increasing shareholder stewardship on matters of risk, investors have expanded the scope of their evaluation of companies from pure financials to include topics like human capital management, diversity, safety—the list goes on. And for good reason: research has shown a linkbetween good environmental and social (E&S) practices and strong financial performance.
To promote that link, boards are increasingly basing a portion of executive incentives on non-financial metrics that measure E&S performance. Of the $6.96 billion paid to S&P 500 CEOs in 2021, at minimum nearly $600 million (8.6%) was based on E&S performance, including approximately $515 million tied to short-term incentives (STIs) and approximately $83 million tied to long-term incentives (LTIs). Since E&S performance is often measured along with other unweighted considerations the true number could be much higher, and it is increasing.
In recent years, the percentage of U.S. companies that included some type of E&S consideration within their executive incentives has risen steadily from 16% in 2019, to 21% in 2020, and 25% in 2021. The year-on-year increases are even more stark at the top: approximately half of all S&P 500 companies included some form of E&S consideration under an incentive plan in 2021, compared to 39% in 2020.
E&S Categories
E&S metrics can take many forms, and often differ greatly from company to company and industry to industry. Glass Lewis distinguishes between the following categories of E&S metric:
|
Safety |
Metrics that consider employee safety, such as: TRIR (total recordable incident rate), DART (Days away/restricted or Transfer Rate), OSHA metrics and deaths-per-year. |
|---|---|
|
Environment |
Metrics that consider the company’s environmental impact, such as: environmental accident reports, oil spills and emission reductions. |
| Human Capital Management | Metrics that consider the company’s efforts to support their human capital, aka, their own employees, such as attracting, developing and retaining high quality employees and succession planning. |
|
Diversity |
Metrics that consider improving and/or addressing diversity in the workplace, such as: increasing gender and racial diversity in management, promoting and fostering a diverse workplace, developing and implementing programs to improve diversity. |
|
Community |
Metrics that consider the company efforts to interact with their local communities, such as contributing to charitable works or fundraising. |
|
General ESG/CSR |
Metrics that broadly account for Company sustainability efforts from a holistic perspective, including Company efforts to maintain or develop corporate governance practices, such as market best practices, or social responsibilities such as fair labor practices abroad, human rights, and anti-discrimination. |
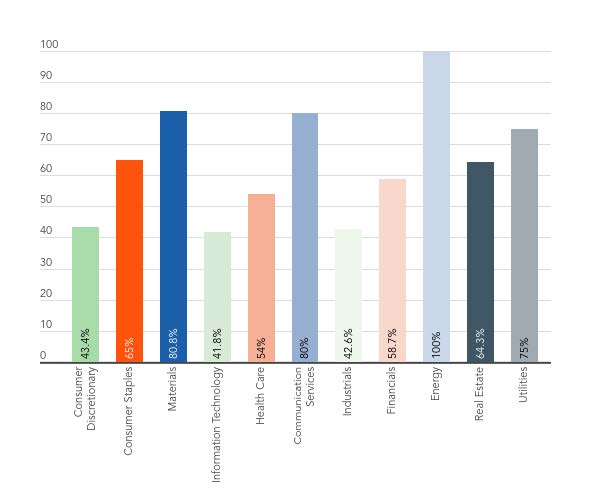
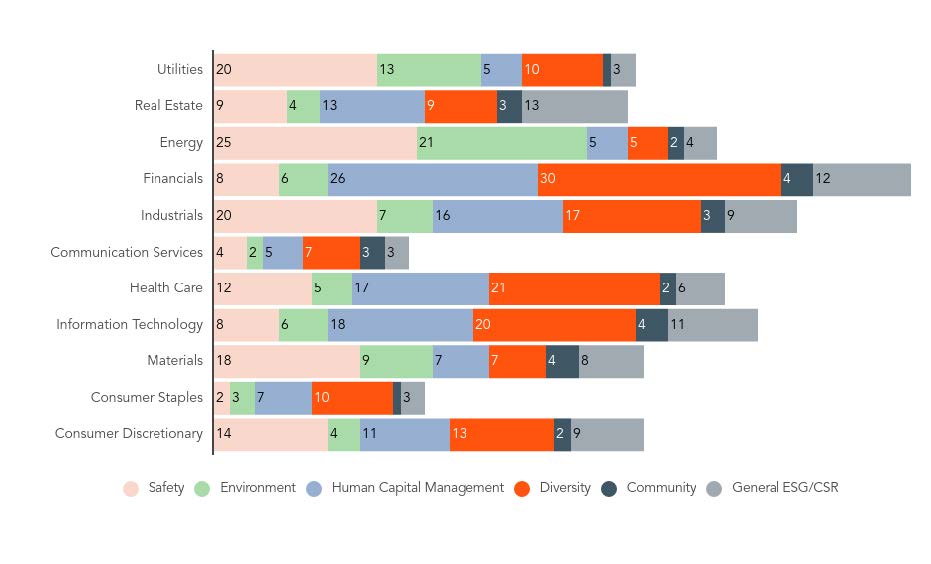
Of these categories, diversity, safety and human capital management are most commonly included as metrics. This is not wholly surprising. Safety has historically been the most popular E&S metric category due to the nature of these metrics being more quantifiable and lending themselves more easily to tracking, as well as the topic’s relevance to mining, oil and gas, and utility company operations.
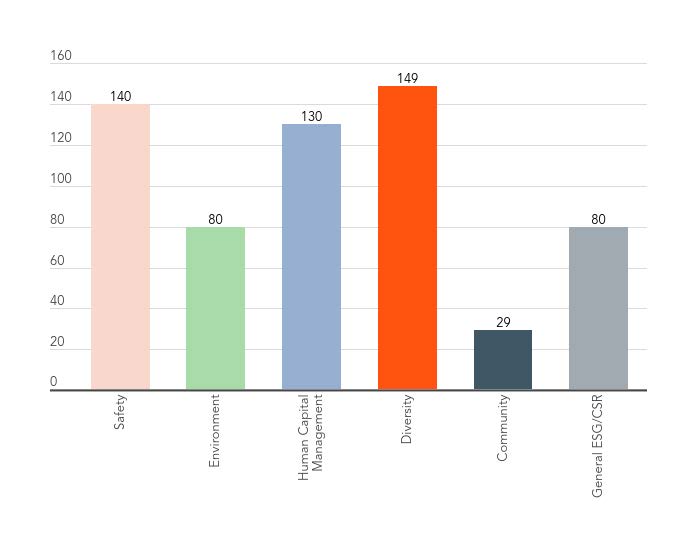
Meanwhile, issues related to diversity and the treatment of employees, as well as other stakeholders, have become increasingly important considerations for companies and their investors. Moreover, diversity considerations largely go hand in hand with human capital management as the two categories are closely linked. While Glass Lewis treats these as separate categories, we have found that companies measuring diversity are more likely to also focus on areas of human capital management, such as succession planning and developing internal talent. Of the 149 companies that considered diversity, 95 also considered separate human capital management metrics. These categories were particularly common within sectors where safety considerations are less relevant, such as communications, consumer staples, financial, health care and information technology; many of the companies in these sectors also face significant direct exposure to consumers and the public at large, enhancing reputational risk. That said, we note that diversity and human capital management metrics were also quite common within the industrials sector, and are becoming more widespread across the market.
Typical STIP Metrics: Marathon Petroleum
Marathon Petroleum’s sustainability metrics under its STIP lay out some of the most typical safety and environmental metrics used for these companies by evaluating performance against pre-determined targets related to greenhouse gas intensity, its safety performance index, process safety events rate, and designated environmental incidents (Form DEF 14A, filed March 15, 2021). These metrics make up a total of 20% of the company’s short-term incentive payouts, and are tied to $480,000 of the CEO’s target bonus. These are relatively standard safety and environmental metrics for companies in the energy, materials, industrials, or utilities sectors, incentivizing lowering of greenhouse gas intensity, improving safety accountability, and decreasing both process safety events and designated environmental incidents.
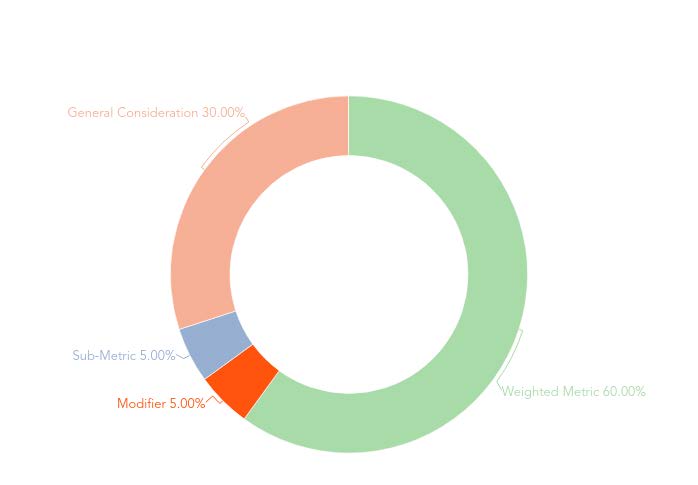
Types of E&S Metrics
Just as there are different categories of E&S performance being measured, there are a variety of different ways of measuring that performance:
- Weighted metric: Carries a specific weight, meaning performance is directly tied to a proportion of payouts for the award.
- Ex: TRIR accounts for 5% of the STIP, 5% target bonus payouts based on TRIR performance.
- Modifier: Adjusts final payouts upward or downward within specified range based on level of achievement.
- Ex: Increasing diverse representation in management positions by 5% is the goal, achievement/missing the goal can adjust final bonus payouts upward/downward by 10%.
- Sub-metric: A specified goal under a weighted overarching metric.
- Ex: Diversity goal makes up a portion of the 40% weighted strategic objectives metric.
- General consideration: The company discloses that it considers an E&S metric under a subjective metric or when determining final payouts.
- Ex: Company subjective considers diversity and inclusion initiatives when evaluating individual performance.
The way E&S metrics impact payouts differs greatly amongst these different types of metrics. Some can be subjective, such as a general consideration under an individual performance goal; some can be more objective and clearly defined, such as a weighted metric that specifically allocated 5% of a bonus payout to improving diverse representation in management roles by a specified amount; some serve as a red line, such as caps on overall payouts if there is a worker fatality.
STI vs LTI, Subjective vs Objective
When used, E&S metrics are more likely to be tied to a portion of an executive’s STI payout, rather than long-term incentive LTI payout. Indeed, while nearly half of the S&P 500 (244 companies) included an E&S consideration in their STI plan, only 20 companies used them within their performance-based LTIs.
Given that many areas of E&S performance are difficult to measure objectively, the skew towards STIs likely reflects the general tendency to avoid using subjectively determined metrics or goals, such as individual performance or strategic objectives, in LTI plans. As discussed in the examples below, the small number of companies that choose to include E&S metrics in their long-term incentives already have a more codified, less discretionary approach to capturing this performance.
Examples of LTIP Metrics: American Electric Power & Prudential Financial
Performance shares granted by American Electric Power in 2020 included a non-emitting generation capacity growth metric with a 10% weight (Form DEF 14A filed March 10, 2021). Non-emitting generation capacity includes nuclear, hydro, wind, solar, energy efficiency, demand response and storage capacity owned or contracted by the company as a percentage of total owned and contracted generation capacity. In this case, American Electric Power clearly states what this metric is incentivizing, the encouragement of management to seek and develop opportunities to increase generating capacity that does not emit CO2, thus reducing greenhouse gas emissions. The company discloses the starting percentage for the metric and discloses the goals set for the three-year performance period. The clear linkage of the metric to E&S issues and the disclosure of goals, including the baseline and discussion of why it is material to the company’s operations, reflects a relatively good level of disclosure for E&S metrics.
Prudential Financial introduced an employee diversity modifier for its 2018 performance cycle and followed up with another in 2021 (Form DEF 14A, filed March 25, 2021). The 2021 modifiers adjusted final payouts up or down by 10% depending on the increase of diverse representation among leaders in its top ~600 U.S, positions by 10%, the increase in the representation of people of color in U.S. positions one level below Vice President by 8%, and whether it was able to close the gap in employee engagement scores of black employees relative to other employees. For the first two goals, there is sub-goal that dictates that part of the goal is increasing the representation of black/LatinX employees by at least 25%.
Disclosure Coming Into Focus?
Clearly defined goals make it easy for shareholders to determine how the targets align with a company’s long-term goals and ambitions—but for many categories of E&S performance, they are still relatively rare. The majority of companies remain vague in disclosing how they measure performance related to E&S considerations, particularly when it is not a safety metric.
One representative example comes from FedEx, which includes the following as consideration under its STIP individual performance modifier: “Implement and document good faith efforts designed to ensure inclusion of females and minorities in the pool of qualified applicants for open positions and promotional opportunities, and otherwise promote FedEx’s commitment to diversity, equity, tolerance and inclusion in the workplace,” (Form DEF 14A, filed August 16, 2021). This type of disclosure, while indicating that E&S is explicitly considered, does not clearly articulate measurable goals. Rather, it suggests more of a subjective assessment.
That approach is common—for now. In recent years, Glass Lewis has observed a movement toward providing clearer disclosure of E&S metrics by stating what specific considerations and goals were reviewed. Rather than simply saying diversity is a consideration under an individual performance factor, companies are beginning to provide more specific information—for example, by detailing that one of the CEO’s goals was growing a diverse talent pool for succession planning, or stating the specific amount that is based on that area of performance. Moreover, as illustrated above, we are observing more examples of companies integrating more measurable, objective E&S measures.
The trend reflects the evolving shareholder expectations on both the board’s role in overseeing E&S factors and on executive compensation that are being communicated to public companies through investor engagements. The inclusion and disclosure of E&S metrics within the pay program is a common approach towards meeting those expectations.
Of course, that’s not the end of the discussion. Executive compensation is frequently at the top of the agenda in both engagement and proxy voting, and shareholders want to know the thought process when setting any type of incentive goals, whether or not they include E&S metrics. That interest is heightened when the metrics in question are innovative, subjective, or simply lack a clear benchmark, as is often the case with many categories of E&S performance.
As E&S metrics have become more common, and both companies and investors have more effective examples to point to, there appears to be a natural coalescing. Going forward, disclosure of specific goals, whether they are weighted, modifiers, or subjective considerations, appears to be where the market is heading.