 Print
PrintTed Jarvis is a Lead Consultant, and Jamie McGough and Donald Kalfen are Partners at Meridian Compensation Partners. This post is based on their Meridian Compensation Partners memorandum. Related research from the Program on Corporate Governance includes Paying for long-term performance (discussed on the Forum here) by Lucian Bebchuk and Jesse M. Fried.
Incentives Linked to ESG Metrics Among S&P 500 Companies
Overall Prevalence
In 2023, 73% of S&P 500 companies linked a portion of incentive compensation to the achievement of ESG metrics, up modestly from 68% in 2022. Although there is some variation by industry, a majority of companies in all sectors use one or more ESG metric in their executive incentive arrangements. However, the weighting on these metrics is low, typically 5%-15% of any short-term incentive opportunity. [ESG Incentive Practices at S&P 500 Companies]
Short-Term Incentives Remain Principal Focus
The overwhelming majority of companies using ESG metrics do so in their short-term incentive (STI) plans—71% in 2023, up from 66% in 2022. Usage of ESG metrics continues to be majority practice in all underlying industry sectors—in 6 of the S&P’s 11 industrial sectors, all companies incorporated ESG metrics in their STI plan (Communication Services, Consumer Staples, Energy, Health Care, Materials, and Utilities). The remaining 5 sectors were also strong users of ESG metrics, ranging from 92% to 97% utilization.
Alternatively, ESG in long-term incentive (LTI) plans is a distinct minority practice with only 9% of S&P 500 companies doing so. Those that do use ESG metrics in LTI plans are highly concentrated in the Utility industry (59% in 2023, up from 38% in 2022) where the focus is on Environmental metrics. Prevalence in other industries ranged from 4% (Materials) to 13% (Consumer Staples).
How ESG Metrics are Used
Unlike traditional financial and operational metrics, most ESG metrics are not individually measured and weighted. Instead, most companies use either scorecards and/or individual performance assessments.

Both approaches generally incorporate a list of undifferentiated performance measures that include an ESG metric with a variety of other operational or strategic criteria. This approach tends to reflect that many companies are either unable, or find it undesirable, to set more precise goals for these metrics and prefer instead to use judgment and discretion to assess results.
Social Metrics Predominate
Social metrics are the most prevalent ESG metric used in incentive plans. In 2023, 66% of S&P 500 companies used Social metrics, while 32% used Environmental metrics and 22% use Governance metrics. An additional 24% included metrics that crossed multiple areas, often to address ESG strategy or measure ESG scoring goals. A
Among top-10 used ESG metrics, 7 are Social, 2 Environmental and 1 Governance. With reflection, the term “Social” is a bit of a misnomer, a more precise term would be “employee-related” metrics. Among the 7 Social metrics 6 pertain to internal employee-related criteria.
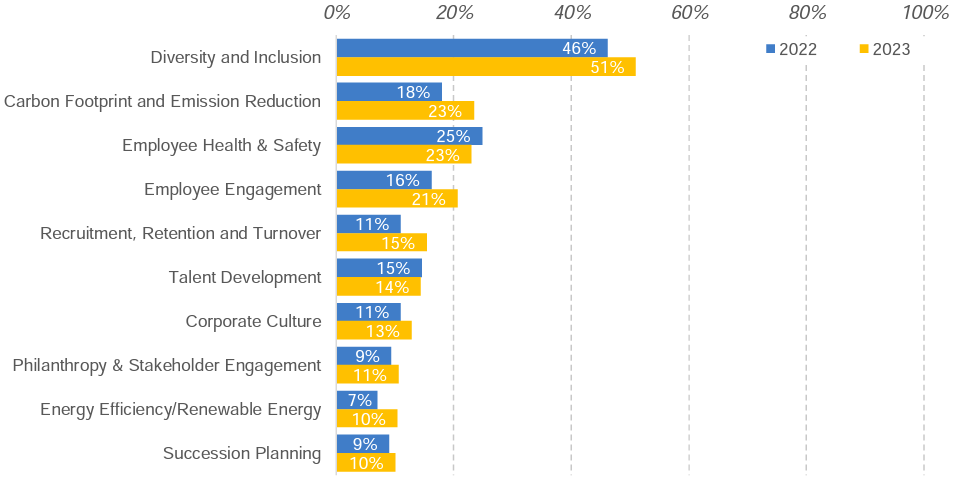
Usage of Social metrics is high across all industry groups, from 84% in the Consumer Discretionary sector to 100% in Communication Services.
Carbon Footprint and Emission Reduction is most common Environmental metric, included in 23% of all S&P 500 companies (an increase from 18% in 2022) incentive programs. No other Environmental metric exceeded 10% in prevalence.
Not surprisingly, Environmental metrics are most common in the Energy and Utilities industries (2023 prevalence of 100% and 83%, respectively) – the only sectors where inclusion of Environmental metrics was a majority practice.
Our study [ESG Incentive Practices at S&P 500 Companies] provides further details of prevalence, metrics and industry practices.
