 Print
PrintAaron Wendt is Director of U.S. Governance Policy and Krishna Shah is Director of North American Executive Compensation Research at Glass, Lewis & Co. This post is based on a Glass Lewis memorandum by Mr. Wendt, Ms. Shah, Brianna Castro, Courteney Keatinge, and Maria Vu.
Key Trends
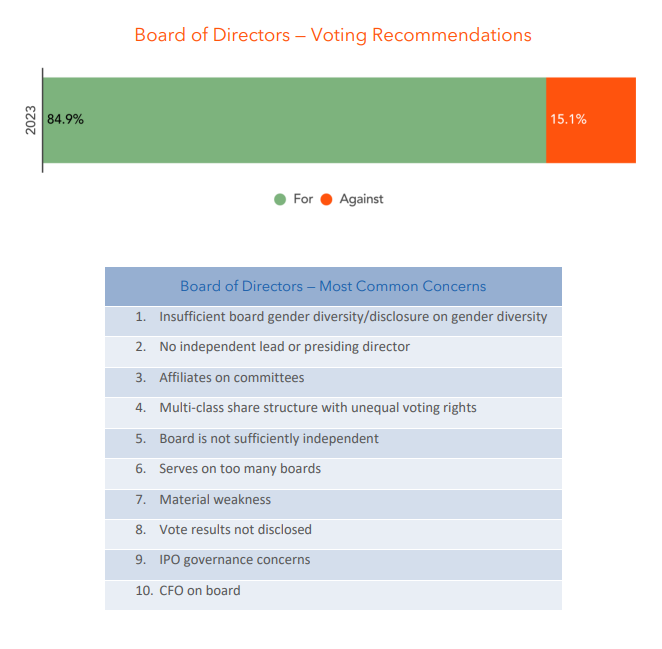
Glass Lewis continues to overwhelmingly support director elections, recommending in favor of nearly 85% of directors during the most recent proxy season
- A sharp drop in recommendations related to IPO governance concerns signals the recent IPO boom may have temporarily subsided, yet many of these newly public companies contributed to a rise in other governance concerns typically seen at less established companies, such as insufficient board independence and audit-related issues.
Problematic accounting and poor internal control over financial reporting at companies has put a strain on audit committees
- After several years of companies going public via IPO or SPAC-mergers, we observed a more than 2.5x increase in companies with concerning material weaknesses or restatements; likely due, in part, to many such companies in the early stages of developing strong internal controls.
In response to the SEC’s adoption of universal proxy and the State of Delaware allowing corporations to limit the personal liability of certain officers through “officer exculpation” provisions, a slew of companies amended governing documents
- More than 685 companies in our coverage amended advance notice bylaws in response to universal proxy, and 250 companies proposed amendments to their certificates of incorporation to adopt officer exculpation provisions.
- During proxy season, we recommended against directors at 5 companies based on egregious disclosure requirements in advance notice provisions. We initially recommended on that same basis against directors at 4 additional companies which later removed egregious disclosure requirements, leading us to update our recommendation.
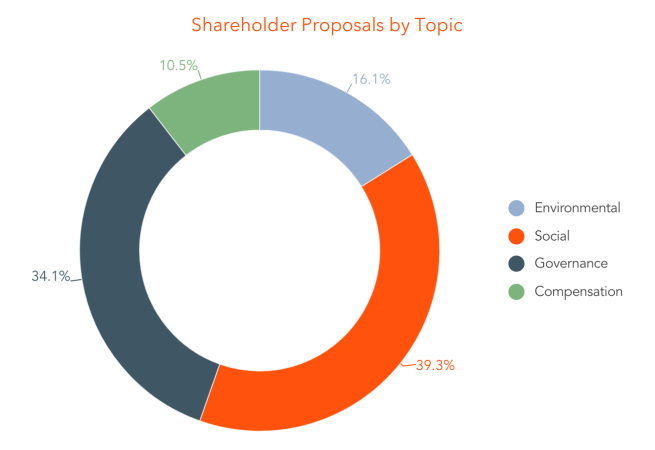
More shareholder proposals, but lower shareholder support
- There was a 12% increase in the number of shareholder proposals that went to a vote in 2023, which followed a 30% increase the previous year. The increase has been driven by both regulatory changes allowing more proposals to go to a vote and by an increasing focus from investors on ESG related issues.
- Average investor support for shareholder proposals has dropped significantly in recent years, to 23% in 2023, down from 31% last year and 36% in 2021. The decline in shareholder support was seen across all categories of proposals.
- For the first time, governance-related proposals were not the most frequent type of proposal that went to a vote, having been outnumbered by social-related proposals. The drop in corporate governance-related proposals, which often receive significant shareholder support, is part of the reason for the decline in overall shareholder support.
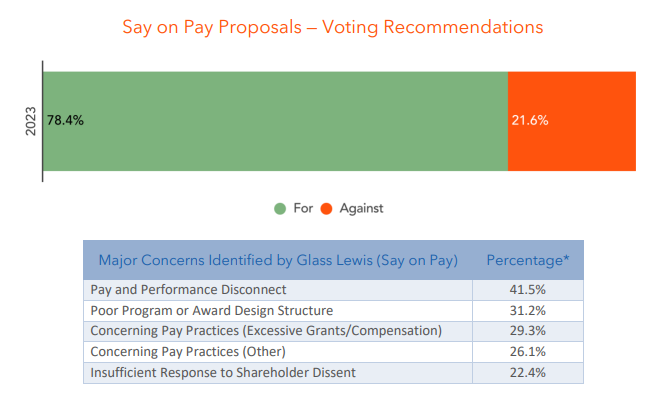
Shareholder disapproval for different types of compensation-related management proposals trended in opposing directions in 2023.
- The percentage of failed say-on-pay proposals was down from 3.0% in 2022 to 2.3% in 2023. A late season spike in failed proposals from constituents of the S&P 500 Index was not enough to make up for the dip in overall shareholder opposition to executive pay practices.
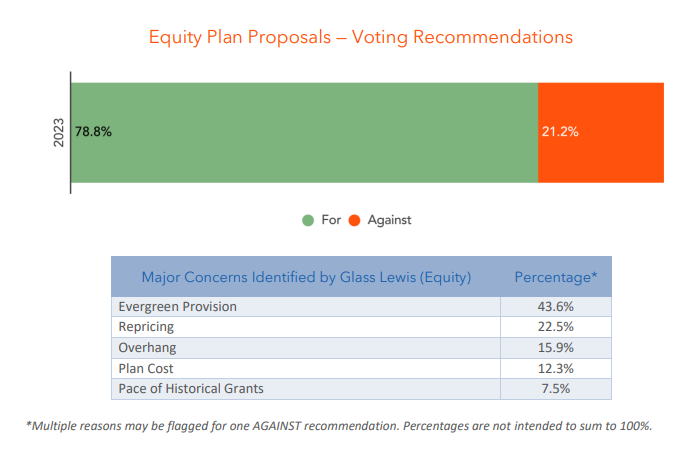
- The number of equity plan proposals that failed to receive majority support rose to its highest level in at least five years, more than doubling the number of failures during the 2022 proxy season for these binding votes.
- Problematic board decisions to shield equity plan award recipients from the loss in share value may have had shareholders on edge when weighing equity plan proposals. At a time of continued market volatility, the practice of rescuing underwater stock options through repricing and exchange programs — in some cases without shareholder approval — increased.
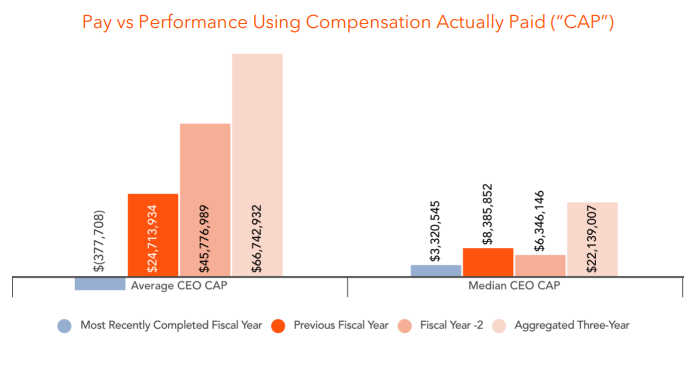
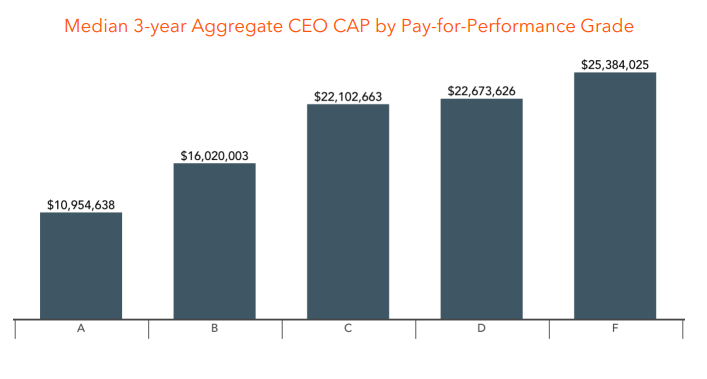
With the SEC’s new pay vs. performance disclosure rules, shareholders got their first look at compensation actually paid (“CAP”) compared to TSR performance
- While over one-fifth of companies show negative CEO CAP for the most recent fiscal year completed, the percentage substantially decreases when the annual amounts for the three-year reporting period are aggregated (from 22% to 1%).
- The median of three-year aggregated CEO CAP amounts increased with the severity of the disconnect between pay and performance, using Glass Lewis methodology (F grades have a higher median CEO CAP than D grades, and D grades have a higher median than C grades, and so on).
Data Highlights
Glass Lewis Voting Recommendations & Concern
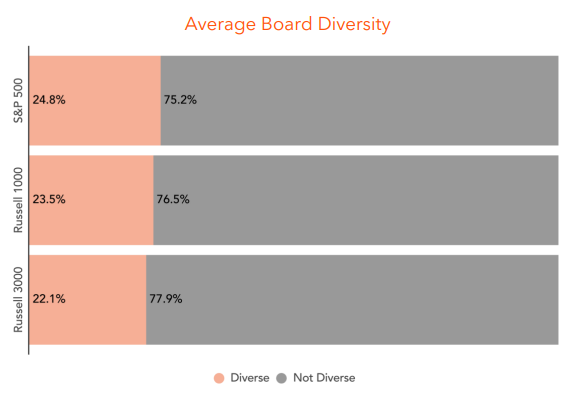
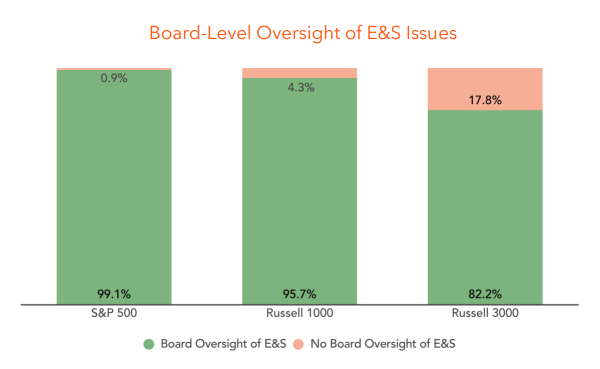
Board Composition & Oversight
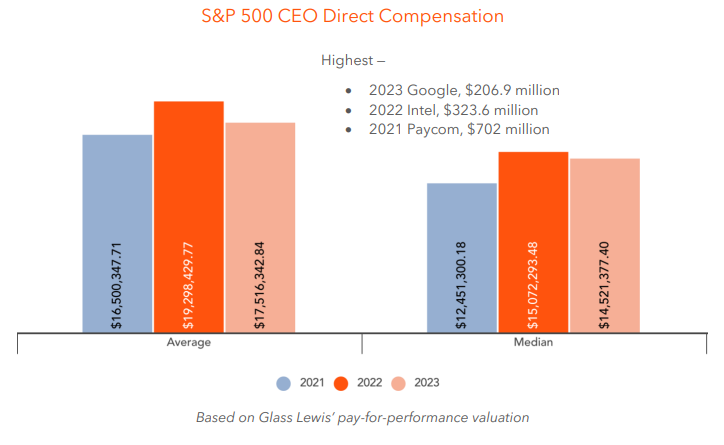
Executive Compensation
Shareholder Proposals

Download the complete report here.
