 Print
PrintIntroduction
Climate and environmental disclosure and governance are not new topics; however, coincident with the heightened concerns about the impacts of climate change, stakeholders’ interest in and expectations relating to corporate disclosure and governance have increased dramatically over the past several years. Further, the interested stakeholder group has expanded well beyond environmentalists and special interest groups to encompass mainstream investors, customers, employees, regulators, lawmakers, and suppliers, among others.
How companies and boards are responding to these changing expectations and pressures is the focus of this collaborative Society for Corporate Governance (Society) and Persefoni report, which presents findings from a May 2023 survey of Society members regarding climate and environmental disclosure and assurance, board oversight, and management organizational responsibility.
Findings
Respondents, primarily corporate secretaries, in-house counsel, and other in-house governance professionals, represent 98 public companies of varying sizes and industries. [1] The findings pertain to these companies, and where applicable, commentary has been included to highlight differences among respondent demographics. The actual number of responses for each question is provided. Throughout this report, percentages may not total 100 due to rounding and/or a question that allowed respondents to select multiple choices.
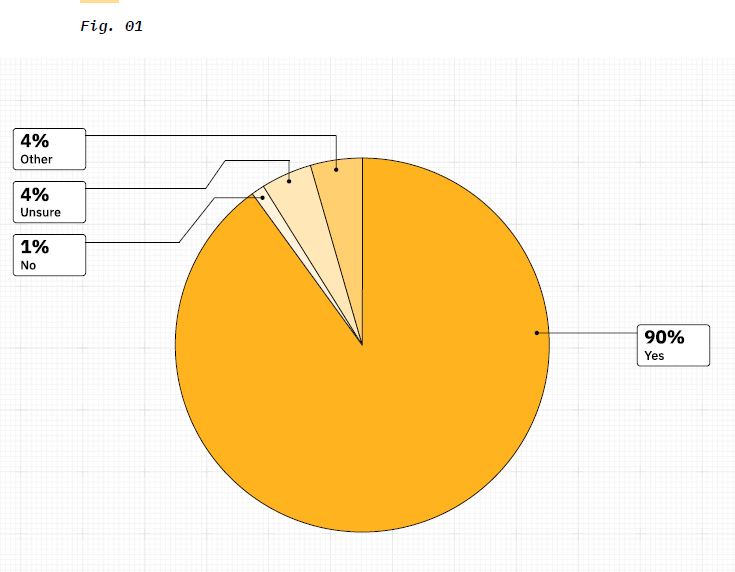
Does your company have controls and procedures to track, monitor, aggregate, and report on (to the extent applicable) climate and/or other environmental metrics within your company? (90 responses)
Approximately 90% of respondents have controls and procedures to track, monitor, aggregate, and report on (to the extent applicable) climate and/or other environmental metrics.
Does your company voluntarily publicly disclose goals, metrics, and/or other information on climate or any other environmental topics? (82 responses)
Nearly 90% voluntarily publicly disclose goals, metrics, and/or other information on climate/environmental topics.
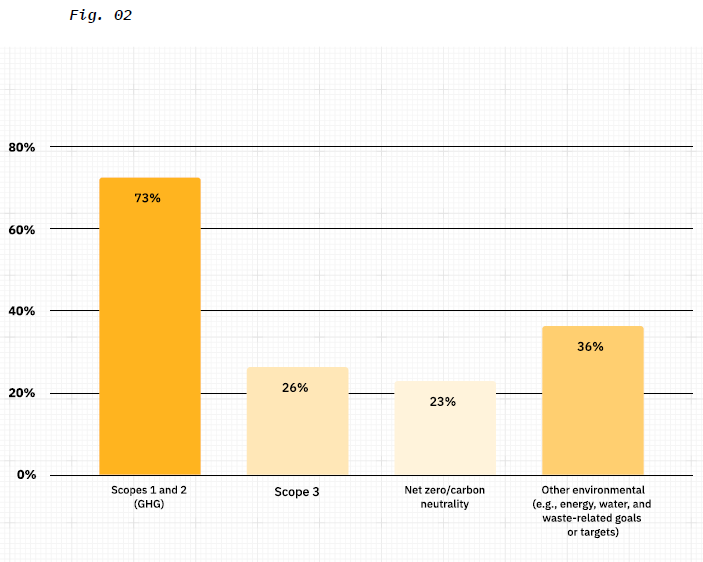
Scope 1 and 2 GHG emissions were mentioned most frequently (73%), followed by Scope 3 (26%); and net zero/carbon neutral (or similar) (23%). Other metrics include, for example, various energy, water, and waste-related goals or targets.
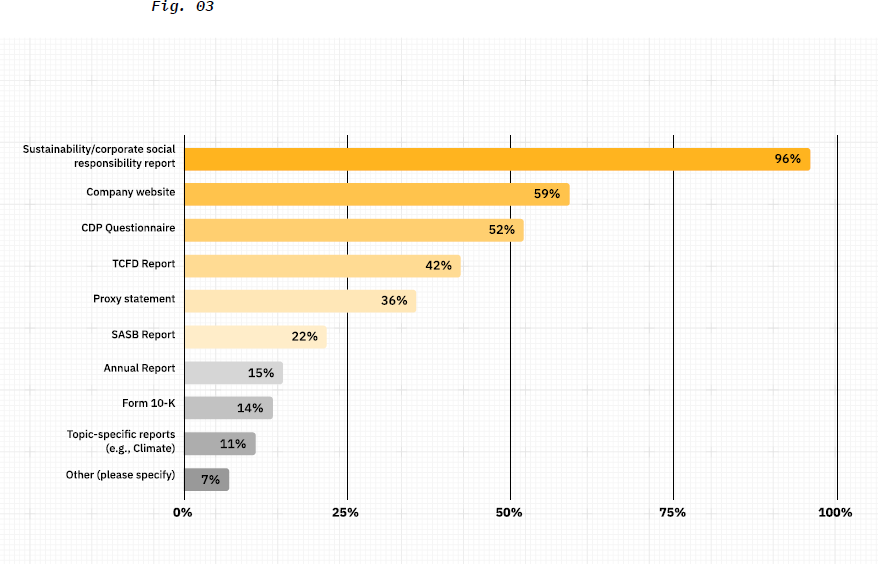
Where does your company disclose voluntary climate goals, data, and/or metrics? Select all that apply. (73 responses)
By far, the sustainability/CSR report was the most common place companies disclose voluntary climate goals, data, and/or metrics (96%). 59% said they disclose on the company website, 52% in a CDP questionnaire, 42% in a TCFD report, and 36% in the proxy statement. Only 15% reported that they disclose voluntary climate data in the annual report, and 14% in Form 10-K.
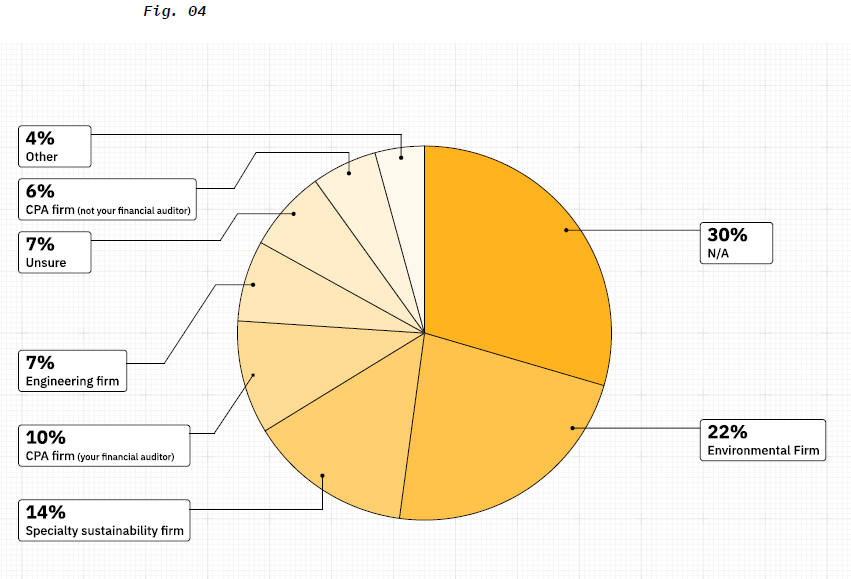
Which type of organization provides third party assurance of climate-related metrics that you disclose? (71 responses)
Nearly 30% of companies do not receive third-party assurance of disclosed climate-related metrics, while another 7% said they were unsure. By company size, 25% of large-caps and 44% of mid-caps reported the same, while another 6% of large-caps and 13% of mid-caps said they were unsure.
Of those companies that do receive third-party assurance of disclosed climate-related information, 22.5% do so from an environmental firm, 14% from a specialty sustainability firm, 10% from their financial auditor, and 6% from a CPA firm other than their financial auditor.
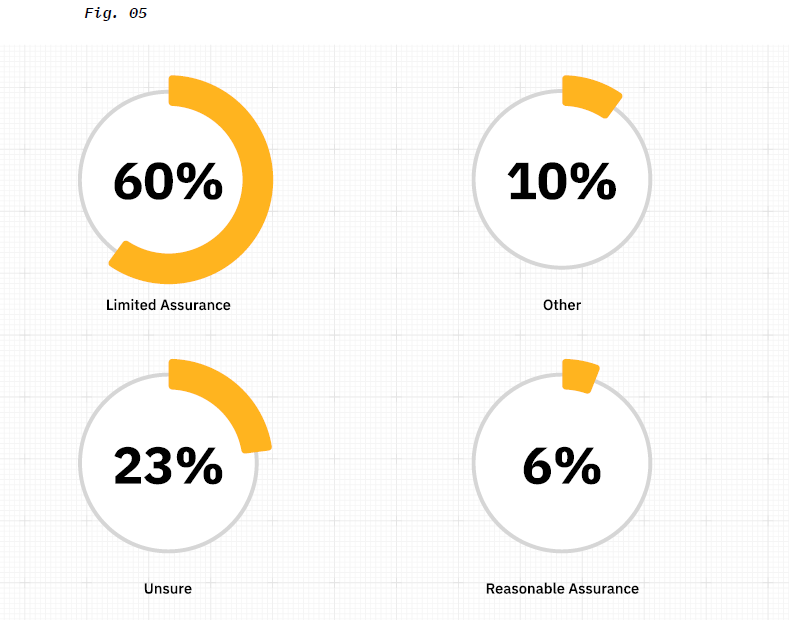
What level of assurance does the independent third party provide on your climate-related data? (48 responses)
Of companies that receive third-party assurance on disclosed climate-related data, 60% reported they receive limited assurance and 6% said reasonable assurance. Two companies said they receive reasonable assurance for scopes 1 and 2 and limited assurance for scope 3. 23% of companies were unsure of their assurance levels.
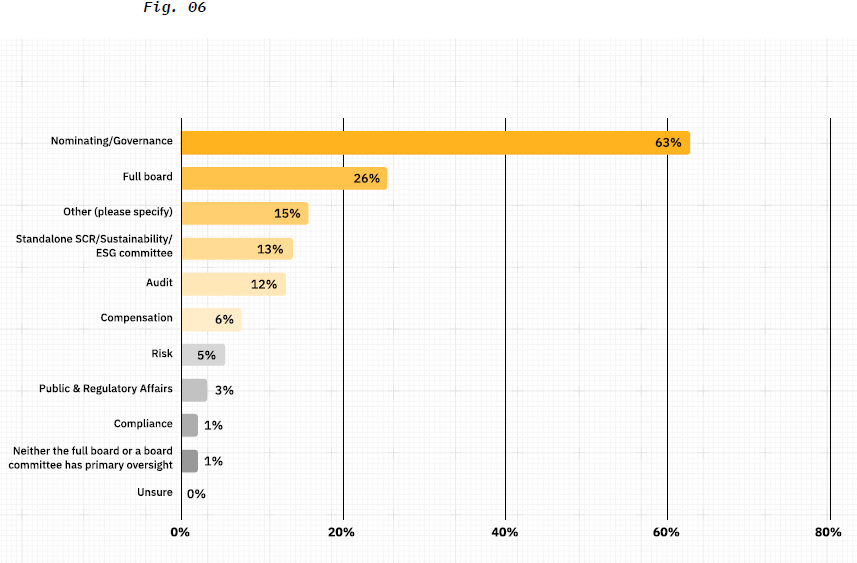
Please indicate which of the following (or similar) board committees, or whether the full board, has primary oversight responsibility for your company’s climate and other environmental issues. Select all that apply. (78 responses)
63% reported that the nominating/governance board committee has primary oversight responsibility for the company’s climate and other environmental issues, while 26% said the full board. However, of the 15% that reported “Other,” nearly half identified the nominating/governance committee or sustainability/ESG committee, 13% said the standalone CSR/sustainability/ESG committee, and 12% said the audit committee.
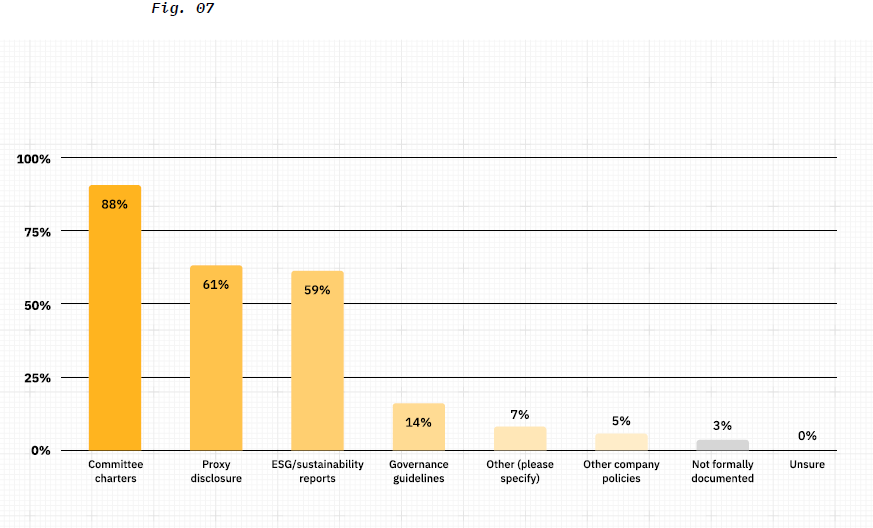
Where is board or board committee oversight memorialized? Select all that apply. (76 responses)
Board or board committee oversight is memorialized primarily in committee charters (88%), proxy disclosure (61%), and ESG/sustainability reports (59%).
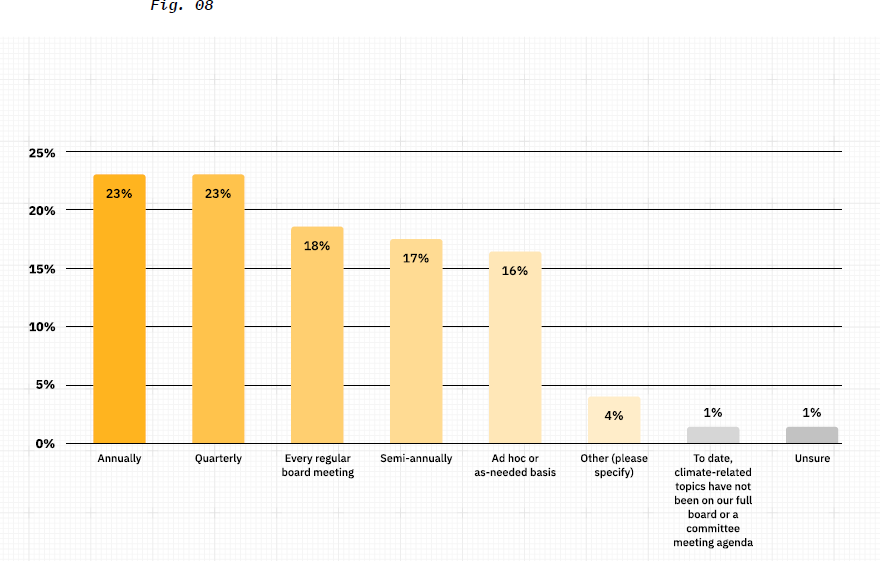
Describe the frequency of climate-related topics on the meeting agenda for the full board or board committee(s): (77 responses)
The frequency of climate-related topics on the meeting agenda for the the full board or board committee/s was fairly evenly distributed: annually (23%), quarterly (23%), every regular board meeting (18%), semi-annually (17%), and ad hoc as needed (16%)
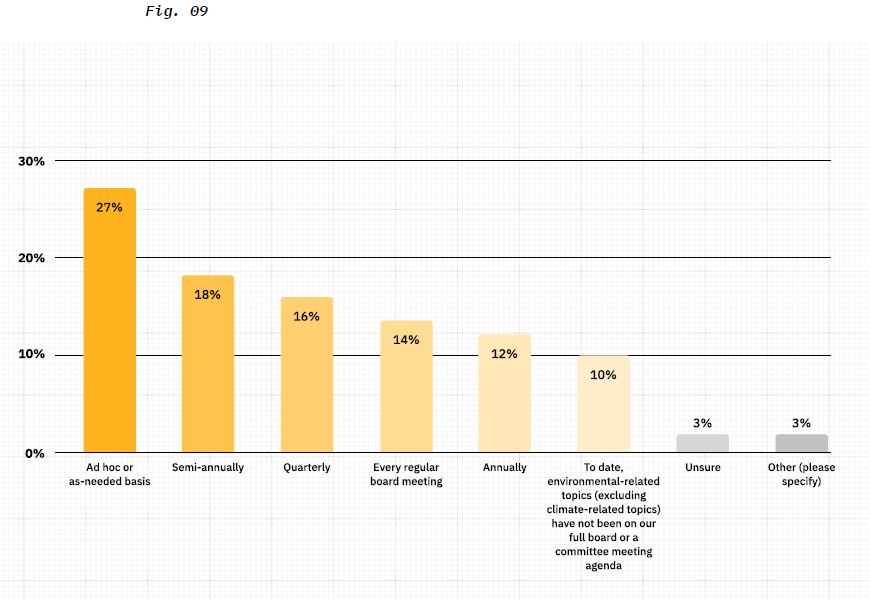
Describe the frequency of environmental related topics other than climate on the meeting agenda for the full board or board committee(s): (77 responses)
In contrast, the frequency of environmental-related topics other than climate on the meeting agenda for the full board or board committee/s was most commonly ad hoc or on an as-needed basis: ad hoc/as needed (27%), semi-annually (18%), quarterly (16%), every regular board meeting (14%), annually (12%), or not at all (10%). Mid-cap and large/megacaps trended toward ad hoc/as needed more so than small/micro-caps, which trended toward a quarterly frequency.
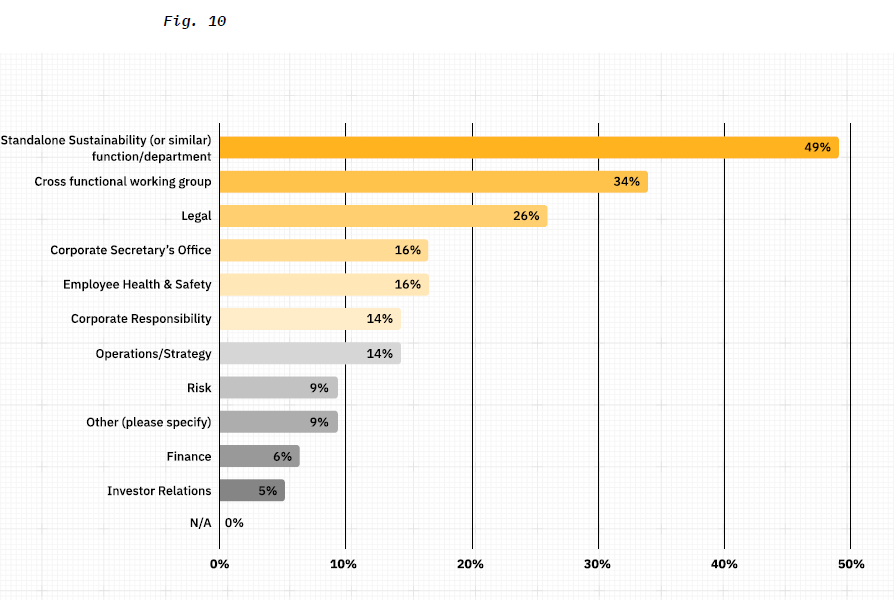
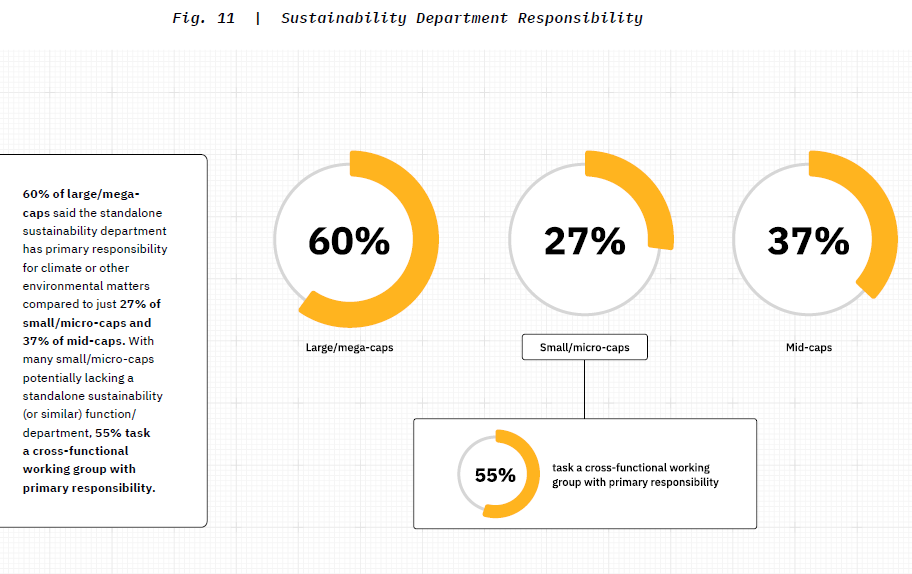
Which function area or department in your company has primary responsibility for climate or other environmental matters? Select all that apply. (77 responses)
Nearly half of the respondents (49%) reported that the company’s standalone sustainability (or similar) function/department has primary responsibility for climate or other environmental matters): 34% said a cross-functional working group; 26% said legal; corporate secretary’s office and employee health and safety each came in at 16%; and corporate responsibility and operations/strategy each came in at 14%.
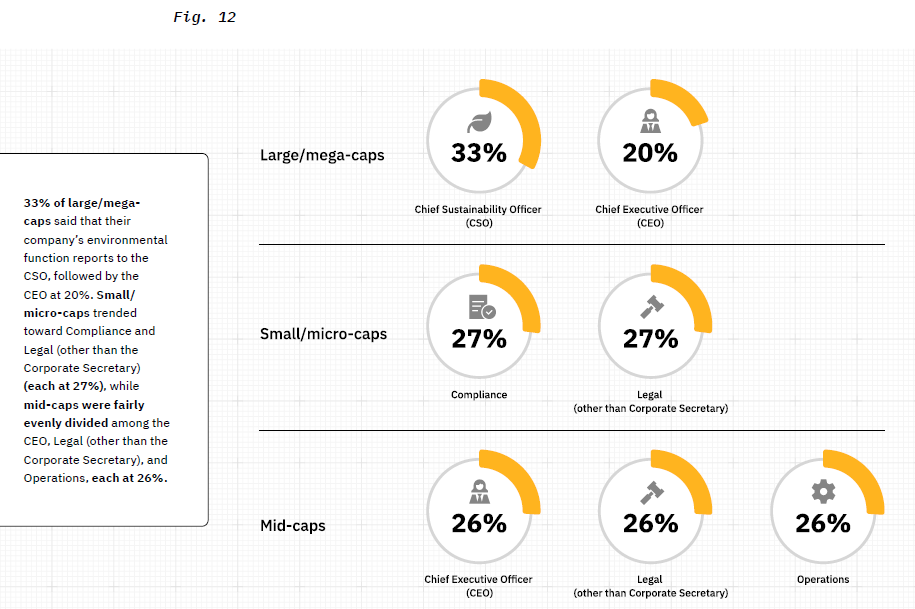
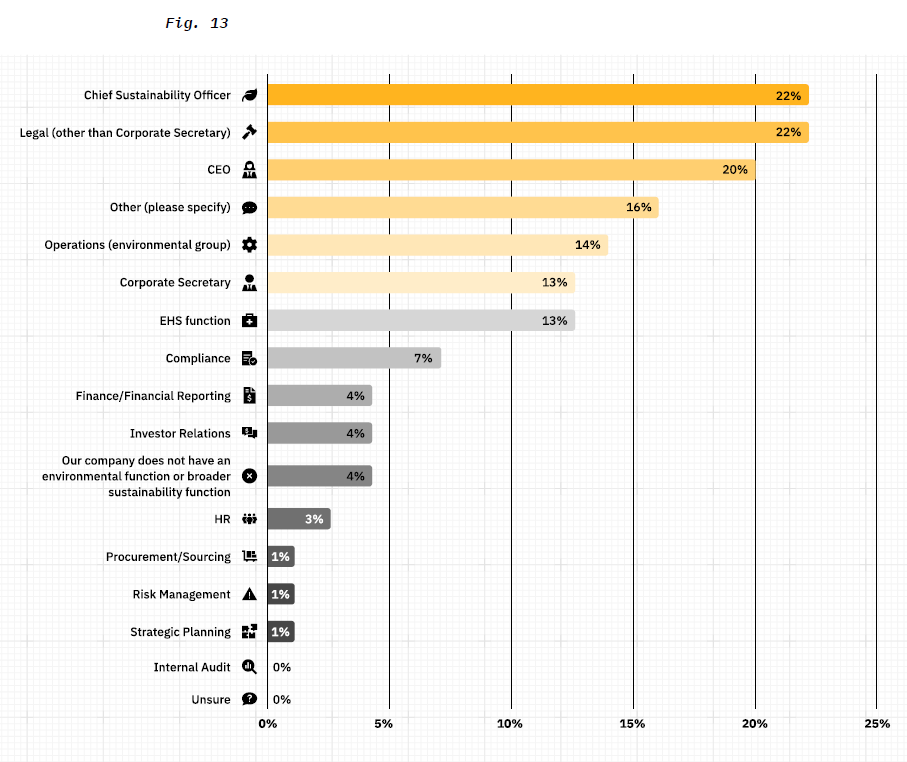
Where does your company’s environmental function (or broader sustainability/ESG function, if there is no stand-alone environmental function) report into (i.e., direct reporting relationship)? Select all that apply. (76 responses)
22% reported that the company’s environmental function (or broader sustainability / ESG function, if there is no stand-alone environmental function) reports to the Chief Sustainability Officer, while the same percentage (22%) said the function reports to Legal (other than the Corporate Secretary), closely followed by the CEO (20%), other (16%), Operations (14%), Corporate Secretary (13%), EHS function (13%), and Compliance (7%). See Fig. 13 for comparison.
Endnotes
1Respondents were 6% mega-cap (greater than or equal to $100 billion), 53% large-cap (between $10.001 billion and $99.99 billion), 29% mid-cap (between $2 billion and $10 billion), 10% small-cap (between $300.001 million and $1.999 billion), and 2% micro-cap (between $50 million and $300 million). Industry distribution of respondents: 34% were in energy, resources, and industrials (e.g., industrial products and construction; mining and metals; oil, gas, and chemicals; power and utilities), 28% Consumer (e.g., automotive; consumer products; retail, wholesale, and distribution; transportation; hospitality and services), 19% Financial services (e.g., banking and capital markets; insurance; investment management; real estate), 15% Technology, media, and telecommunications, 2% Life sciences and health care, and 2% other (aerospace & defense and animal health).(go back)