 Print
PrintMerel Spierings is Senior Researcher at The Conference Board ESG Center in New York. This post relates to Corporate Board Practices in the Russell 3000, S&P 500, and S&P MidCap 400: Live Dashboard, a live online dashboard published by The Conference Board and ESG data analytics firm ESGAUGE, in collaboration with Debevoise & Plimpton, the KPMG Board Leadership Center, Russell Reynolds Associates, and The John L. Weinberg Center for Corporate Governance at the University of Delaware. Related research from the Program on Corporate Governance includes The Perils and Questionable Promise of ESG-Based Compensation (discussed in the Forum here) by Lucian Bebchuk and Roberto Tallarita; Paying for long-term performance (discussed in the Forum here) by Lucian Bebchuk and Jesse Fried; and Share Repurchases, Equity Issuances, and the Optimal Design of Executive Pay (discussed in the Forum here) by Jesse Fried.
This report documents corporate governance trends and developments at US publicly traded companies—including information on board composition and diversity, the profile and skill sets of directors, and policies on their election, removal, and retirement. The analysis is based on recently filed proxy statements and complemented by the review of organizational documents (including articles of incorporation, bylaws, corporate governance principles, board committee charters, and other corporate policies made available in the Investor Relations section of companies’ websites). The report also presents key insights gained during two Chatham House Rule meetings: a focus group discussion with in-house governance leaders in which we discussed their views on current trends in corporate boardrooms, and a roundtable discussion with over 30 corporate directors, C-Suite executives, and governance professionals, in which we discussed how to harness the advantages of having a diverse board.
The reported level of diversity on US corporate boards seemed to reach a plateau even before litigation challenging corporate diversity programs in the wake of the Supreme Court’s decision in Students for Fair Admissions, Inc. v. President and Fellows of Harvard College.[1] In the current environment, it is critical for boards to have a clear consensus on how diversity and commonality among directors contribute to effectiveness. This report addresses the current state of diversity in boardrooms and provides insights on how to maximize the benefits of a diverse board.
Director Gender
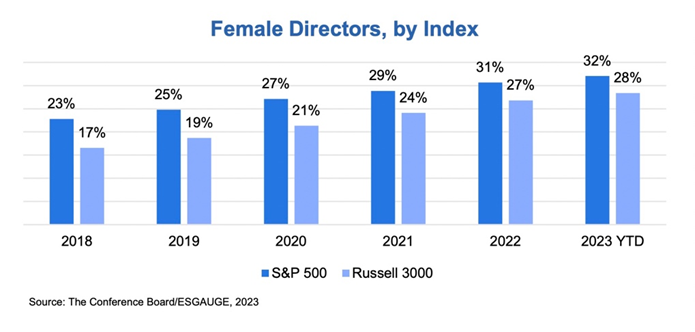
The percentage of female directors continues to rise, albeit slowly. The share of female directors grew from 23% in 2018 to 32% in 2023 in the S&P 500. While the percentage of female directors in the Russell 3000 continues to be lower than in the S&P 500, the gap is narrowing. The share of female directors in the Russell 3000 grew by 11 percentage points, from 17% in 2018 to 28% in 2023. The largest companies (with annual revenues of $50 billion and over) have the highest percentage of female directors; the smallest companies (with annual revenues under $100 million) still have the lowest share.[2]
A majority of Russell 3000 companies now have three or more female directors. As of August 2023, 54% of Russell 3000 companies had three or more female directors, compared to 48% in 2022 and 18% in 2018. Additionally, only 1.6% of Russell 3000 companies reported having no female members in 2023, down from 21% in 2018. In the S&P 500, 86% of companies currently have three or more female directors, up from 47% in 2018 and 56% in 2019—the first year the figure topped 50%. The percentage of S&P companies reporting all-male boards has remained near zero since 2019. Lessons learned from increasing gender diversity in the boardroom may apply to other forms of diversity as well. Concerted efforts grounded in a clear understanding of the business case for diversity can result in significantly more meaningful levels of diversity on boards over time.
The percentage of new directors who are female has fallen in 2023. In the S&P 500, the share of new directors who are female decreased from 43% in 2022 to 38% in 2023, and in the Russell 3000 it decreased from 42% to 39%. This drop explains why the percentage of all directors who are female has risen more slowly in 2023 than previously, from 31% in 2022 to 32% in 2023 in the S&P 500, and from 27% to 28% in the Russell 3000.
Director Race/Ethnicity
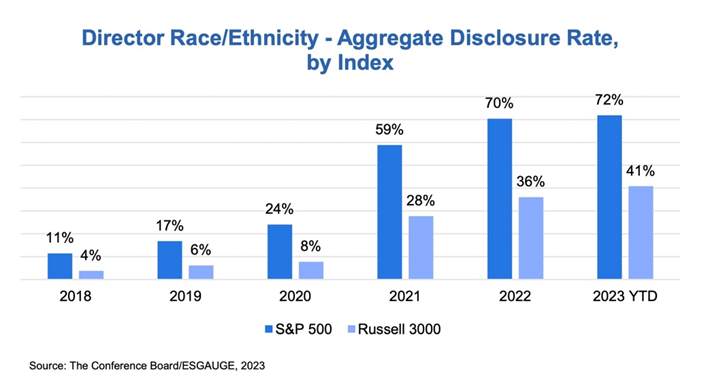
Disclosure of director race/ethnicity on an aggregate level may be plateauing, especially in the S&P 500.[3] In 2021, the percentage of companies disclosing the aggregate level of racial/ethnic diversity on their boards surged to 59% in the S&P 500, up from 24% in 2020 and 11% in 2018. Meanwhile, the share of racial/ethnic diversity reached 28% in the Russell 3000, up from 8% in 2020 and 4% in 2018. However, director race/ethnicity disclosure increased only two percentage points in the S&P 500, from 70% in 2022 to 72% in 2023. The share of companies disclosing the overall racial/ethnic makeup of the board grew by five percentage points in the Russell 3000, from 36% in 2022 to 41% in 2023. Companies that do not already disclose director race/ethnicity may want to consider disclosing the makeup of the board on an aggregate level, as this might be clearer and easier for stakeholders to understand than individual-level disclosures.
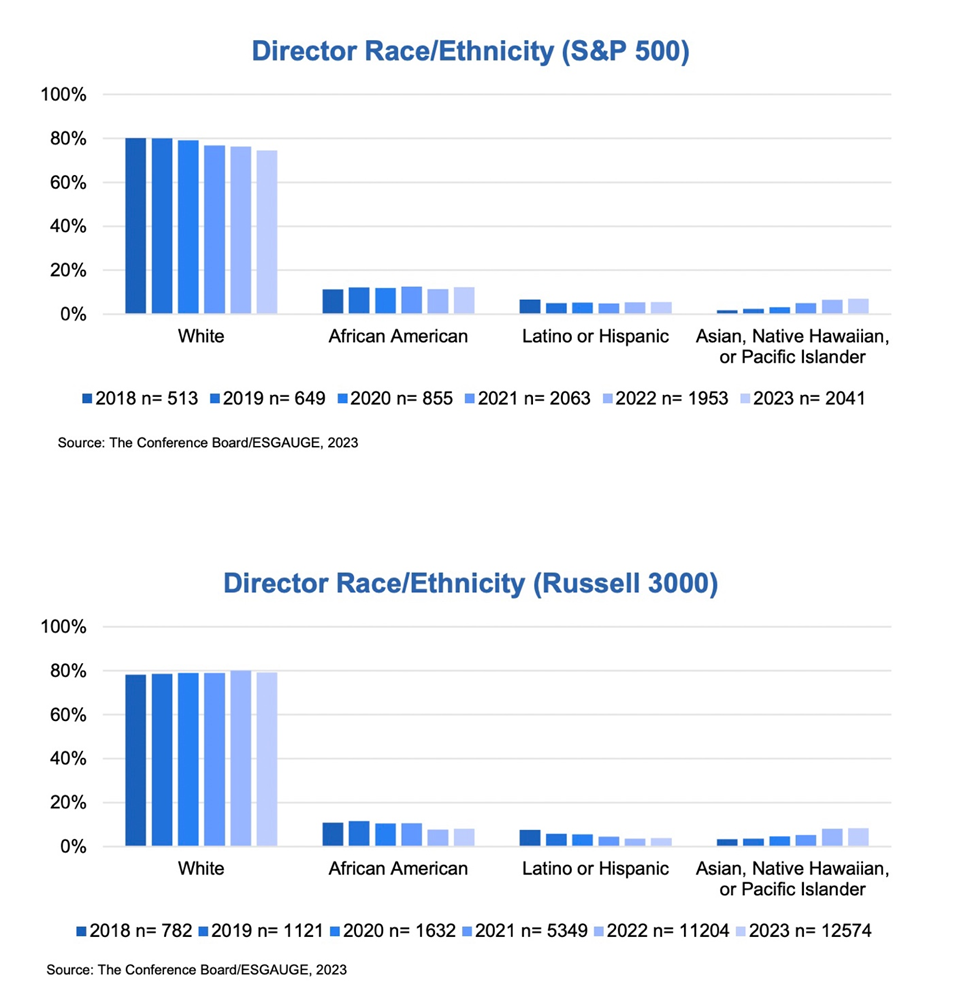
While the percentage of companies disclosing racial/ethnic diversity is plateauing in the S&P 500, the reported levels of racial/ethnic diversity may have plateaued in the Russell 3000. The percentage of White directors in the S&P 500 decreased by five percentage points from 80% in 2018 to 75% in 2023. In the Russell 3000, the racial/ethnic makeup of the board has remained virtually unchanged since 2018, with the share of White directors hovering at around 79%. The relatively slow pace of reported diversity may be driven by directors’ reluctance to self-identify as being part of a demographic group, but it can open the door to shareholder activism and challenging director elections. Companies that may be underreporting diversity should have discussions at the board level about the benefits of providing more complete disclosure.
While the reported percentage of Latino or Hispanic and African American directors in the S&P 500 has remained stable at around 5% and 12%, respectively, the share for both groups in the Russell 3000 has decreased in recent years. The percentage of African American directors decreased from 11% in 2018 to 8% in 2023, and the percentage of Latino or Hispanic directors decreased from 8% to 4% over the same period. In both indexes, the share of Asian, Native Hawaiian, and Pacific Islander directors has increased. This suggests that companies are taking a broader view of racial diversity in general and that the focus on racial/ethnic diversity is not limited to African American and Latino/Hispanic directors. However, the decline in reported diversity may also reflect a reluctance to self-identify, as noted above.
Larger companies’ boards continue to be more racially/ethnically diverse than those of their smaller counterparts. As of August 2023, 31% of directors at companies with annual revenues of $50 billion and over were non-White, compared to 21% of directors at companies with annual revenues under $100 million.
Compared to all directors, a larger percentage of new directors self-identifies as non-White. However, compared to 2022, the share of new non-White directors has decreased in both indexes. In the S&P 500, it fell from 45% in 2022 to 36% in 2023, and in the Russell 3000 from 43% to 35%.
Director Sexual Orientation
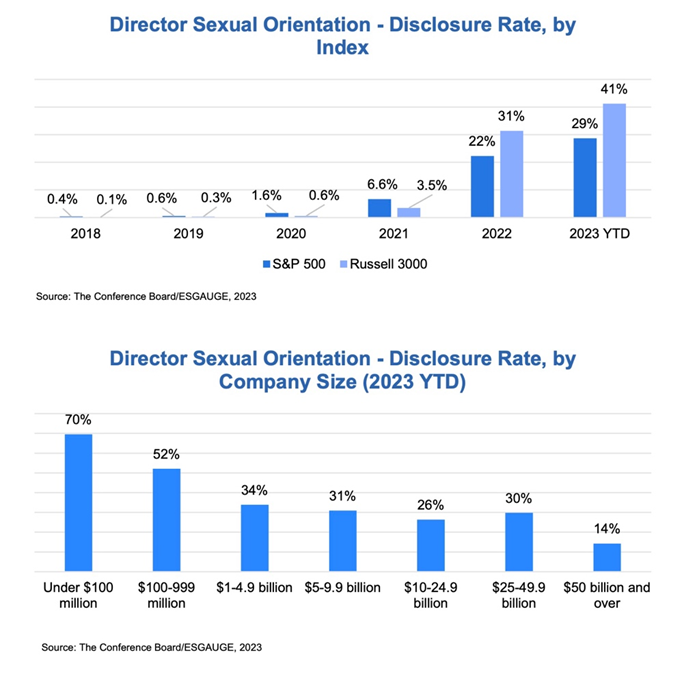
Disclosure of director sexual orientation is growing, and smaller companies are more likely than their larger counterparts to disclose this information. Some 29% of S&P companies are now disclosing director sexual orientation, up from 22% in 2022 and 7% in 2021. The large increase seen in 2022 was largely due to Nasdaq’s Board Diversity Rule.[4] The Russell 3000 followed a similar pattern: disclosure grew from 3% in 2021 to 31% in 2022 and to 41% in 2023. Moreover, whereas 70% of the smallest companies disclose their directors’ sexual orientation, only 14% of the largest companies do so. The inverse correlation between company size and disclosure rates of sexual orientation may be reflective of a generational divide. Indeed, there is a correlation between company size and average director age, with smaller companies having younger directors. These younger directors might be more willing to disclose information about their sexual orientation. Moreover, the Nasdaq, which allows companies to satisfy part of the diversity objective with a director who is LGBTQ+, has a higher representation of smaller companies compared to larger ones.
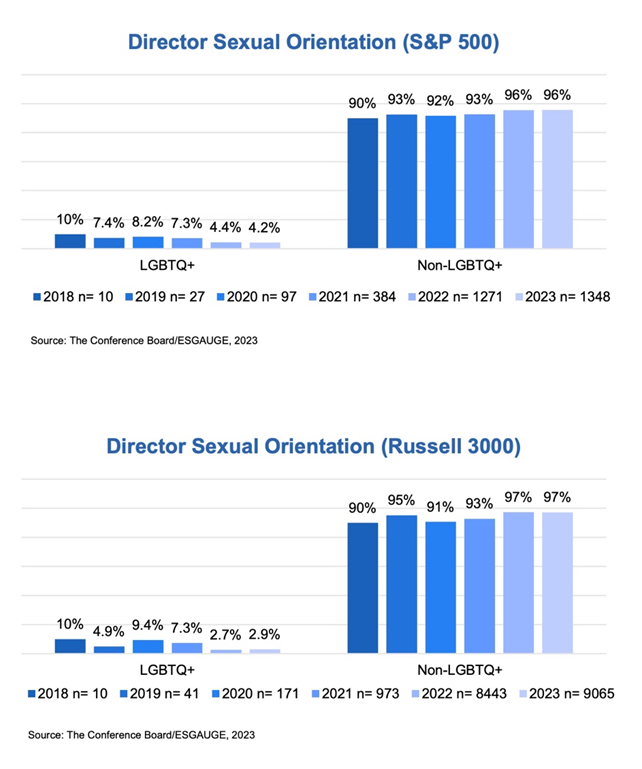
While the absolute number of directors who self-identify as LGBTQ+ is increasing, the percentage of such directors is decreasing. In the S&P 500, the reported number of LGBTQ+ directors grew from just one (out of 10 directors disclosing their sexual orientation) in 2018 to 57 (out of 1,348 directors) in 2023. As a result, the percentage of LGBTQ+ directors decreased from 10% in 2018 to 4% in 2023. In the Russell 3000, the reported number of LGBTQ+ directors grew from one (out of 10 directors disclosing their sexual orientation) in 2018 to 263 (out of 9,065 directors) in 2023, resulting in a decrease in percentage from 10% to 3%. This makes sense, as not all directors that are now disclosing their sexual orientation actually are—or are willing to identify for purposes of corporate public disclosure documents as—LGBTQ+.
While there is a correlation between company size and director sexual orientation disclosure rates, there is none between company size and director self-identification of sexual orientation. For example, 3% of directors at both the smallest and largest companies self-identify as LGBTQ+. The largest share (6%) of LGBTQ+ directors can be found at companies with annual revenues between $25 billion and $49.9 billion, while the smallest percentage (2%) is found at companies with annual revenues between $100 million and $999 million.
Conclusion: How Corporate Director Diversity Can Contribute to Board Effectiveness
As boards become more diverse, it is important for them to discuss and disclose how to harness the advantages of that diversity. Many of the steps that boards can take to increase diversity— such as promoting board refreshment, ensuring leadership roles for diverse board members, and welcoming/on-boarding first-time directors—are ways of increasing board effectiveness in general. This underscores that having a diverse board is in the interests of everyone in the boardroom and company stakeholders.
The following are our insights and recommendations to companies:
- As shown by the increase in the number of women on corporate boards, companies can, through concerted efforts, significantly enhance diversity in the boardroom. The share of female S&P 500 directors grew from 23% in 2018 to 32% in 2023, and from 17% to 28% in the Russell 3000 over the same period. These efforts have produced results and should be adopted to ensure the increasing representation of other minorities.
- Companies should avoid underreporting levels of board diversity. Since 2018, the percentage of reported racially/ethnically diverse S&P 500 directors has increased by five percentage points to 25%, while it has remained relatively flat in the Russell 3000 at about 21%. This pace of reported change reflects not only low board turnover and the composition of the US board-age population, but also some directors’ reluctance to self-identify their race/ethnicity.[5]
- Having diverse directors can not only bring more perspectives, but also enhance the level of trust essential to board effectiveness. For example, 59% of S&P 500 companies now publicly disclose aggregate racial and ethnic diversity, and 29% disclose sexual orientation. Directors who share their personal backgrounds and experiences can spark discussions that deepen understanding and trust among the board members.
- Boards should consider what a new director will add to the culture of the board, rather than focusing only on a cultural fit. Reframing the question as to what an individual can constructively add to the board can help boards to be more open to those with different backgrounds.
- Directors, just like senior executives, may benefit from education about how to foster an inclusive environment. For example, companies can consider inviting directors to attend training sessions offered to senior management. Diversity can also be included as part of the board’s annual discussion of, or training on, the company’s code of conduct for directors.
- Discussions about diversity should also recognize the importance of commonality. Having strategic experience, a clear understanding of the role of the board, an ability to ask probing questions, and collective fluency across a range of relevant areas are essential and can enable the board to benefit from diversity.
Endnotes
1 Students for Fair Admissions, Inc. v. President and Fellows of Harvard College, No. 20-1199, 142 S.Ct. 895 (2022), June 29, 2023.(go back)
2Company-size data in this report are not captured in the charts and apply to manufacturing and nonfinancial services companies. They exclude companies in the financial and real estate sectors as those tend to report on asset value instead of annual revenue. Our live, interactive online dashboard allows you to access and visualize practices and trends from 2018 to date by market index, business sector, and company size, including asset value.(go back)
3 Companies can choose to disclose the board’s racial/ethnic diversity on an aggregate or individual level—or both. Aggregated data show the total number or percentage of directors who are racially/ethnically diverse (e.g., “10% of our directors are African-American” or “five of our directors are people of color”). Individual-level disclosures state individual directors’ race or ethnicity (e.g., “Jane Doe is Asian”).(go back)
4 Nasdaq’s Board Diversity Rule requires companies to explain why they do not have at least one female director and one director who is an underrepresented minority or LGBTQ+. Similarly, BlackRock encourages companies to have at least one director who identifies as a member of an underrepresented group, and State Street Global Advisors may withhold support from the chair of the nominating committee when a company in the S&P 500 does not have at least one director from an underrepresented racial/ethnic community on its board.(go back)
5 According to the US Census Bureau, 59% of the US population is “White alone, not Hispanic or Latino” (population estimates per July 2022). Additionally, the older the population, the higher the percentage of Americans that are White (which includes the Hispanic/Latino population): 69% of 40-year-olds, 74% of 50-year-olds, 78% of 60-year-olds, and 83% of 70 and 80-year-olds are White, according to 2017 data derived from the American Community Survey. Given that in 2019, Hispanic Americans made up 9% of the older population (age 65 and older), it’s safe to assume that approximately 65-70% of the US board-age population is (non-Hispanic) White. (In 2023, the average director age was 64 years in the S&P 500 and 62 years in the Russell 3000.) (go back)
