 Print
PrintMark Mushkin is a Partner at Orrick, Herrington & Sutcliffe LLP. This post is based on his Orrick memorandum.
With signs of a measured return of the IPO markets, companies and investors are revisiting the fundamental question, “What do I need to look like to go public?”
In the pre-2020 market, a “unicorn” with a $1 billion valuation and $100 million in annual revenue was a promising IPO candidate (with some variation by vertical). But with the meteoric rise – and subsequent fall – of valuations over the past several years, what’s the right litmus test for IPO success? By some calculations, over 1,000 companies today claim a valuation of $1 billion or more on a post-money basis – but only a fraction of these unicorns are likely to reach IPO, whether due to underlying business fundamentals or macro dynamics that have resulted in companies staying private longer or pursuing M&A exits (Jamie Dimon, in his annual letter to shareholders, recently bemoaned that the number of publicly listed companies today has nearly halved from the mid-1990s). In particular, after the poor performance of many companies that went public via de-SPAC, it is clear that advisors and investors continue to be selective with their money and more rigorous in their views on listed companies’ prospects.
So what does this mean for companies looking to list today? To see if there are any lessons from the recent swell in IPO activity, Orrick’s Mark Mushkin looked at the 79 non-SPAC IPOs that priced through June 30, 2024, and sorted them by those companies that have traded up (28) vs. down (51) since listing. For each company, we looked at market cap at listing (based on IPO price) and revenue on a trailing twelve-month (TTM) basis to see if there was any correlation to stock price performance (we also took a look at TTM net income, but it did not show any obvious trends).
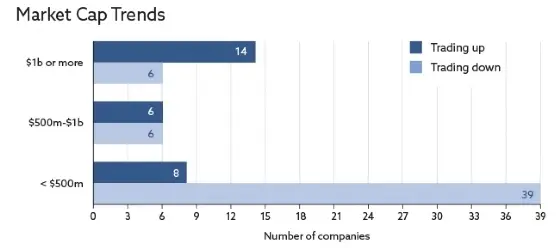
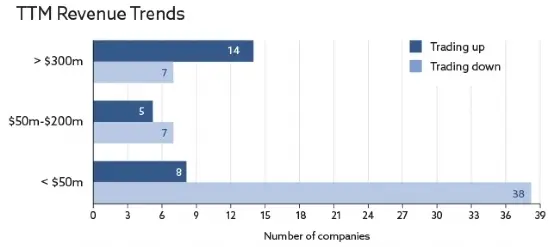
The market cap trends are particularly interesting. Of the 20 companies that listed with a market cap of $1 billion or more, only six have traded down so far. In contrast, of the 12 companies that listed with a market cap between $500 million and $1 billion, half have traded up, and half down. And of the 47 companies that listed with a market cap below $500 million, 39 have since traded down. The TTM revenue results also showed some trends. Of the 21 companies with around $300 million or more in TTM revenue, only seven experienced early stock price declines, with the results below that threshold much more mixed. Of the 12 companies with between $50 million and about $200 million of revenue, five have traded up and seven have traded down. And of the 46 companies with less than $50 million of revenue, only 8 have traded up.
What does this all tell us? That the traditional unicorn is not dead? That $300 million of revenue is the “new” $100 million? Maybe nothing so clear, but at least that in the early stages of the IPO market’s resurgence, public market investors have focused more on companies that have not only demonstrated size, but also revenue-generating capacity and some operational maturity. As a result, private fundraising and non-IPO exits may continue to be the preferred path for those unwilling or unable to test the public markets. However, the market continues to evolve. For those companies watching their financial metrics while contemplating a potential IPO, the advice remains – having your house in order is table stakes for considering a listing and can have equal benefits for alternative fundraising and exit strategies, and as every business knows, maintaining optionality can have significant value.
**All figures based on rough lawyer math and stock price movements as of July 26, 2024.