 Print
PrintSubodh Mishra is the Global Head of Communications at ISS STOXX. This post is based on an ISS-Corporate memorandum by Craig Benedict and Daniel King, Compensation & Governance Advisory at ISS-Corporate.
![]() Performance based awards have long been championed by proxy advisors and investors as the best way to align executive incentives with shareholder outcomes. Performance awards with a three-year performance period have emerged as the dominant performance horizon in the U.S. as a result. Despite this broad market consensus, some investors have begun to show support for simpler equity structures that deemphasize performance in favor of longer time-based equity vesting periods.
Performance based awards have long been championed by proxy advisors and investors as the best way to align executive incentives with shareholder outcomes. Performance awards with a three-year performance period have emerged as the dominant performance horizon in the U.S. as a result. Despite this broad market consensus, some investors have begun to show support for simpler equity structures that deemphasize performance in favor of longer time-based equity vesting periods.
Norges Bank, the investment arm of Norway’s sovereign wealth fund, is one of the most prominent proponents of an extended equity vesting period. The bank argues that performance-based equity can be expensive and complex and result in higher overall compensation than non-performance-based plans with an extended equity vesting period.
In this paper, ISS-Corporate examines these two different approaches to CEO compensation across Russell 3000 companies, comparing performance, compensation levels, investor and non-investor perceptions and governance data.![]()
Key takeaways
- “Standard” companies, which incorporate performance-based awards, generally show stronger long-term shareholder returns and more measured CEO compensation growth than companies that rely solely on time-based equity. Vote support for Say on Pay was higher at these companies as well.
- Standard companies perform better across all Governance QualityScore categories, including noncompensation categories suggesting a broader pattern of stronger governance practices where performance-based awards are used. However, this is partially due to the inclusion of factors related to performance-based awards in the Compensation category.
- No-Performance Based Awards (NPBA) and Extended-Timed Based Awards (ETBA) programs remain minority practices and are becoming even less common, reinforcing performance-based equity as the dominant market expectation
- Companies with extended time-vesting awards and companies with no-performance-based awards are smaller in size than companies with a “Standard” compensation program. They also have a similar distribution to Standard companies.
The push for extended equity periods has not been isolated to Norges Bank. In 2025, Institutional Shareholder Services sought investor views on performance‑based and time‑based equity through their annual policy surveys. The ISS survey revealed some divergence between investors and non‑investors, though several points of common ground also emerged. Investors were more likely than non‑investors to view performance‑based equity as a necessary component of long‑term incentive design, while non‑investors generally favored shorter vesting periods. At the same time, the results suggested there was meaningful investor openness to dispensing with performance‑based equity under certain circumstances, particularly when time‑based awards featured sufficiently lengthy vesting periods.
When asked about an appropriate mix of time‑ and performance‑based awards, investor responses did not indicate a clear preference for any single structure. By contrast, non‑investors tended to cluster around two views, each receiving approximately 30% support: that time‑based awards should not exceed 50% of total long‑term incentives, and that time‑based awards with sufficiently long horizons are not inherently problematic and could comprise a majority of long‑term incentives. Among U.S. respondents, investors most commonly supported a structure consisting of three‑year vesting plus at least a two‑year post‑vesting retention period (31%), while 21% maintained that equity awards should always include performance requirements regardless of vesting length. Notably, nearly one‑quarter of both investors and non‑investors viewed a five‑year time horizon as sufficiently long term irrespective of how vesting and post‑vesting retention is allocated.
Within the Russell 3000, only two companies have adopted time-based equity with vesting periods of five years or longer and do not grant performance-based awards. This could change in the near future. ISS stated in its most recent policy update that an equity pay mix consisting primarily or entirely of time-based awards will not in itself raise significant concerns as long as the time horizon is sufficient. Consequently, the number of companies adopting the combination of these elements may grow over time. In the meantime, we must examine these two features as separate groups: companies that grant extended time-based awards (ETBA) and those that rely exclusively on time-based equity with no performance-based awards (NPBA). The majority of the companies that possess neither of these characteristics, we categorize as a “Standard” compensation program.
Performance-Based Awards Are Increasingly Popular
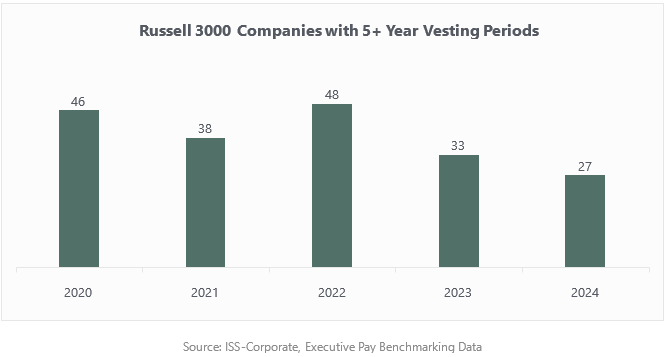
Across the Russell 3000, ETBA programs are scarce. While the number fluctuates from one year to the next, it has generally trended downward over the last five years. Only 27 Russell 3000 companies granted timebased awards with an extended vesting period of five or more years, down from 46 in 2020. Most of these companies incorporate both performance-based equity and extended time-based equity awards. The scarcity is particularly striking given the intuitive appeal of longer time horizons and perceived investor openness to such structures. This trend may be driven partially by investor inertia or by a belief that two additional years of vesting carry diminishing marginal benefits that are outweighed by the costs to executives of having equity tied up for two additional years.
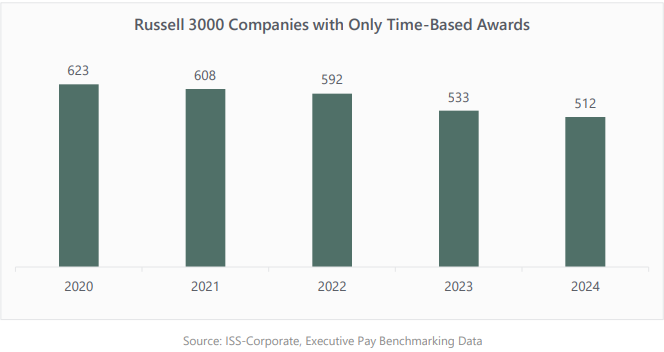
At first glance, NPBA companies have very little in common with ETBA companies, but we can see two commonalities. Both are significant deviations from the market norm, and both have become less common. While the NPBA group has declined steadily, NPBA companies remain far more numerous than ETBA companies. The drop likely reflects rising investor expectations on pay–for–performance and continued emphasis from investors on performance conditioning.
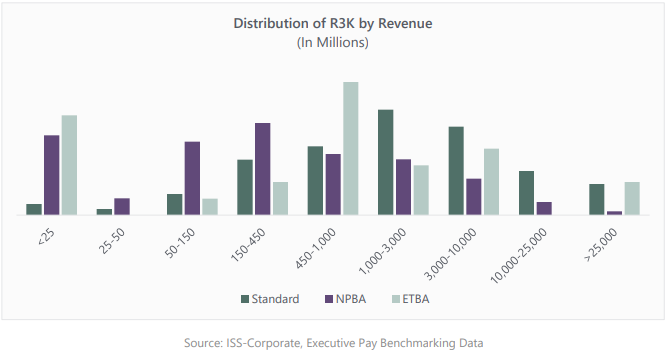
Given the diminutive size of these groups relative to the Standard companies, one might ask what types of companies fall into each category. Relative to Standard companies, both NPBA and ETBA groups skew smaller on revenue and market cap. This pattern is consistent with expectations. Emerging or smaller issuers may favor administrative simplicity and retention certainty provided by time-based equity, while larger or more mature firms face higher investor scrutiny and have the infrastructure to set and monitor multi-year goals.
NPBA companies are generally smaller than their Standard counterparts, but not dramatically so. They are more common in the $50 million to $150 million revenue range than Standard companies. More specifically, the median revenue for a company that issued no performance-based equity awards during 2025 was $249.8 million. This is significantly smaller than the median revenue for companies that issued performance-based equity awards, which was approximately $1.79 billion. Meanwhile, the median revenue for companies that offered extended time-based equity awards was $701.9 million. Interestingly, the ETBA companies seem to be more concentrated in disparate revenue buckets. Given the limited sample size of the group, this distribution should be taken with a degree of caution.
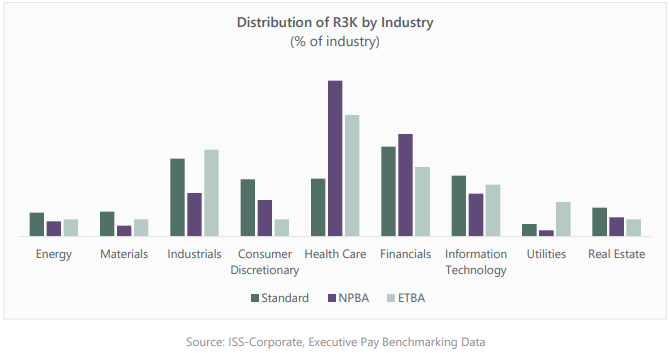
Turning to the industry composition of the groups, both are well represented across sectors. Healthcare appears to contain a larger percentage of NPBA and ETBA companies. Industrials are more likely to include performance metrics. But despite their small numbers, ETBAs and NPBAs are represented across all industries rather than concentrated in an industry where performance would be hard to measure. In short, industry effects are secondary to size in explaining program choice.
QualityScore
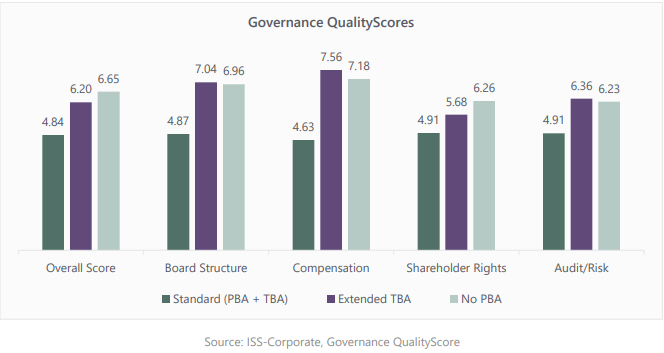
The ISS Governance QualityScore is a relative ranking system measuring a company’s overall governance practices across Board Structure, Compensation, Shareholder Rights, and Audit & Risk Oversight relative to their broader index (S&P 500 or Russell 3000). A higher QualityScore indicates a greater degree of governance risk with 1 being the strongest governance profile and 10 being the most susceptible to risk.
Standard companies on average rank over one decile better than both NPBA companies and ETBA companies when looking at overall Governance QualityScores. The difference in a company’s Compensation QualityScore is even more dramatic, with Standard companies showing a two-decile lead.
Part of this is due to the scoring methodology. Having performance-based metrics can improve a handful of heavily weighted factors in the Compensation category, which would translate into a stronger overall score. But even when looking at the other three categories where performance metrics are not scored, the Standard companies are also over a decile stronger. The average Board Structure score, for example, during 2025 was 7.04 out of 10 for companies with time-based equity awards only, and a 4.87 for companies that issued some performance-based awards.
These findings indicate that companies that incorporate performance-based equity programs for their CEO tend to have more shareholder-friendly governance and compensation practices. One can argue that a company that takes the extra step of designing a compensation program with performance metrics will be more sharply focused on its corporate governance, which is supported by these findings. With this link between performance equity and strong corporate governance established, will companies be motivated to try alternative compensation structures or will performance equity programs be cemented as the best practice moving forward?
The ETBA story is a bit more complicated. While having a longer vesting period for time-based awards is not necessarily a worse governance practice, the approach isn’t reflected in a better QualityScore. It should also be noted that these reflect only correlation, not causation.
Pay-for-Performance
Companies that have issued performance-based equity to their CEOs over the last five years have had higher total shareholder returns (TSR) and lower overall increases in CEO compensation relative to companies that do not issue performance-based equity awards.
Since 2021, the median total compensation for Russell 3000 CEOs that receive performance-based equity awards has gone up 31.2%. By contrast, the median compensation for CEOs that did not receive performance-based equity awards over the same period has increased by 57%.
These compensation increases contrast with the TSR generated by the companies. Russell 3000 companies with CEOs that have not received performance-based equity have had a median TSR of 7.5% over the last five years. Companies whose CEOs have been granted performance equity have had a median TSR of 10.7% over that same period.
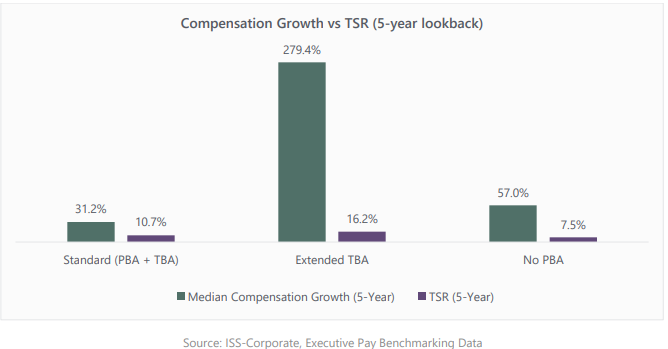
While there may be many factors at play here, it is nonetheless noteworthy that Russell 3000 companies that issue performance-based equity awards have seen greater shareholder returns while granting lower compensation increases to their CEOs than their counterparts.
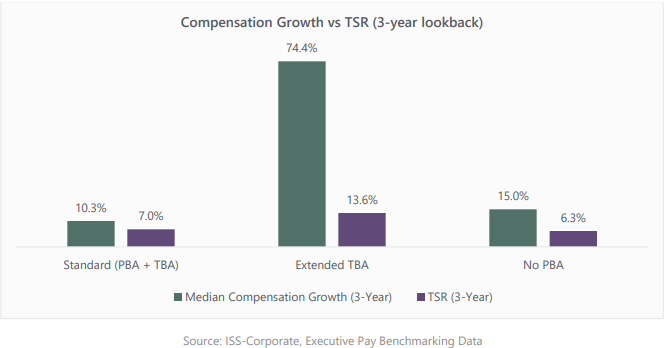
However, the figures we have discussed exclude companies that have the extended time-based equity award provisions that shareholders have been increasingly clamoring for. Of the 27 companies that used extended time-based equity awards during 2025, TSR has increased by a median 16.2% over the last five years, much higher than the figures we see for the other two sets of companies. While the sample size of companies that offer extended time-based equity awards is small, it is still noteworthy that TSR levels have been high at these corporate issuers relative to other companies.
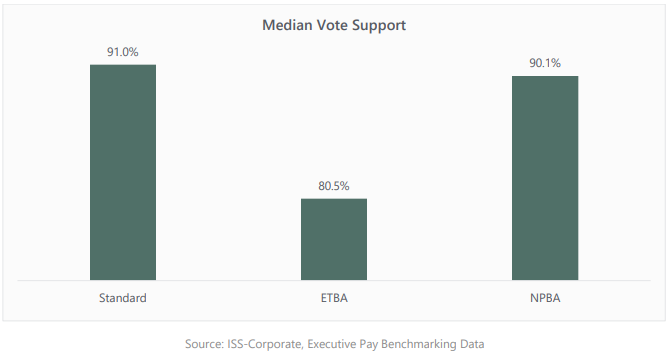
Russell 3000 companies that only issued time-based equity awards to their CEOs received an average of approximately 90.1% vote support from their shareholders for their Say-on-Pay proposals during 2025, slightly lower than the 91% received by CEOs whose companies incorporated performance-based equity awards. This means that shareholders were more likely to vote in favor of a pay program that issued performance-based equity to the CEO compared with those that did not. This is not surprising given the increased advocacy and normalization of performance-based equity in recent years within the executive compensation space.
Conclusion
The landscape of long-term incentive design is evolving, but performance-based equity continues to be seen as the most reliable mechanism for aligning CEO compensation with shareholder outcomes across the Russell 3000. Companies incorporating performance-conditioned awards not only delivered stronger TSR but also exhibited more moderate CEO compensation growth.
At the same time, the emerging discussion around extended time-based vesting should not be overlooked. The small cohort of companies adopting vesting periods of five years or longer demonstrates intriguing long-term performance outcomes. While the limited sample size prevents sweeping generalizations, these early signals suggest that credibly long vesting horizons may offer a viable alternative for companies facing forecasting challenges or strategic transitions that make traditional goal setting difficult. Industries that may see a lot of volatility may also benefit from ETBA equity structures. The elevated TSR growth observed among ETBA companies combined with growing investor openness to long-horizon stock indicates that extended vesting periods warrant continued monitoring as the market evolves.
In short, performance-based equity is likely to remain the central pillar of executive long-term incentive programs. Yet the rising interest in long-term- time-based vesting equity structures signals that the market is beginning to acknowledge a more nuanced spectrum of long-term design choices. In light of these rapid changes, it is essential for issuers to stay abreast of evolving compensation norms and rely on data-driven insights when evaluating potential program adjustments. Leveraging comprehensive market insights – including peer and broader market benchmarking of executive compensation and governance datasets – can help compensation committees assess the alignment of their equity programs with prevailing market norms. At the same time, committees should consider how prospective changes may be viewed by investors and ensure that the rationale is communicated clearly and transparently through disclosures.
Thoughtfully anticipating investor perspectives can help preserve support and mitigate potential concerns. ISS-Corporate can assist companies with navigating these evolving considerations.
