 Print
PrintMatteo Tonello is the Head of Benchmarking and Analytics at The Conference Board, Inc. This post is based on a Conference Board report developed in partnership with ESGAUGE, FW Cook, and Ropes & Gray and co-authored by Paul Hodgson, Senior Advisor, ESGAUGE, Ariane Marchis-Mouren, Senior Researcher, Corporate Governance at The Conference Board, and Andrew Jones, Principal Researcher, Governance & Sustainability Center at The Conference Board.
This report examines how the composition, compensation, and sectoral profile of named executive officers (NEOs) at US public companies have evolved since 2021, drawing on Russell 3000 and S&P 500 disclosure data to illuminate shifting C-Suite priorities and pay dynamics.
Trusted Insights for What’s Ahead®
- Beyond the CEO and chief financial officer (CFO), business unit heads are the most prevalent NEO roles—although their prevalence has notably declined since 2021.
- Chief legal officers (CLOs) and equivalents are a prevalent NEO role and recorded the largest absolute increase between 2021 and 2025.
- CLOs, chief technology officers (CTOs), chief human resources officers (CHROs), and chief commercial officers (CCOs) are all increasing in prevalence as NEOs—reflecting increased corporate emphasis on enterprise risk, technology, talent, and revenue.
- While mandates such as data, cybersecurity, and sustainability are increasingly strategic priorities, they are not consistently reflected as standalone NEO titles, suggesting these responsibilities are often embedded within broader executive roles.
- Reported median NEO compensation rose again in 2025, with faster growth in the Russell 3000 than in the S&P 500 and strong increases for roles such as CHRO and CLO.
- Men continue to earn more than women across the broader NEO population—with some notable exceptions—largely reflecting differences in role distribution, tenure, and concentration in the highest-paid operational and enterprise leadership positions.
NEOs at US public companies are the top executives whose compensation must be disclosed in detail under Securities and Exchange Commission (SEC) rules, generally including the CEO, CFO, and up to three other highest-paid executive officers. This information is disclosed in the annual proxy statement (DEF 14A), primarily in the Compensation Discussion and Analysis (CD&A) and related tables; and supports shareholder oversight, proxy voting, and assessments of executive pay and accountability.
NEO Demographics
Trends in top-ranking NEO titles
When analyzing NEO disclosures at US public companies, CEO and CFO inclusion is nearly universal and largely reflects disclosure convention rather than strategic differentiation. More revealing is how the composition of the remaining NEO roles has evolved, offering insight into which operational, functional, and strategic leadership positions companies increasingly elevate to the highest tier of executive leadership.
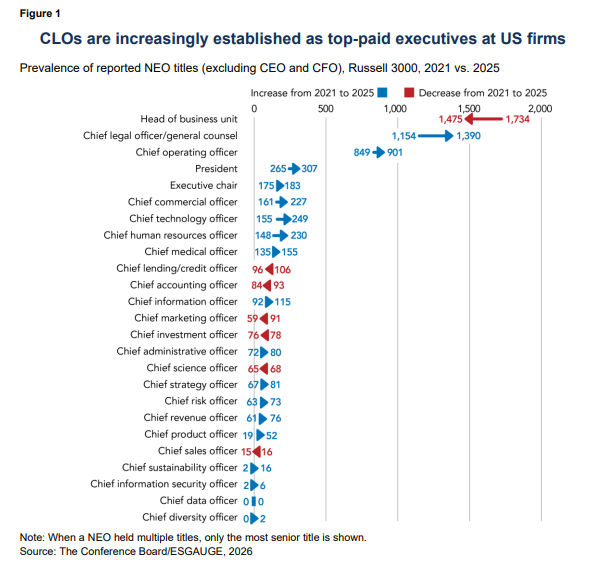
Business unit heads remain the most prevalent non-CEO/CFO NEO category, reflecting their central role in leading major operating segments or regions with full profit and loss responsibility. However, their representation has declined materially, falling from 1,734 disclosures in 2021 to 1,475 in 2025—a 15% decrease. This points to a broader governance shift away from decentralized, division-centric leadership models toward more functionally centralized executive teams, where enterprise-wide leaders overseeing legal, technology, human capital, and commercial strategy increasingly occupy the most senior and highly compensated roles.
The chief operating officer (COO) remains another core NEO role, underscoring its importance in overseeing enterprise execution. COO representation increased modestly from 849 disclosures in 2021 to 901 in 2025, although it remains below its recent peak of 990 in 2023 and 2024, reflecting continued variation in how companies structure and assign enterprise operational leadership.
In parallel, several functional leadership roles have expanded meaningfully within the NEO population since 2021:
- Legal roles (CLOs, general counsel, corporate secretaries, and chief compliance officers) recorded the largest absolute increase of any non-CFO category, rising by 236 disclosures, from 1,154 in 2021 to 1,390 in 2025. This reflects the deeper integration of legal, regulatory, compliance, and enterprise risk considerations into core business strategy. CLOs and equivalent roles are most prevalent in industrials (17%), health care (16%), financials (13%), and consumer discretionary (12%), where regulatory exposure, litigation risk, and government interaction are especially pronounced.
- Technology leadership has gained prominence, with CTO disclosures rising from 155 to 249 and chief information officer (CIO) disclosures increasing from 92 to 115. This underscores technology’s elevation to a core enterprise priority spanning digital transformation, cybersecurity, data governance, and AI oversight. In 2025, 31% of CTO NEOs were in the information technology sector, while CIOs were most concentrated in financials (30%), industrials (21%), and consumer discretionary (19%).
- Human capital leadership has also expanded materially, with CHRO disclosures rising from 148 in 2021 to 230 in 2025, after peaking at 265 in 2024. This reflects the growing strategic importance of workforce management, productivity, and organizational resilience. In 2025, nearly half of CHRO NEOs were in industrials (27%) and consumer discretionary (21%), sectors with large, labor-intensive workforces.
- Commercial leadership has followed a similar trajectory, with CCO disclosures increasing from 161 to 227 over the period under review. This reflects greater emphasis on revenue growth, pricing strategy, and commercialization in more volatile and competitive markets. The role is especially prominent in health care, which accounted for 39% of CCOs designated as NEOs in 2025, consistent with the sector’s complex commercialization models.
- By contrast, the number of chief marketing officers (CMOs) qualifying as NEOs declined between 2021 and 2025, suggesting that many companies are placing greater weight on commercial, pricing, and revenue leadership than on traditional brand and marketing leadership when determining top-tier executive prominence.
Trends in “new” NEO titles
The trajectory of newer C-Suite roles within the Summary Compensation Table (SCT) has been uneven. Several emerging executive titles—such as chief data officer, chief diversity officer, chief information security officer, and chief sustainability officer—have appeared in NEO disclosures in recent years, but their representation remains limited and inconsistent. In some cases, inclusion rose briefly before reversing.
Chief diversity officers provide the clearest example. While three companies disclosed such a title or equivalent as an NEO in both 2022 and 2023, none did so in 2024 or 2025. This decline coincides with a period of heightened political and legal scrutiny of corporate diversity initiatives. A similar pattern is evident for chief sustainability officers, which increased steadily from 2021 through 2024 before declining in 2025, likely reflecting a broader recalibration of how companies position sustainability leadership within the senior executive hierarchy.
Other emerging roles remain sparsely represented. Chief data officers, for example, did not appear in the SCT in 2021 or 2022 and were disclosed only sporadically from 2023 through 2025. As shown in Figure 1, the overall incidence of these newer C-Suite positions remains very low relative to traditional operating and functional roles. Overall, while companies continue to experiment with new executive mandates, these roles have not yet achieved widespread inclusion within the “must-disclose” NEO population.
Inclusion in the SCT affects compensation benchmarking and can reflect visibility with the board and the formal authority associated with enterprise-wide mandates. The limited presence of emerging roles among NEOs suggests that responsibilities related to data, cybersecurity, sustainability, and diversity are often exercised within broader executive portfolios rather than established as standalone points of top-level accountability.
Trends in NEO Compensation
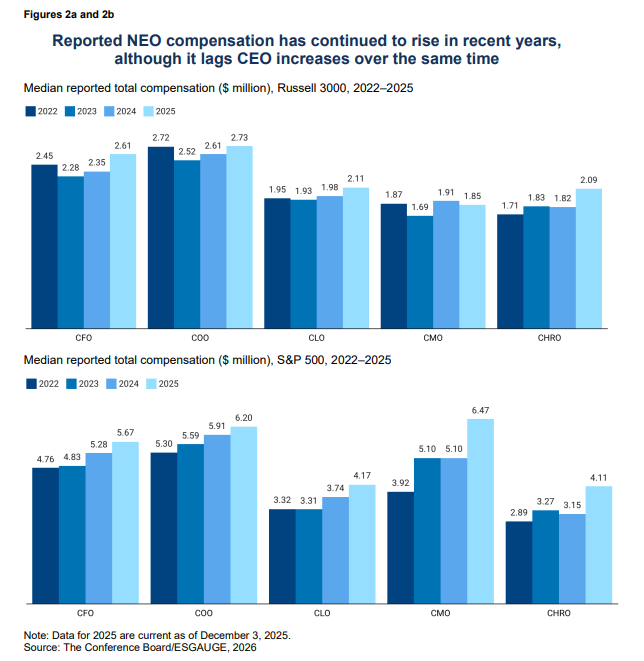
Median total compensation for NEOs increased more rapidly in the Russell 3000 than in the S&P 500 in 2025, though growth varied by role. Across all NEOs, median pay (including changes in pension value) rose by 8.1% in the Russell 3000, compared to 4.7% in the S&P 500, indicating that compensation growth pressures were more pronounced across the broader market than among the largest companies.
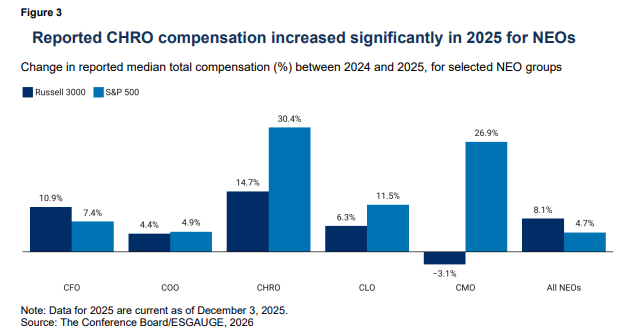
By contrast, several functional leadership roles experienced substantially higher pay growth in the S&P 500. Median compensation for CHROs increased by 30.4% in the S&P 500, compared to 14.7% in the Russell 3000, while CLO pay rose by 11.5% versus 6.3%, respectively. These gaps are consistent with large-cap companies emphasizing enterprise-wide human capital strategy, labor relations, regulatory compliance, and litigation and enforcement risk.
The divergence is most pronounced for CMOs. Median CMO compensation declined slightly in the Russell 3000 in 2025 (–3.1%) but increased sharply in the S&P 500 (26.9%). Among large-cap companies, rising CMO pay likely reflects greater emphasis on brand resilience, pricing power, customer retention, and data-driven demand generation; as well as the growing integration of marketing, analytics, and digital platforms. These findings should be interpreted cautiously, however, as the number of CMOs disclosed as NEOs—particularly in the S&P 500—remains relatively small (133 in the Russell 3000 and 29 in the S&P 500 in 2025), making annual trends more sensitive to changes in NEO designation and individual compensation outcomes.
Differences in compensation growth across NEO roles may also reflect changes in incentive design and performance horizons, not just market pressures. As certain functional roles assume broader enterprise accountability, compensation programs may place greater weight on long-term incentives and outcomes related to risk management and resilience.
Gender Variations in Reported NEO Compensation
Gender-based differences in executive pay vary by role and index. As recently reported by The Conference Board, at the CEO level, women earn more than men in both indices, with median total compensation 3% higher in the Russell 3000 and 11% higher in the S&P 500. This premium at the very top reflects structural and selection dynamics rather than a broad-based pay advantage. Women CEOs remain a small and highly selected group, more likely to lead larger, more complex, or higher-scrutiny companies where compensation levels are elevated overall.
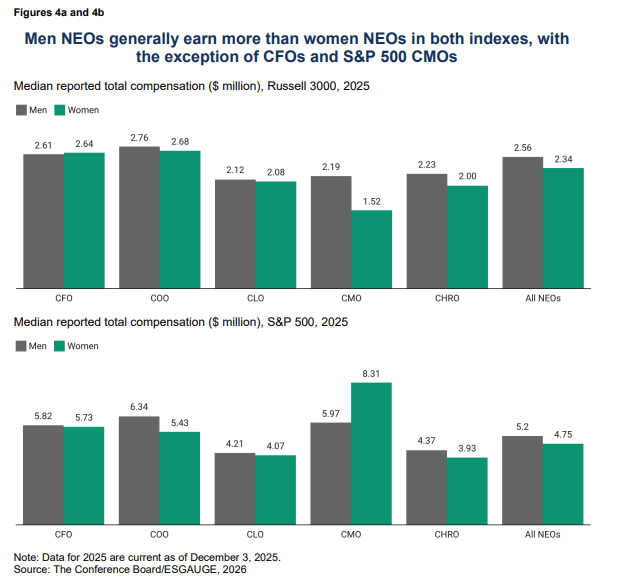
This pattern does not extend to NEOs as a whole. Across all NEO roles combined, men continue to earn more than women in both indices. In the S&P 500, median total compensation for men NEOs reached $5.2 million in 2025, compared with $4.8 million for women NEOs. A similar gap appears in the Russell 3000, where men NEOs earned a median of $2.6 million versus $2.3 million for women. These gaps are best explained by differences in role composition rather than unequal pay for the same job. Men remain disproportionately represented in the highest-paid operational and commercial roles, such as COO and CFO; tend to have longer average tenure in NEO positions; and are more likely to serve at larger companies with higher pay scales.
Reviewing individual roles reinforces this interpretation. In both indices, men CHROs, COOs, and CLOs generally earn slightly more than their women counterparts, though differences are often modest and, in some years, nearly closed. Notably, in the Russell 3000, women CFOs slightly outearned men CFOs in 2025, with median compensation of $2.64 million versus $2.61 million. This crossover likely reflects the growing strategic importance of the CFO role—particularly around capital allocation, transformation, and risk management—combined with a relatively strong pipeline of women in senior finance leadership.
The CMO role stands out as an outlier, particularly in the S&P 500. While the sample of women CMOs remains small, median total compensation for women CMOs reached $8.3 million in 2025, well above the $6 million median for men CMOs. This disparity is likely driven by a small number of very highly paid women CMOs at large companies, underscoring both the volatility of CMO compensation and the sensitivity of medians to limited sample sizes. These figures should therefore be interpreted cautiously and not as evidence of a systematic pay advantage.
Overall, the data suggest that gender differences in NEO compensation are driven less by within-role pay disparities and more by differences in role distribution, career pathways, and access to the highest-paid executive positions. As enterprise-wide and operational roles continue to command the greatest compensation premiums, boards should focus less on aggregate pay gaps and more on how leadership pipelines, role assignments, and succession planning shape who advances into those roles in the first place.
Conclusion
NEO disclosures increasingly reflect a C-Suite shaped by enterprise risk, complexity, and volatility rather than by operating scale alone. While CFOs and COOs remain central, boards are elevating and rewarding functional leaders whose mandates span regulation, governance, talent, technology, and commercialization. At the same time, business unit leadership is receiving less formal visibility and newer executive roles remain unevenly institutionalized. For boards and compensation committees, these patterns raise important questions about succession resilience and whether current NEO structures continue to align with how value—and risk—are managed across the enterprise. For investors and proxy advisors, shifts in role prevalence may provide additional context for assessing governance priorities beyond compensation levels alone.
This article is based on corporate disclosure data from The Conference Board Benchmarking platform, powered by ESGAUGE.
