 Print
PrintSubodh Mishra is the Global Head of Communications at ISS STOXX. This post is based on an ISS-Corporate memorandum by Douglas Clare, Managing Director for Cyber Solutions at ISS-Corporate; and Jim Coggeshall, Executive Director for Cyber Risk Research at ISS STOXX.
Introduction
It is well known that cyber security incidents can have an immediate and meaningful impact on the share values of publicly traded companies. What’s less understood is the depth and duration of that damage and what kind of companies suffer the most.
While a handful of studies have been put forward on the impact of cyber incidents on the shareholders of publicly traded firms, these analyses have largely been anecdote-driven rather than broad-based assessments.
A new study conducted jointly by ISS STOXX and ISS-Corporate examined the impact of reported cyber incidents on share values across the U.S. Russell 3,000 index over a three-year period from 2022 through 2024.
The study shows that firms reporting significant cyber incidents underperform the market (as measured by share price) by nearly 5% on average. It also demonstrates that this underperformance is sustained over a year or more.
The results underscore the importance of maintaining an ongoing program of cyber risk measurement, cyber risk management, and continuous improvement. Diligence in managing technical risks and in ensuring sound governance oversight are critical to protecting equity stakeholders from the most negative outcomes.
Key Takeaways
- While share price underperformance manifests quickly, it is also sustained and builds over time.
- This study confirms continued share price underperformance at one full year after incidents are first reported, with a peak negative average impact of nearly -4.9% after 250 trading days.
- The Finance and Banking sector, as well as the Health Care sector, show higher negative average impacts to relative share price in the months following a reported cyber incident (peaking at -8.5% and -8.3%, respectively).
Scope of Analysis and Source Data
This study measures the correlation between reported cyber incidents and share price performance across the Russell 3000 index from 2022 through 2024. (For more details on the exact approach used in generating the analysis, please see the Methodology section at the end of this document.) With nearly 3,000 firms analyzed, it represents a broad swath of publicly traded firms in the U.S. market. While it is a broad analysis, readers should keep in mind the make-up of the Russell 3000 index, including its size and sector biases.
Incident data used in this analysis was drawn from two primary sources: events disclosed in SEC filings and those disclosed under the mandatory incident reporting requirements of various U.S. states. Most U.S. states have a mandatory reporting regime, and certain key data elements captured are consistent across the state frameworks. As larger firms with larger incidents are typically operating across a wide geographic region, the state reporting regime does a good job capturing significant incidents, even though not all states have the reporting requirement. This coverage and consistency enable a coherent analysis of incidents over a multi-year period.
Leveraging these cyber incident data sources, all of the incidents used in this analysis are self-reported by the company suffering the incident. While many smaller cyber attacks go unreported, there are no speculative or assumed incidents used in our analysis. To eliminate the “noise” of inconsequential incidents, the events analyzed only include those with 10,000 or more “impacted individuals,” a metric that is common to the US states included in the reporting frameworks leveraged by ISS. As a result, this analysis looks at the share price impact of 176 unique events, measured from the date the incident was first reported by the impacted firm.
The share price information leveraged by the study uses the adjusted closing price for all trading days during calendar years 2022, 2023, and 2024, taking into account the impact of share splits and reverse share splits over that period.
Findings
The study finds a significant and sustained impact on share price for Russell 3000 index companies experiencing a significant cyber event (defined as having impacted 10,000 or more individuals). Figures 1, 2, and 3 below describe the underperformance in mean log returns for cyber incident firms relative to the mean of equal weight overall log returns for the Russell 3000 index constituent firms over the three-year period of 2022 – 2024.
Figure 1
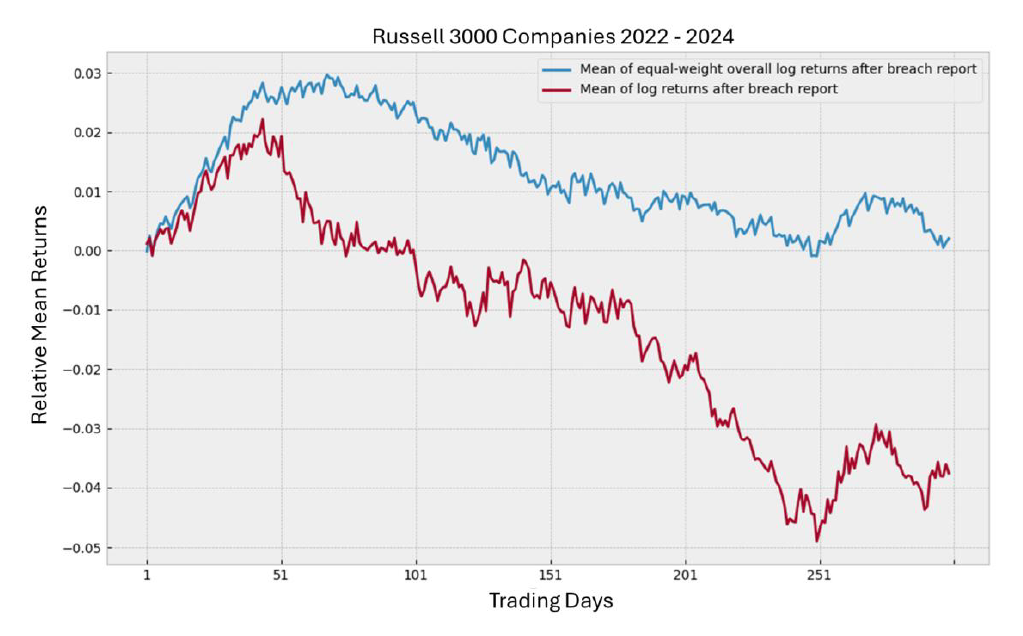
In Figure 1, the gap between the blue line (mean of equal-weight log returns) and the red line (mean log returns of incident companies) describes the share price performance gap for firms experiencing an incident, with trading days after incident report being measured along the x-axis. The performance gap is significant and sustained.
Figure 2
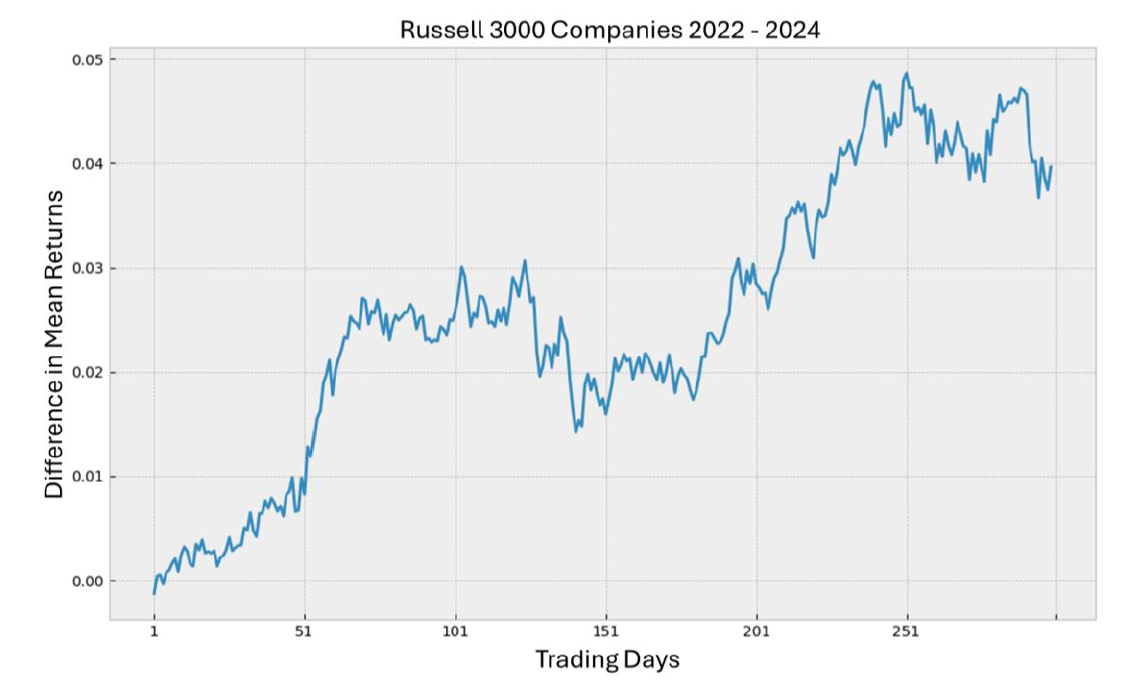
Figure 2 shows the difference between the mean log returns of the full population and the incident population – i.e. the difference in returns experienced by the overall Russell 3000 and the incident subset, or the distance between the red and blue lines from Figure 1. It represents the underperformance of the incident population.
For example, the average underperformance widens to 3% at 103 days after incident disclosure.
The incident population shows lower returns than the mean returns of the Russell 3000 within a few days after incident disclosure, and this gap in performance persists over the entire measurement period. Discrete values for the difference in returns at 50-day intervals is provided below.
Figure 3
| Russell 3000 Companies 2022-2024 | |
| Trading Days | Difference in Mean Returns |
| 1 | -0.13% |
| 51 | 0.83% |
| 101 | 2.59% |
| 151 | 1.59% |
| 201 | 2.84% |
| 251 | 4.86% |
| 299 | 3.96% |
The mean underperformance for incident-impacted firms grew over time and peaked 251 trading days after the incident report date at 4.86%
Sector Subsets
Two sectors accounted for more than half of the incidents reported during the time period of the study: Finance and Banking (30%) and Health Care (28%). Incidents were more widely spread across the eight other identified sectors, with no single industry accounting for more than 11%.
Figure 4
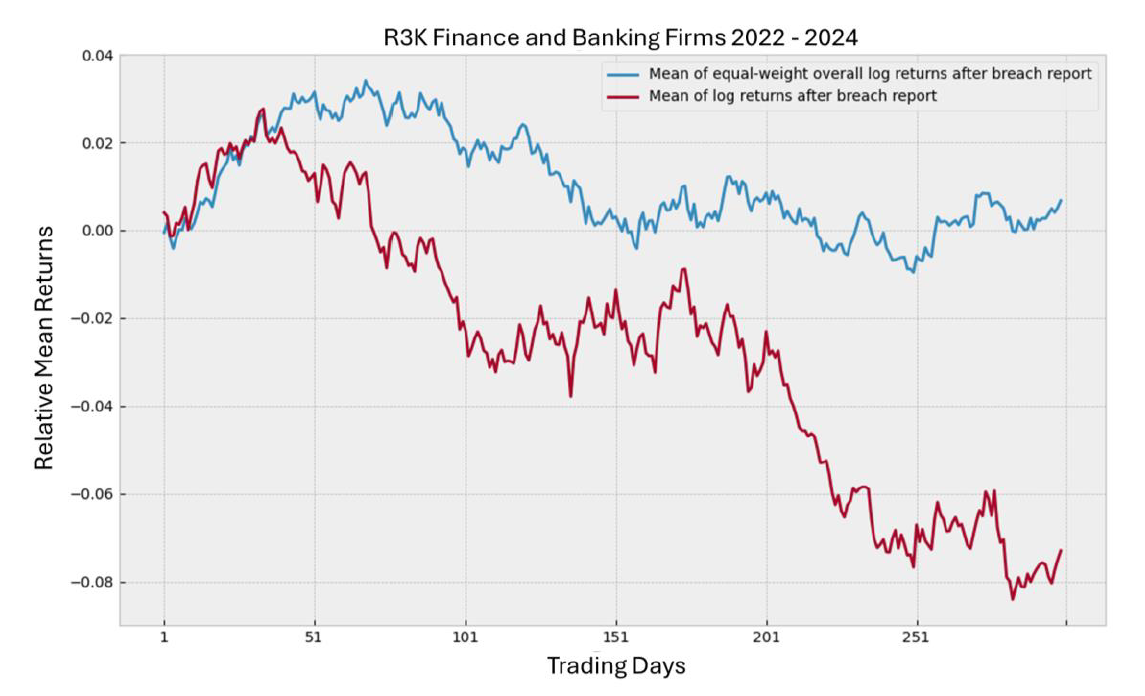
In Figure 4, the blue line represents the mean of the equal-weight log returns of the Russell 3000 Finance and Banking firms, by trading days along the x-axis. The red line represents the mean of log returns for only the incident subset within this specific sector. As with the broader population, the difference between the mean returns and the returns of the incident population is obvious and sustained, with incident firms underperforming.
Figure 5
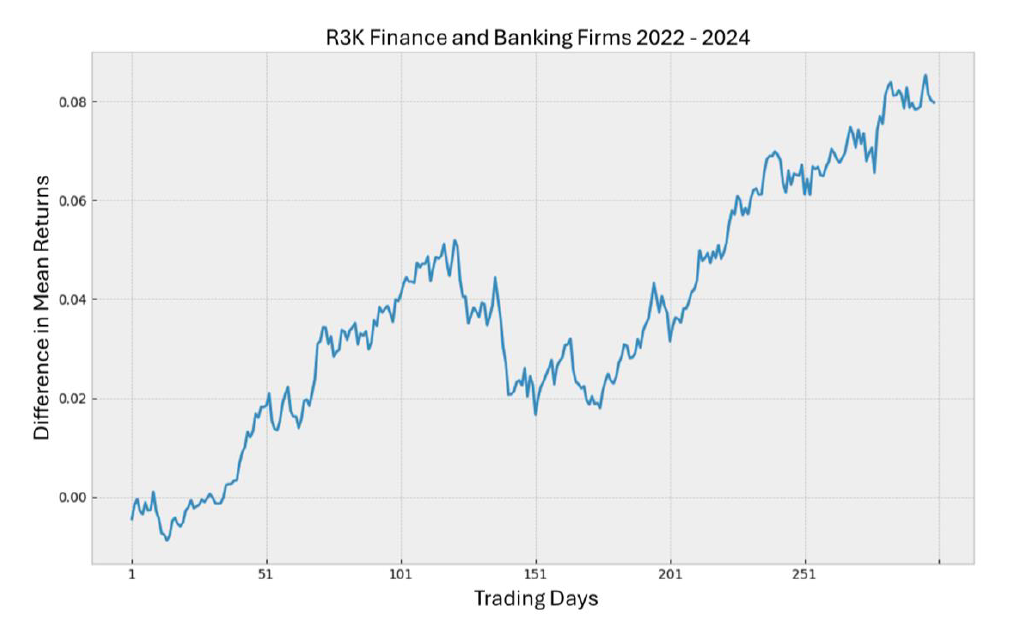
Figure 5 shows the difference between the mean log returns of the Russell 3000 Finance and Banking firms and the returns of incident population within this sector. – i.e. the difference in returns between the red and blue lines from Figure 4. It represents the underperformance of the incident population.
The incident population shows lower returns than the mean returns of the Russell 3000 Finance and Banking sector subset. Discrete values for the difference in returns at 50-day intervals are provided below.
Figure 6
| R3K Finance and Banking 2022-2024 | |
| Trading Days | Difference in Mean Returns |
| 1 | -0.45% |
| 51 | 1.85% |
| 101 | 4.10% |
| 151 | 1.67% |
| 201 | 3.15% |
| 251 | 6.11% |
| 299 | 7.97% |
The mean underperformance for incident-impacted firms in Finance and Banking grew over time, declined around the six-month mark, and began growing again thereafter. Mean underperformance peaked at 296 trading days post-incident at 8.53%.
Figure 7
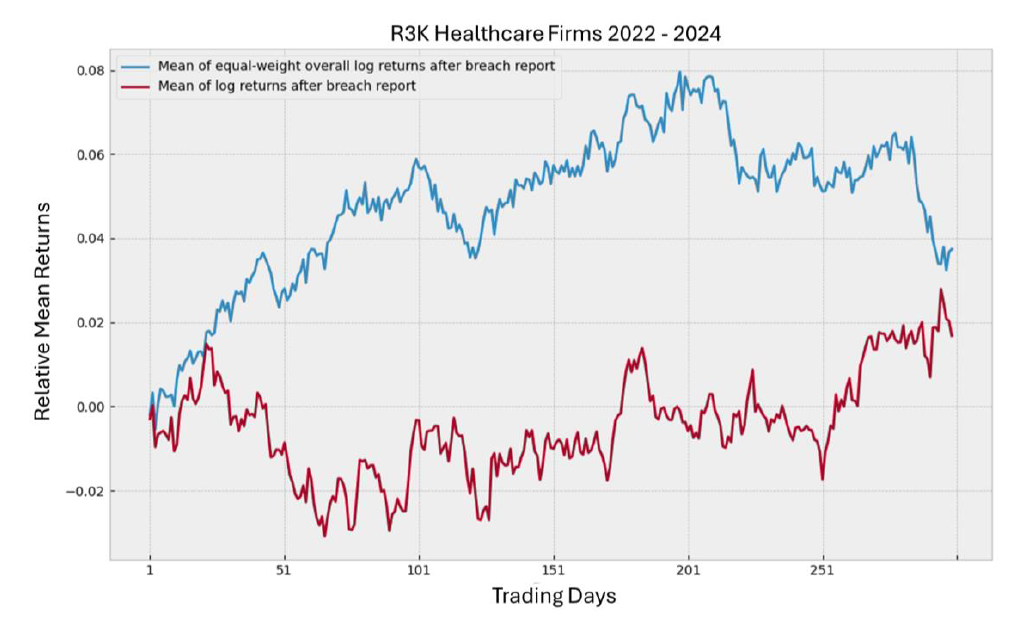
In Figure 7, the blue line represents the mean of the equal-weight log returns of the Russell 3000 Health Care firms, by trading days along the x-axis. The red line represents the mean of log returns for only the incident subset within the Health Care sector. As with the broader population, the difference between the mean returns and the returns of the incident population is obvious and sustained, with incident firms underperforming. In the Health Care sector, the performance difference is markedly reduced towards the end of the study’s performance window.
Figure 8
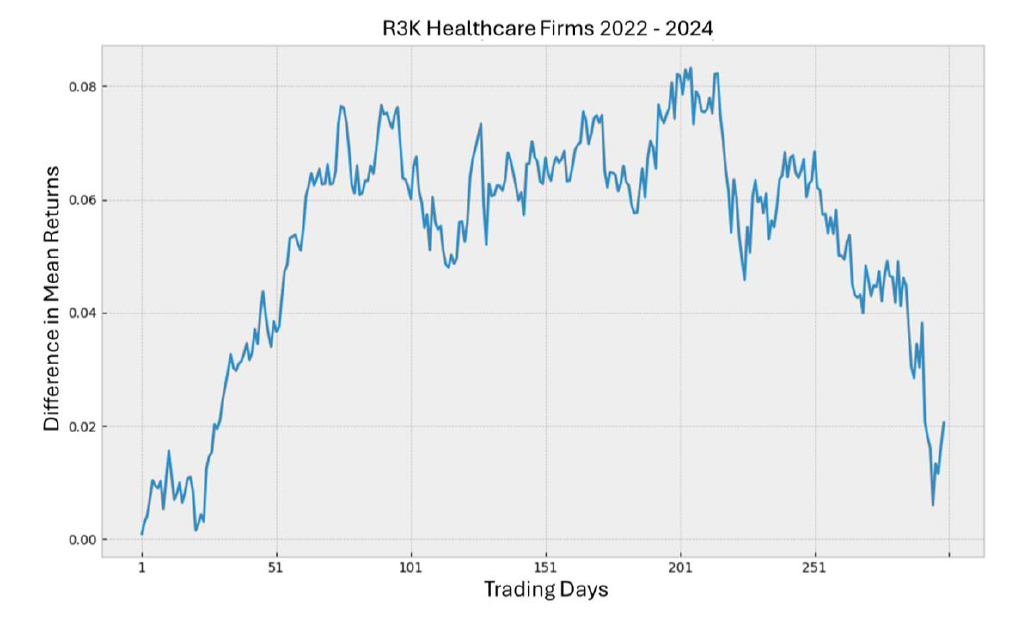
Figure 8 shows the difference between the mean log returns of the Russell 3000 Health Care firms and the returns of incident population within this sector. – i.e. the difference in returns between the red and blue lines from Figure 7. It represents the underperformance of the incident population.
The incident population shows lower returns than the mean returns of the Russell 3000 Healthcare sector subset. Discrete values for the difference in returns at 50-day intervals is provided below.
Figure 9
| R3K Healthcare 2022-2024 | |
| Trading Days | Difference in Mean Returns |
| 1 | 0.10% |
| 51 | 3.67% |
| 101 | 6.01% |
| 151 | 6.74% |
| 201 | 8.18% |
| 251 | 6.85% |
| 299 | 2.06% |
The mean underperformance for incident-impacted firms in Health Care grew over time and peaked 205 trading days post-incident at 8.31%. As stated above, while underperformance was sustained over the analysis period, the performance gap closed substantially by the one-year mark.
Conclusions
While many factors impact the share price performance of individual firms and the broader market, this broad-based study clearly demonstrates a significant and sustained reduction in returns for firms suffering a significant cyber event in the time period following incident disclosure.
While many previous studies have identified a share price performance impact, these have often been based on smaller sample sets and “inclusion by anecdote.” This broad market study of the constituent companies of a major index and its more comprehensive and systematic accounting of reported incidents provides new and powerful evidence of the shareholder impacts of cyber events. Cyber incidents are not just momentary annoyances or quickly forgotten news items. Firms that report significant cyber incidents suffer material and sustained impacts to share price performance relative to sector and broader market peers.
ISS-Corporate’s cyber risk solutions provide useful insights for companies looking to measure, understand, and reduce the cyber risks that they face. The ISS Cyber Risk Score is a concise, empirical, and forward-looking metric that corresponds to the likelihood of a future cybersecurity incident. It is powered by a machine learning model trained on real breach incident exemplars to understand the mathematical relationship between risk signals and cyber incident outcomes.
The ISS Cyber Risk Score is packaged with insightful tools that help companies understand and address cyber risk, benchmark performance against relevant peers, and assess third and fourth-party exposures. A robust program of management that includes the ISS Cyber Risk Score can also contribute to a defensive diligence posture – a deliberate and demonstrable strategy for the proactive management of cyber liability.
The full report can be found here.
