Print
Print E-Mail
Lubos Pastor is the Charles P. McQuaid Distinguished Service Professor of Finance, Taisiya Sikorskaya is an Assistant Professor of Finance and a Fama Faculty Fellow, and Jinrui Wang is a Research Professional, all at the University of Chicago Booth School of Business. This post is based on their recent paper.
Market Concentration and Fund Regulation
The U.S. stock market has become highly concentrated. Between 2015 and 2024, the share of the ten largest stocks in total U.S. market capitalization rose from 13% to 31%. In large-cap growth, it rose from 30% to 48%. By the end of 2024, the “Magnificent 7” stocks alone represented roughly one-third of the S&P 500 and more than half of the Russell 1000 Growth Index.
This rise in concentration has received substantial attention, often in connection with market power and the rise of a handful of dominant firms. We examine a different implication. As a few stocks have come to dominate major benchmarks, an old diversification rule has begun to bind, forcing funds to trim the largest stocks, with consequences for fund performance and stock prices.
Figure 2 illustrates why this interaction matters today: stock market concentration has risen rapidly just as mutual funds and exchange-traded funds (ETFs) have become much larger holders of U.S. equities.

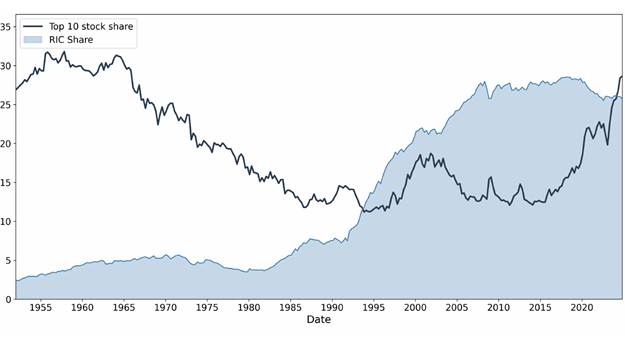
Figure 2. Stock market concentration and RIC equity ownership. The line plots the market capitalization share of the ten largest stocks; the shaded area plots the share of U.S. corporate equities held by Regulated Investment Companies (RICs). The figure shows both the recent jump in concentration and the growing potential for asset-pricing effects as RICs have become larger holders of equities.
The relevant rule is the 50/5/10 rule. Most U.S. mutual funds and ETFs elect to be treated as Regulated Investment Companies under the Internal Revenue Code. To qualify, at least 50% of a fund’s assets must be in securities for which no issuer exceeds 5% of fund assets or 10% of the issuer’s voting securities.
In practice, this rule effectively limits the portfolio weights that a fund can place in large positions. Historically, the rule was often a formality for diversified equity funds. In a less concentrated market, few individual stocks had benchmark weights large enough to put a fund close to the limit. But when the largest companies become very large, especially in capitalization-weighted benchmarks, the same statutory test can become a meaningful constraint.
Consider a large-cap growth manager who is optimistic about Nvidia. If Nvidia is already a very large benchmark position, overweighting it may increase the risk that the fund violates the 50/5/10 rule. The manager may therefore hold less Nvidia than she otherwise would. The same logic applies to other mega-cap stocks. When investors face limits on the size of their largest positions, these limits can reduce aggregate demand for mega-cap stocks.
How Binding Has the Rule Become?
We study quarterly holdings for 4,745 U.S. domestic equity funds from 2019 through 2024. For each fund-quarter, we measure the fund’s regulatory “buffer” as 50% minus the sum of its large positions. Negative buffers indicate a breach; small positive buffers indicate proximity to the constraint. We classify funds with buffers between 0 and 5% as constrained.
The first fact is that the 50/5/10 rule has become increasingly binding. Constrained fund assets were negligible in 2019Q3. By 2024Q4, they represented 6% of total domestic equity fund assets. At the peak in 2024Q3, 171 funds were constrained, managing almost $1.4 trillion, or 8% of total assets. The effect is especially pronounced among large-cap growth funds. In 2024Q3, about one-third of those funds were constrained, managing more than $1.1 trillion, roughly half of the category’s assets.
The second fact is that the constraint increasingly operates through benchmarks. We apply the same buffer concept to major equity indexes. Index buffers have fallen across the board, but the decline is especially steep for large-cap growth indexes, whose buffers approached zero in 2024. The Nasdaq-100 provides a vivid example. In 2023, the index implemented a special rebalance that reduced the weights of its largest constituents—the Magnificent 7 stocks—to avoid breaching the concentration limits.
Benchmark concentration matters for both passive and active funds. Passive funds inherit the benchmark’s small buffer. Active funds are affected too, because many manage relative to benchmarks and avoid large tracking error. In a concentrated market, the regulatory constraint therefore reaches beyond index funds.
Fund Behavior and Performance
When funds approach the 50/5/10 limit, they rebalance away from their largest positions and toward smaller-cap stocks. Trimming is stronger when large positions are near the 5% threshold and more volatile, consistent with higher compliance risk. Funds also reduce overall equity exposure, substituting non-equity assets such as cash for large equity holdings.
These adjustments appear costly. In regressions with fund fixed effects, large-cap growth funds perform worse when constrained. Over 2019-2024, their risk-adjusted returns are significantly lower over the next six months. In the first three months, the average four-factor-adjusted return is 57 basis points lower; the effect is larger in 2023-2024, when the constraint was tightest. Funds with negative buffers underperform even more.
Implications for Stock Prices
Why would constrained funds underperform? One possibility is that they are forced to sell or underweight stocks that subsequently perform well. This observation leads to the paper’s asset-pricing implication. Just as short-sale constraints can lead to overpricing by preventing pessimistic investors from expressing their views, long-position constraints can lead to underpricing by preventing optimistic investors from scaling their positions.
To test this prediction, we construct a stock-level measure of constrained ownership. For each stock and month, we calculate the fraction of outstanding shares held as large positions by funds whose buffers are below 5%. We call this measure C. Intuitively, stocks with positive C may be underpriced as they are likely to be underweighted by constrained funds.
The set of affected stocks has grown dramatically. The total market capitalization of stocks with positive C rose from $11 trillion in 2019Q3 to $41 trillion in 2024Q4, more than 60% of aggregate U.S. market capitalization. Many affected stocks are large-cap growth stocks; for example, Nvidia and Microsoft had C values around 5%.
Consistent with underpricing, C positively predicts risk-adjusted returns among large stocks, especially in 2023-2024, when the 50/5/10 constraint was tightest. During that period, stocks with positive C significantly outperform zero-C stocks over horizons from one to twelve months. At the six-month horizon, their cumulative abnormal returns are 2.3% higher. The return differential is larger for high-volatility stocks, which pose greater compliance risk.
Trading strategies based on C tell a similar story. A value-weighted high-C portfolio earns annualized four-factor alphas of 1.7% over 2019-2024 and 2.3% over 2023-2024. A high-C, high-volatility portfolio earns larger alphas, 7.9% and 11.8%, respectively. The sample is short and the alphas are only marginally significant, but the evidence is notable because affected stocks are among the largest and most liquid equities.
Active Funds, Passive Funds, and a Softer Rule
The active-passive distinction helps interpret the mechanism. Both active and passive funds trim large positions as they approach or violate the 50/5/10 limit, and both underperform when constrained. But constrained ownership by active funds has more power to predict stock returns. This pattern is consistent with the idea that the rule matters most for prices when it limits the positions of investors with favorable information or optimistic views.
Although our main focus is the 50/5/10 rule, we also examine the 75/5/10 rule under the Investment Company Act of 1940, which applies to funds classified as diversified. This rule is softer in practice, but we find similar, though weaker, patterns. Diversified funds near the 75/5/10 limit trim large positions more aggressively than non-diversified funds, experience modest performance drag, and generate some return predictability.
Policy Takeaway
Our findings have implications for fund regulation, benchmark design, and market efficiency. Diversification rules protect investors from excessive concentration. But when capitalization-weighted benchmarks themselves become highly concentrated, those rules can bind large parts of the fund industry, reducing funds’ ability to hold passive benchmarks, limiting the expression of optimistic views, and distorting prices of the largest firms.
This does not imply that diversification requirements are undesirable. They serve an important investor-protection role. But our evidence suggests that their costs and consequences depend on the structure of the market. In a market dominated by a small number of mega-cap stocks, a reassessment of the 50/5/10 rule seems appropriate. The key policy question is not whether funds should be diversified, but how diversification rules should operate when the funds’ benchmarks have themselves become highly concentrated.
See the full article here.