Print
Print E-Mail
Paul Hodgson is a Senior Contributor, Governance & Sustainability Center, and Andrew Jones is a Principal Researcher, Governance & Sustainability Center, at The Conference Board, Inc. This post is based on a report developed by The Conference Board in partnership with ESGAUGE, FW Cook, and Ropes & Gray and co-authored by Mr. Hodgson and Mr. Jones.
This report examines how US public companies use financial and nonfinancial performance metrics in executive incentive plans, including where they appear, how heavily they are weighted, and what they signal about changing board priorities. Across short-term incentive (STI) and long-term incentive (LTI) plans in the Russell 3000 and S&P 500, the data point to greater selectivity in nonfinancial measures rather than a broad retreat from them.
Trusted Insights for What’s Ahead®
- Nonfinancial metrics are common and extend beyond environmental, social & governance (ESG) measures, although boards are becoming more selective about their usage.
- In 2025, just over half of Russell 3000 and S&P 500 companies used both financial and nonfinancial metrics in STI plans, while exclusive reliance on nonfinancial STI metrics remained rare outside health care and the smallest companies.
- The STI metric mix is becoming more discerning: broad ESG-labeled metrics, environmental metrics, and human capital metrics have declined, while governance, social, cash flow, and expense metrics, as well as use of board discretion, have increased.
- For individual nonfinancial and ESG-related STI categories, S&P 500 companies report materially higher use than those in the broader Russell 3000, even though both indexes have similar shares of companies using a mix of financial and nonfinancial STI metrics.
- When companies use both financial and nonfinancial STI metrics, financial measures still carry most of the payout opportunity, typically weighted about 70% to 75%.
- LTI plans remain much more financially led, with total shareholder return (TSR), profit, return, and revenue dominating and nonfinancial metrics used selectively.
Financial and nonfinancial performance metrics are disclosed in executive incentive plans for CEOs and named executive officers (NEOs) at US public companies. These metrics are typically disclosed in proxy statements, especially in the Compensation Discussion and Analysis (CD&A). Compensation amounts are also reported in the Summary Compensation Table (SCT).
This report analyzes the prevalence and weighting of these metrics, drawing on data for the 2023, 2024, and 2025 filing years for Russell 3000 and S&P 500 companies. Metric categories are not mutually exclusive: for example, a company may use profit, revenue, human capital, board discretion, and other nonfinancial measures in the same plan. Weighting analysis is based only on companies that disclose the relative weight they assign to financial and nonfinancial metrics.
What Counts as Financial and Nonfinancial Performance
Executive incentive plans have long been anchored in financial performance. Revenue, profit, cash flow, return, balance sheet strength, and TSR remain the primary measures by which boards assess whether management has delivered. But many companies also use nonfinancial metrics to capture dimensions that financial and market results may miss.
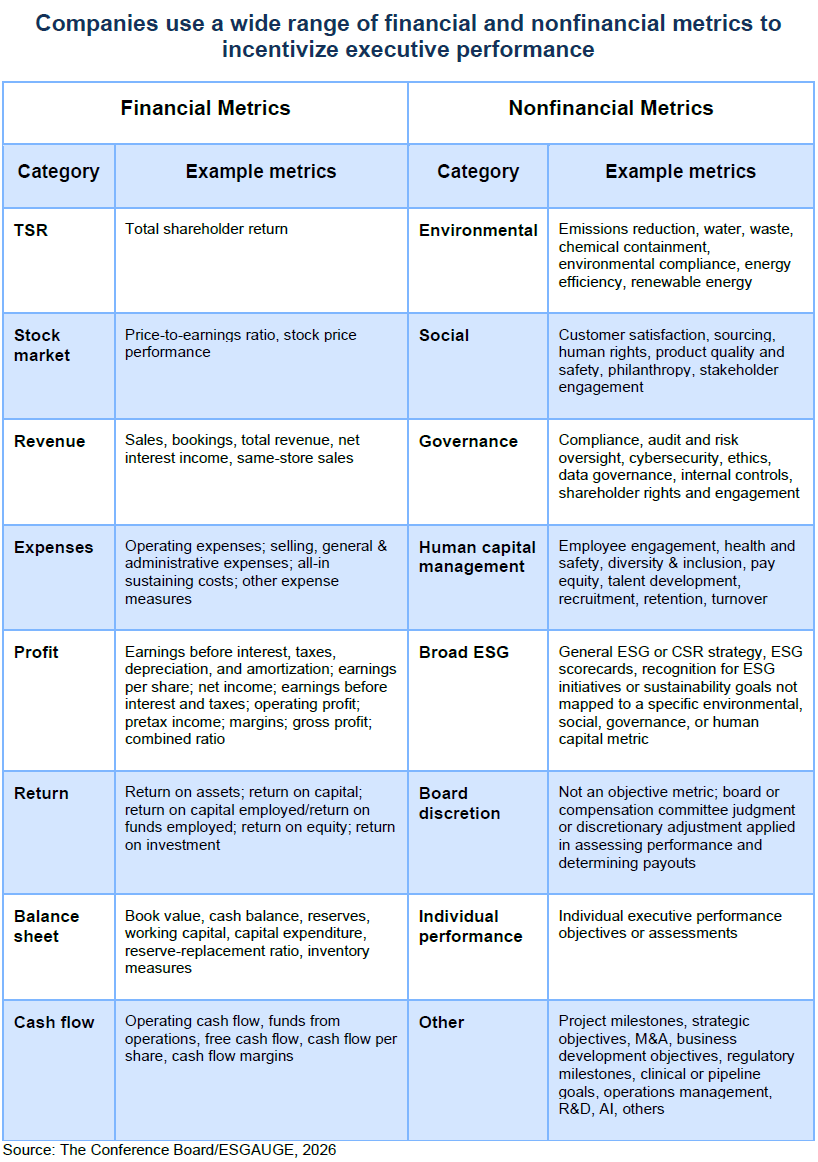
Financial metrics are measures tied directly to financial statements, valuation, capital-market performance, or economic return. Nonfinancial metrics are measures tied to execution, operations, strategy, workforce, governance, environmental and social performance, board judgment, and individual performance. ESG-related measures are treated as a subset of nonfinancial metrics. For the purposes of this report, “ESG” refers to general environmental, social & governance or corporate social responsibility scorecards, goals, or labels; specific environmental, social, governance, and human capital measures are captured separately. In practice, companies use many types of metrics within these broad categories (Figure 1).
Nonfinancial metrics are not inherently “soft”
When clearly defined, they can capture business priorities that financial results may miss, such as safety, regulatory progress, customer outcomes, workforce stability, and strategic milestones. Their significance depends on the business model, how the metric is defined, the time horizon, the plan type, and the weight assigned. For example, a safety modifier in an STI plan is different from assigning 30% of an annual bonus to human capital or customer goals.
It is also important to distinguish metrics from board or compensation committee discretion. Discretion is not a performance measure; it is judgment applied in assessing results or determining payouts. That distinction applies to both financial and nonfinancial measures. Financial metrics may appear more objective, but they can become less transparent when they rely on non-GAAP adjustments or discretionary carve-outs. In some cases, a clearly defined nonfinancial metric tied to strategy, risk, or long-term value creation may be more rigorous than a financial metric that depends heavily on discretionary adjustment.
Figure 1
Metrics in Short-Term Incentive Plans
Prevalence in STI plans
Figures 2a and 2b
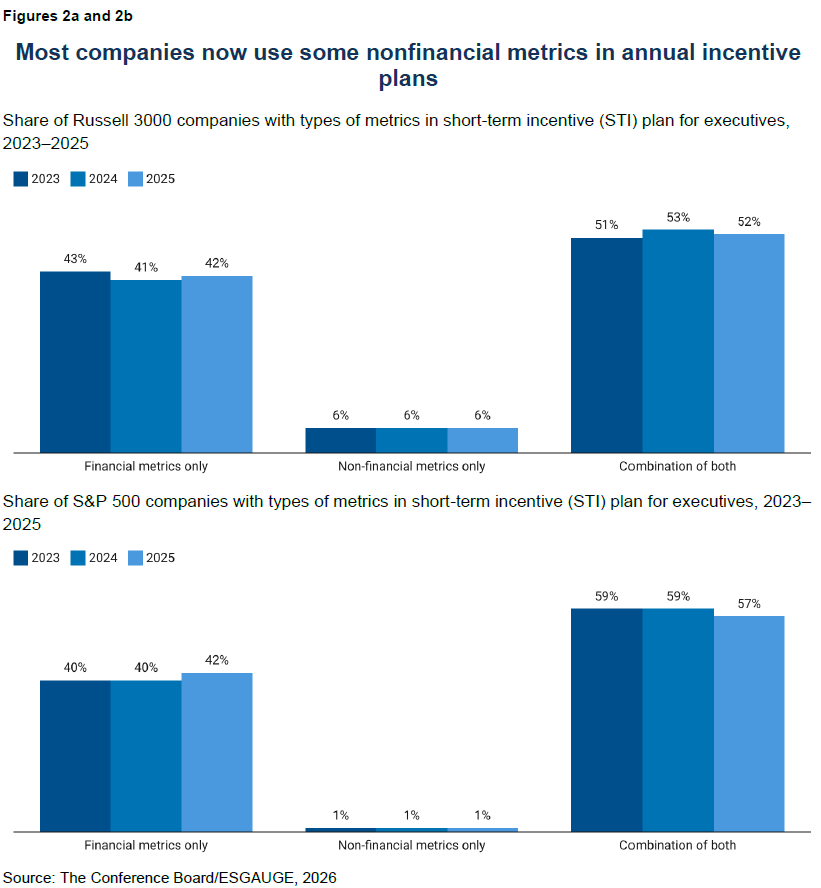
The use of nonfinancial performance metrics in STI plans is now a mainstream practice, though very few companies rely exclusively on such measures. Just over half of companies in both indexes use a combination of financial and nonfinancial metrics, compared with a little over two-fifths that use only financial metrics.
The overall mix of short-term incentive metrics has been relatively stable over the three-year period, with only a modest shift in 2025 toward financial-only plans. Boards do not appear to be abandoning nonfinancial measures, and most see value in balancing financial discipline with a wider view of executive performance.
Figure 3
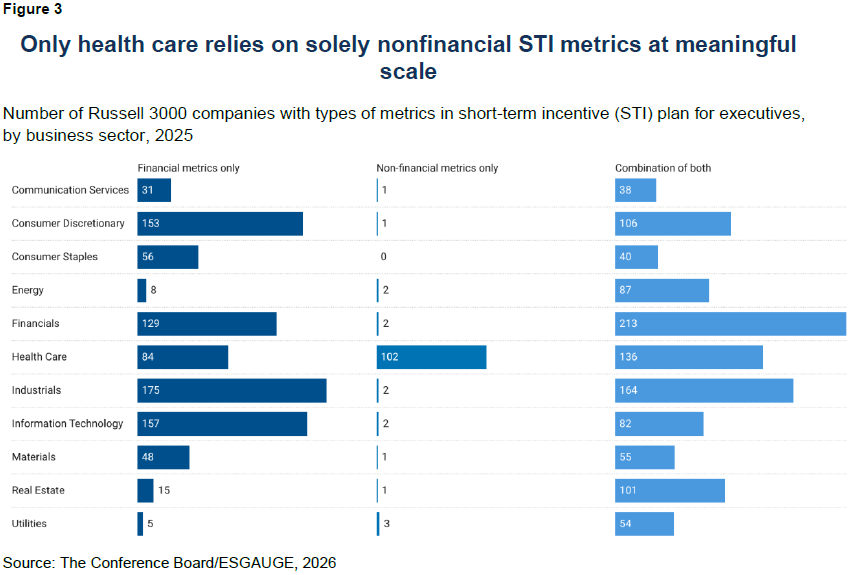
Exclusive use of nonfinancial STI metrics remains rare across most industries. Health care is the clear exception: nearly one-third of health care companies used only nonfinancial STI metrics in 2025, far more than any other sector.
That pattern reflects health care’s mix of business models. For precommercial biopharmaceutical companies, near-term financial metrics may be less meaningful than clinical, regulatory, product-development, or pipeline progress. For providers, payers, and other health care businesses, nonfinancial measures may capture core operating priorities such as business development objectives, patient outcomes, quality of care, service quality, workforce retention, compliance, accreditation, and regulatory milestones.
Figure 4
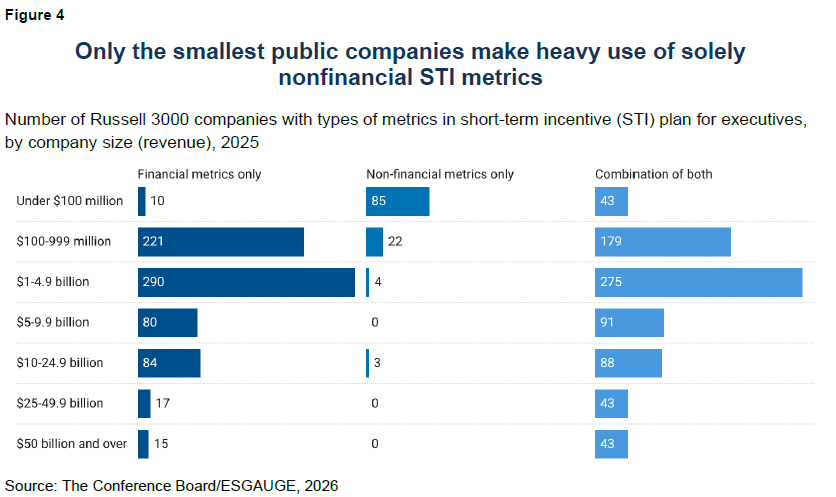
Use of only nonfinancial metrics is also more common among the smallest public companies by revenue. Among companies with annual revenue under $100 million, 62% relied exclusively on nonfinancial STI metrics in 2025—compared with 7% using only financial metrics. In the next revenue tier, $100 million to $999 million, only 5% used solely nonfinancial metrics.
At the earliest public-company stages, annual incentive design is often tied less to mature financial outcomes and more to operating, developmental, or strategic milestones. Profitability may be volatile, delayed, or not yet the clearest measure of management effectiveness. In that setting, nonfinancial metrics can help boards assess whether the business is building capability, scaling operations, or executing near-term priorities.
As companies mature, investor expectations also tend to evolve. Larger and more established companies generally face greater pressure to demonstrate financial discipline, predictability, and alignment between pay and financial performance.
Metric mix in STI plans
Analysis of the specific types of financial and nonfinancial metrics in STI plans shows selective refinement. Financial measures remain the foundation of annual incentive design (especially profit and revenue), but boards are adjusting the supporting metric mix—adding emphasis to some operational, governance, social, cash flow, and expense measures while moving away from broad ESG labels and, in some cases, environmental and human capital metrics (Figures 5a and 5b).
Figures 5a and 5b
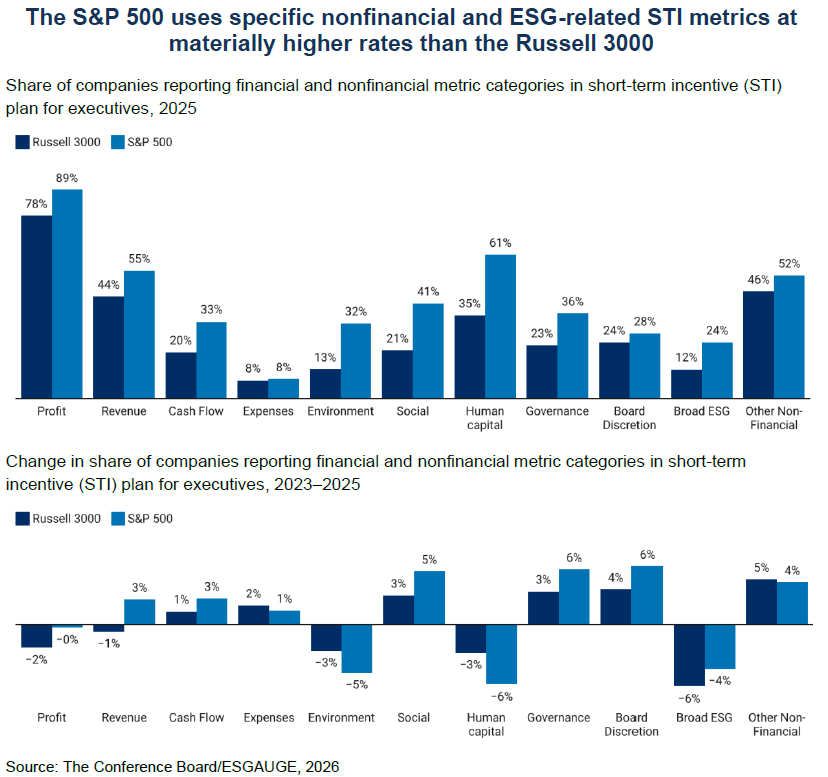
At the category level, in 2025, the S&P 500 premium was 26 percentage points for human capital, 20 points for social metrics, 19 points for environmental metrics, 14 points for governance metrics, and 12 points for broad ESG. That gap matters for benchmarking: large-cap practice is not simply a scaled version of broader public company practice.
The implication is not that companies are adding or removing ESG metrics as a block. They appear to be moving away from broad ESG labels and toward more targeted, business-specific nonfinancial measures that can be tied more directly to execution, risk, workforce, operational performance, customer outcomes, or strategy.
Weighting in STI plans
Figure 6
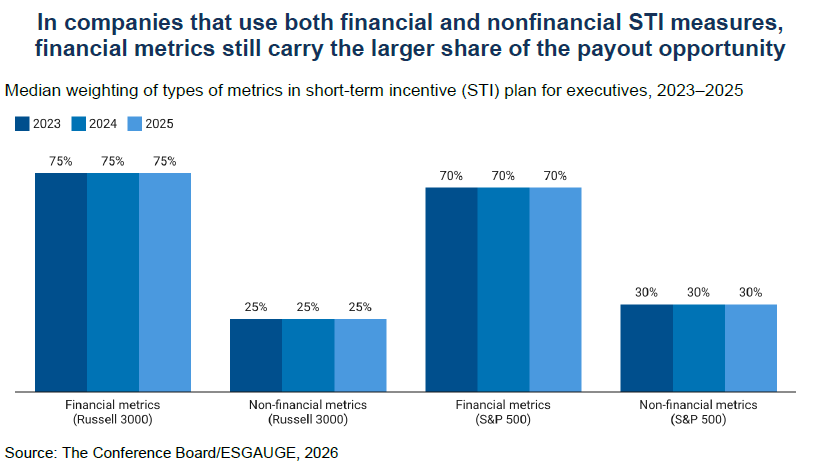
The typical weighting on financial to nonfinancial is approximately 70:30 in the S&P 500 and closer to 75:25 in the Russell 3000. Large-cap companies generally assign somewhat greater weight to nonfinancial measures than smaller and mid-cap peers do, but the basic pattern is that financial outcomes remain primary.
Figure 7
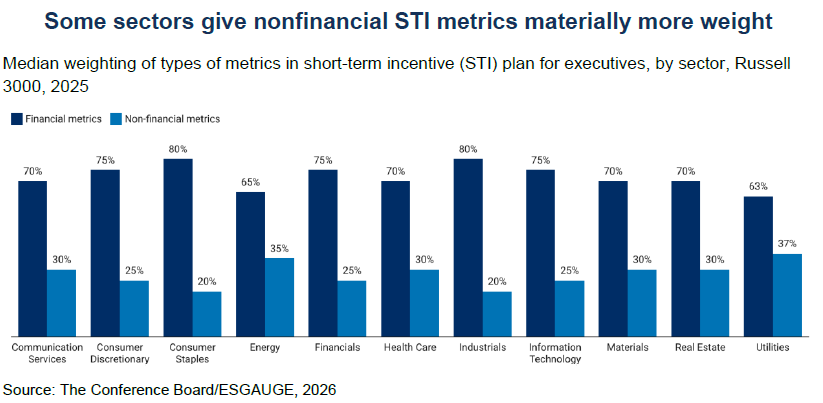
There are, however, important sector differences. In energy and utilities, nonfinancial measures account for more than one-third of performance assessment; in health care, they account for 30%, above the Russell 3000 median of 25%.
That likely reflects where boards see the most relevant value and risk drivers. In health care, nonfinancial metrics often capture clinical, regulatory, developmental, or patient-related performance. In energy and utilities, they are more often tied to safety, environmental performance, system reliability, operational discipline, and regulatory exposure. These are not cosmetic additions; they reflect areas where annual performance can affect value preservation and enterprise risk.
Figure 8
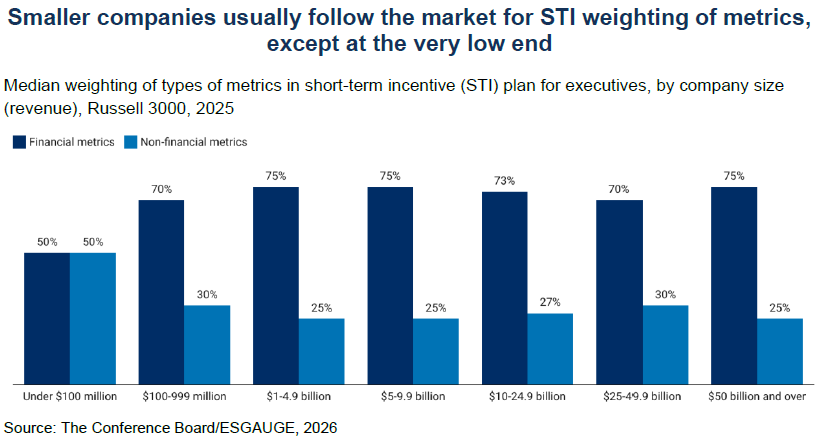
By revenue, most companies follow the broader Russell 3000 pattern of approximately 75:25. The exception is companies with annual revenue under $100 million, where the split is 50:50. Among these firms, nonfinancial metrics can carry equal weight with financial measures.
This suggests that the smallest companies use incentive plans differently, often treating nonfinancial measures not as modifiers but as core indicators of management performance. As companies scale, incentive structures become more standardized and the relative weight of financial metrics rises.
Metrics in Long-Term Incentive Plans
Prevalence in LTI plans
Figures 9a and 9b
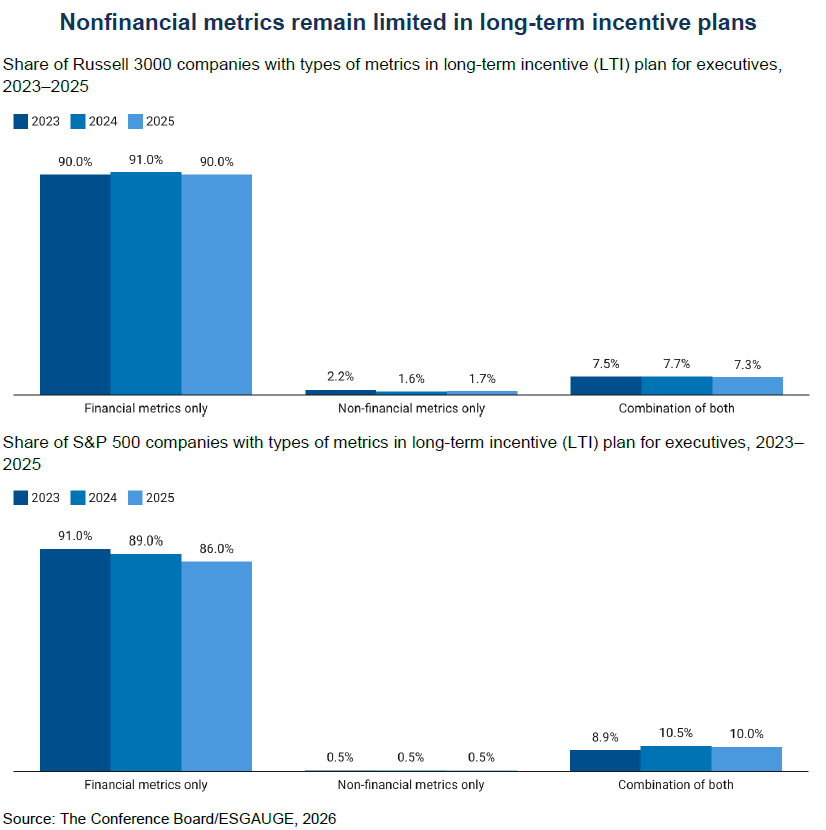
The picture changes materially in LTI plans, where ESG and other nonfinancial measures are rarely used. That is true both for companies that combine financial and nonfinancial metrics and, even more so, for those that rely solely on nonfinancial measures.
The distinction between STIs and LTIs is revealing. Boards appear far more comfortable using nonfinancial metrics to shape annual pay than long-term pay. In designing incentives for longer time horizons, most companies assign nearly all weight to financial performance and shareholder return. LTIs remain the part of the compensation program most closely tied to capital-market discipline and long-term value realization.
Figure 10
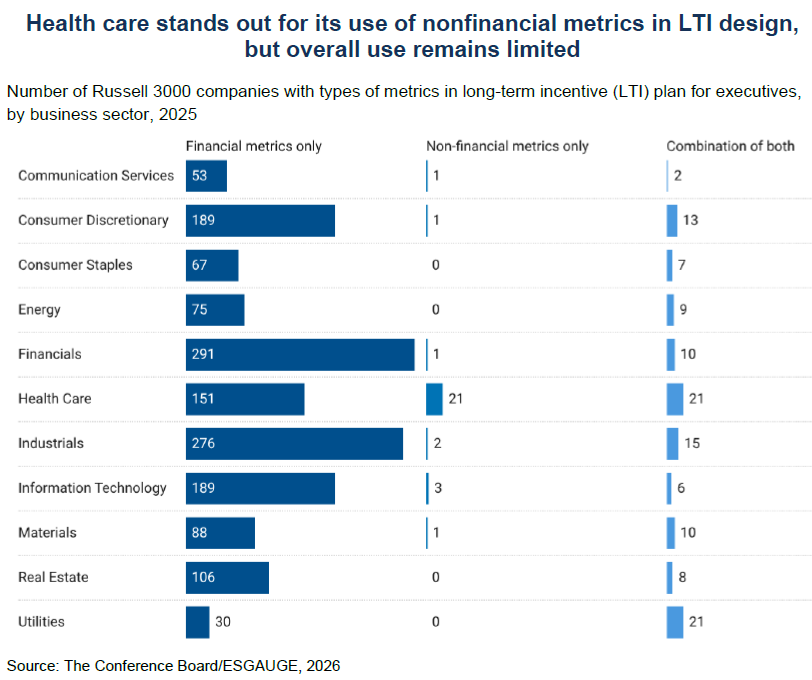
Across most industries, the number of companies using only nonfinancial metrics in LTIs is either zero or in the single digits. Health care is again the clear outlier, reflecting the sector’s dependence on clinical, developmental, human capital, service quality, regulatory, and other nonfinancial outcomes.
Health care also has the highest number of companies using a combination of financial and nonfinancial metrics in LTIs. Other industries with double-digit use of combined metrics are consumer discretionary, financials, industrials, materials, and utilities. Even in those sectors, however, the use of nonfinancial metrics in LTIs remains limited relative to their use in STIs.
Figure 11
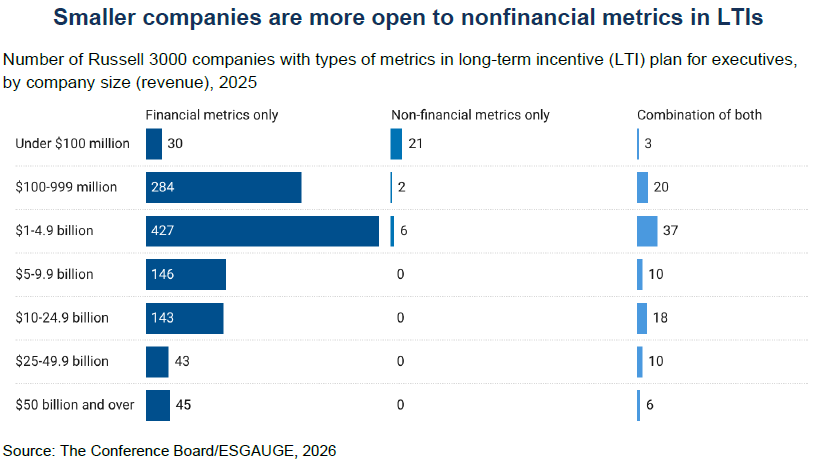
Smaller companies show greater use of nonfinancial metrics in LTI plans. They are more likely to use either solely nonfinancial metrics or a combination of financial and nonfinancial measures.
That may reflect differences in business maturity, growth profile, and governance needs. Smaller companies are often still building their operations, leadership teams, product pipelines, and strategic positions. Boards at those firms may therefore use LTIs not only to reward long-term financial outcomes, but also to reinforce developmental or execution priorities. Smaller and growth-stage companies may also have more difficulty setting reliable three-year financial targets, making selected nonfinancial milestones more relevant. Larger companies, by contrast, tend to have more standardized compensation frameworks and greater external scrutiny, which may push LTIs toward more traditional financial and market-based structures.
Metric mix in LTI plans
Analysis of specific LTI metric categories shows a more conservative pattern than in STI plans. Long-term incentives remain anchored in shareholder return and financial performance, with nonfinancial and ESG-related metrics used selectively and much less prevalently.
The S&P 500 premium is concentrated in conventional LTI metrics rather than nonfinancial categories. In 2025, S&P 500 prevalence exceeded Russell 3000 prevalence by 14 percentage points for TSR, 7 points for profit, 5 points for revenue, 5 points for return, and 3 points for cash flow. Among nonfinancial metrics, the largest premiums were smaller: 4 points for environmental metrics, 2 points for human capital, and 2 points for board discretion.
Figures 12a and 12b
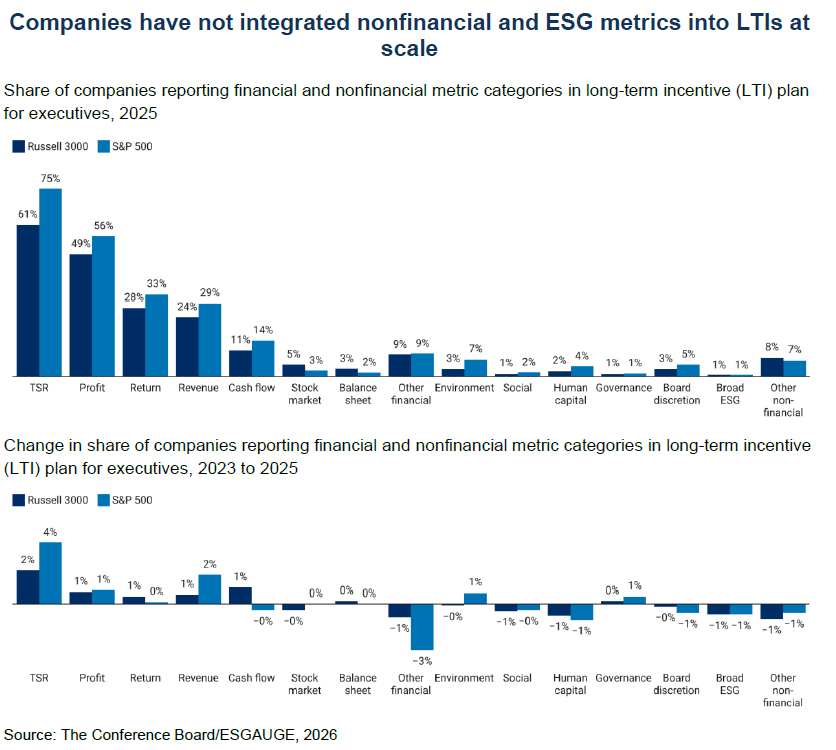
The implication is that companies are not moving nonfinancial and ESG metrics into LTIs at scale. Boards continue to reserve long-term incentive plans primarily for shareholder return, profitability, capital efficiency, revenue growth, and cash flow. Where nonfinancial LTI metrics are used, they appear selective and company specific rather than part of a broad market shift.
Weighting in LTI plans
Figure 13
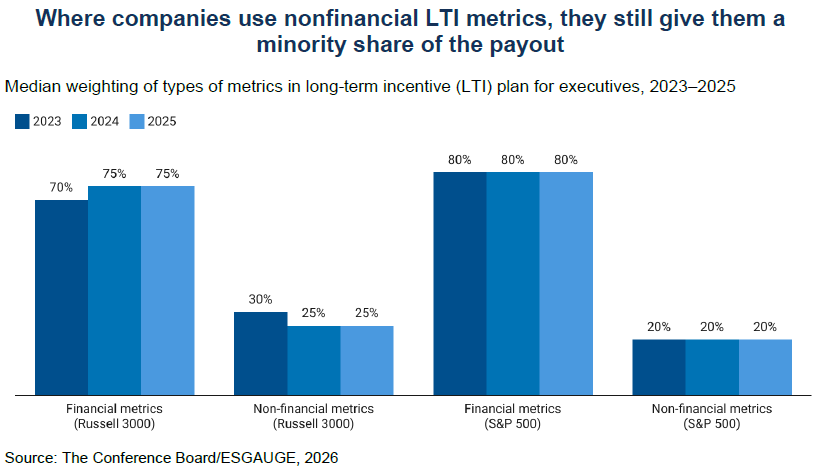
Among companies that use both financial and nonfinancial metrics in LTIs, nonfinancial measures typically account for 20% to 30% of the weighting. In the Russell 3000, the median split was 75:25 in 2025 and 2024, compared with 70:30 in 2023. In the S&P 500, the median split was 80:20 throughout the period.
The weighting analysis is based on a smaller sample than the broader usage analysis because only a subset of companies that disclose metric use also disclose relative weighting. Results should therefore be interpreted directionally, although the implication is clear: even where nonfinancial metrics appear in LTIs, they generally remain secondary.
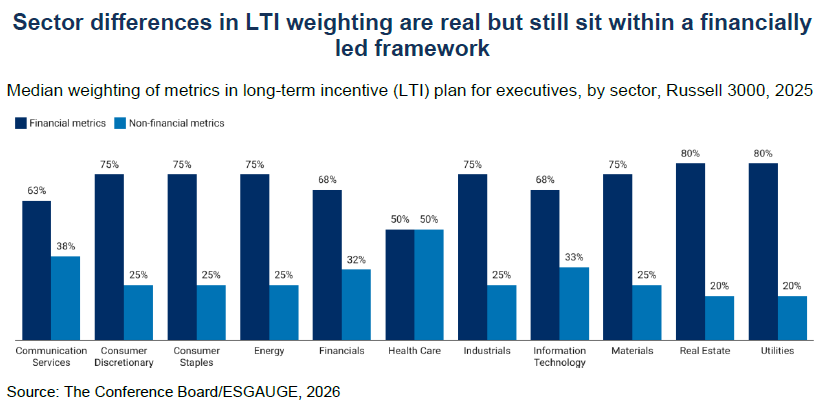
At the industry level, the weighting analysis broadly mirrors the wider sample. In some sectors, most notably health care, nonfinancial metrics can account for as much as half of total weighting. In communication services, financials, and information technology, the split is closer to two-thirds financial and one-third nonfinancial.
These variations suggest that, where boards use nonfinancial metrics in LTIs, they often do so for sector-specific reasons. Some industries have business models where talent, customer outcomes, innovation, regulatory performance, clinical progress, or operational resilience are difficult to separate from long-term value creation. Even so, most sectors remain financially led.
Figure 14
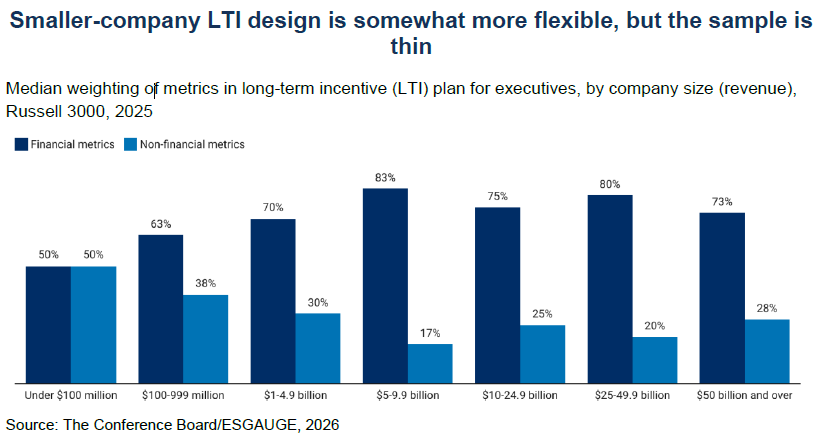
In the company-size analysis, sample sizes are small and results should be interpreted with caution. Even so, the data again suggest relatively greater reliance on nonfinancial metrics among smaller companies. Alongside the prevalence data, this points to a consistent pattern: smaller firms appear somewhat more flexible in how they reward long-term performance. That does not mean they are less disciplined. More likely, it reflects a different stage of development, in which leadership incentives need to capture strategic and organizational progress alongside financial outcomes. For newer or growth-stage companies, the challenge of setting reliable multiyear financial targets may also make objective nonfinancial milestones a useful complement to financial metrics.
Figure 15
Conclusion
Nonfinancial metrics in executive pay are often viewed through the narrower lens of whether companies are adopting or retreating from ESG-linked pay. The data suggest a more nuanced shift: boards are not abandoning nonfinancial measures but becoming more selective about which measures belong in pay plans and how they connect to business performance.
Investor expectations are also changing. Many investors remain skeptical of metrics that are hard to measure, weakly disclosed, or disconnected from financial results, even as they recognize that long-term value depends on more than earnings or TSR. Boards must preserve financial discipline while showing how selected nonfinancial metrics support resilience, execution, and durable value creation.
The same scrutiny should apply to the use of discretion. A financial metric is not necessarily more rigorous merely because it is financial, especially if non-GAAP adjustments or discretionary carve-outs play a significant role in determining achievement. Conversely, a nonfinancial metric is not necessarily less rigorous merely because it is not drawn directly from the income statement, balance sheet, or stock price. The key is not the label attached to the metric, but whether the measure is objective, measurable, material to the business, understandable, appropriately weighted, and clearly disclosed.
The next phase of nonfinancial metrics may look different from the ESG metrics of the past decade. As companies invest in AI, automation, data governance, cybersecurity, workforce redesign, and productivity, some boards may test metrics tied to digital transformation, risk controls, reskilling, productivity gains, or responsible AI use. These measures will face the same test: they must be specific, measurable, rigorous, transparent, and material to the business.