Print
Print E-Mail
Stephen F. O’Byrne is President and Co-founder of Shareholder Value Advisors Inc.
The new U.S. Pay versus Performance (PvP) disclosures make it practical for investors to have reasonable specific quantitative guidelines for Say on Pay (SOP) voting. Specific quantitative guidelines make the investor’s vote matter: portfolio companies can predict the investor’s SOP vote and change their pay design in a way that increases the likelihood of a positive vote.
In this article, I’ll show how the PvP data can be used to measure five pay dimensions at the individual company level and how these pay dimensions can be used to create reasonable specific quantitative guidelines: companies are assured of a positive SOP vote if (a) relative TSR explains at least half of the variation in relative CEO pay, (b) CEO pay leverage is statistically significant at the conventional 5% level, (c) CEO relative pay risk is reasonable (i.e., ≤2) and (d) the CEO pay premium cost of above median pay leverage is reasonable (i.e., ≤2).
The new PvP data can be used to set reasonable specific guidelines because it provides mark-to-market pay that captures the incentive provided by changes in the value of unvested equity; the grant date pay that has been reported for 90+ years could never be used to set reasonable specific guidelines because it doesn’t capture the CEO’s full pay incentive.
An investor’s SOP vote is wasted if its guidelines don’t tell companies how to change
Many investors provide very general guidelines for their voting on SOP. BlackRock, for example, says in its 2026 proxy voting guidelines that compensation policies should “encourage an appropriate risk appetite, and align the interests of shareholders and executives”, but it doesn’t provide measures of risk appetite or pay alignment. It says that “we look for a clear link between variable pay and operational and financial performance” but it doesn’t make clear whether “clear link” refers to leverage or alignment, and it provides no measurement guidance.[1]
Vanguard, in its 2026 proxy voting guidelines, says that “plans should align company executives’ pay outcomes with the company’s performance relative to its industry peers over multiple years”[2] but doesn’t offer any methodology to measure alignment. General proxy voting guidelines make an investor’s SOP vote a waste; it doesn’t change company practice because companies can’t calculate how a change in pay design affects the investor’s SOP vote.
Reasonable specific guidelines are practical because investors can use the new PvP data to measure five pay dimensions
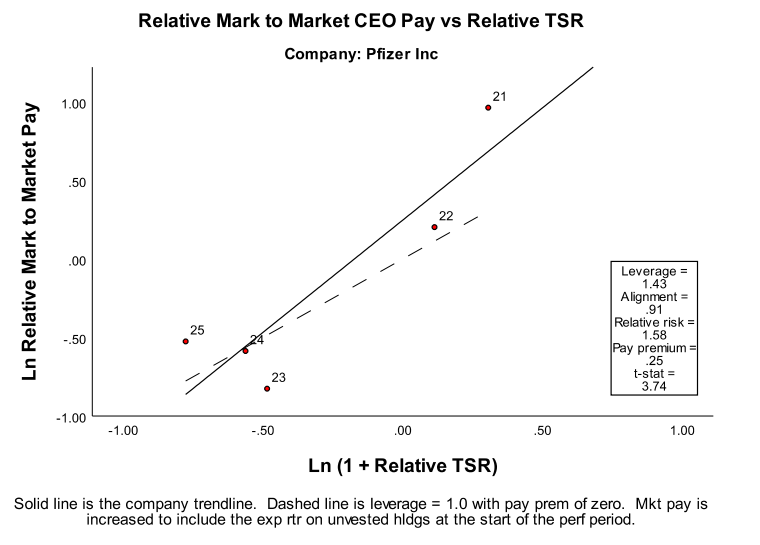
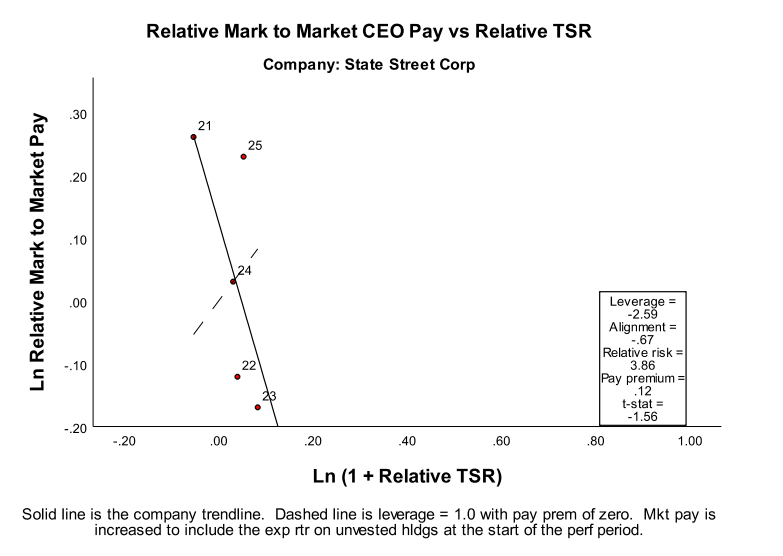
Figure 1 shows the five pay dimensions for Pfizer CEO Albert Bourla based on the five-year disclosure in Pfizer’s 2026 proxy, and Figure 2 shows the five pay dimensions for State Street CEO Ronald O’Hanley based on the five-year disclosure in State Street’s 2026 proxy.
Both graphs plot the natural log of relative pay on the vertical axis against the natural log of 1 + relative TSR on the horizontal axis. The slope of the trendline measures incentive strength, which we call pay leverage. It tells us the percent change in relative pay associated with a 1% change in relative shareholder wealth. The correlation is pay alignment. Pay alignment (r-sq) tells us the percent of the variation in ln relative pay that’s explained by ln (1 + relative TSR). When the correlation is negative, as it is for O’Hanley, we put a minus sign on pay alignment (r-sq) to indicate the relationship is in the wrong direction.
Relative pay risk (equal to slope/correlation) tells us ln relative pay variability as a percent of ln (1 + relative TSR) variability. The intercept is the pay premium at peer group average performance. It’s a measure of performance-adjusted cost. The pay leverage t-stat tells us the probability that the calculated pay leverage could be due to chance. A t-stat of 2.13 is needed, with five observations, to give us 95% confidence (the social science standard) that the pay leverage is not due to chance.
Pfizer qualifies for a positive SOP vote. Pay alignment (r-sq) is 83%, well above the 50% threshold for a positive SOP vote. The pay leverage t-stat is 3.74, well above the 2.13 needed for statistical significance with five observations. Relative pay risk is 1.58, well below the negative SOP vote threshold of 2.0.
To evaluate Pfizer’s compensation cost, we need to consider its pay leverage (1.43) and pay premium (0.25). Its pay premium is 0.01 below the median pay premium of 0.26, while its pay leverage is 0.95 above the median pay leverage of 0.48. This means it is paying zero log pay premium for each additional 1.0 of pay leverage, well below the 2.0 threshold for a negative SOP vote. State Street qualifies for a negative SOP vote because it has negative pay alignment, a negative t-stat, and excessive relative pay risk.
New investor guidelines will encourage proxy advisor reform
Institutional investors should use the new PvP data to adopt reasonable specific quantitative guidelines for SOP voting. This should lead to proxy advisor reform. The leading proxy advisor, Institutional Shareholder Services (ISS), has unreasonable specific quantitative proxy voting guidelines.[3] One of its three primary measures, Relative Degree of Alignment, is the difference between the company’s TSR percentile and the CEO’s grant date pay percentile. Despite its name, it doesn’t measure the correlation between pay and performance at the individual company level; it’s just a proxy for grant-date pay cost.
Another of its three primary measures, Multiple of Median, is the CEO’s grant date pay as a multiple of the company’s peer group median. This is a direct measure of cost, but it doesn’t adjust for performance or pay leverage. When institutional investors propose their own specific quantitative proxy-voting guidelines, these new guidelines should trigger debate on the ISS guidelines and, hopefully, lead to changes that correct their gross deficiencies.
1https://www.blackrock.com/gls-download/literature/sai/sai-sldb-us-5500.pdf(go back)
2https://fund-docs.vanguard.com/AU-Vanguard_Global_Proxy_Voting_Policy.pdf(go back)
3See Stephen F. O’Byrne, “The ISS Pay for Performance Model,” available at ssrn.com/abstract=2289360.(go back)