Print
Print E-Mail
This report examines CEO and executive compensation disclosed by US public companies during the 2026 proxy season. Drawing on extensive data for the Russell 3000 and S&P 500, it covers CEO pay, compensation elements, representation of women among CEOs, named executive officers (NEOs), say-on-pay voting, incentive design, perquisites, and the regulatory outlook. The broader picture is an executive compensation landscape that is becoming more equity driven and more differentiated by company scale, with scrutiny increasingly concentrated around exceptional awards, above-target incentive outcomes, and arrangements such as executive security.
Trusted Insights for What’s Ahead®
- Median reported CEO compensation rose again in 2026, reaching $7.1 million in the Russell 3000 and $17.5 million in the S&P 500. That represented increases of 7% and 6%, respectively, from the prior disclosure year. Company size remained one of the strongest dividing lines; median CEO pay reached $23.6 million among companies with at least $50 billion in annual revenue.
- Equity continues to carry much more of the increase than base salary. Since 2021, median performance-award value has risen 51% in the Russell 3000 and 46% in the S&P 500, while median time-based restricted stock award (RSA) and restricted stock unit (RSU) values increased 57% and 38%, respectively. Median salary increased about 16% in both indexes.
- Women continue to gain ground in the CEO population, but representation remains limited. Women now account for 8% of Russell 3000 CEOs and 9% of S&P 500 CEOs, compared with about 6% in both indexes in 2021. Women comprise about one-fifth of the broader non-CEO NEO population but remain less represented in several operating and financial roles that commonly feed CEO succession.
- Shareholder support strengthened despite higher pay. 76% of Russell 3000 say-on-pay proposals received at least 90% support, up from 72% a year earlier. Only 0.9% failed. Dissent remains concentrated among a relatively small group of companies rather than spread broadly across the market.
- Incentive structures continue to move gradually rather than radically. Performance awards and time-based RSAs/RSUs are increasingly common, while stock options continue to recede. Annual incentive outcomes also shifted upward, particularly in the S&P 500.
- Executive security has moved further into the mainstream at large companies. Personal and home security was reported for 34% of S&P 500 CEOs and 60% of CEOs in the Russell 3000 revenue cohort of $50 billion and above. Personal use of corporate aircraft was reported for 48% of S&P 500 CEOs, and at some companies is required or encouraged for security reasons.
CEO and executive compensation, covering the CEO and other NEOs, is disclosed annually by US public companies in proxy statements. The figures are drawn principally from companies’ Summary Compensation Tables and Compensation Discussion and Analysis sections. Salary and cash incentive amounts generally reflect compensation paid or earned for the year. Stock and option awards, however, are reported at grant-date fair value under accounting rules. For most US public companies, 2026 disclosures cover FY 2025 compensation.
Grant-date fair value is an accounting estimate, not the amount an executive ultimately receives. For large equity awards, the reported value can differ substantially from the eventual outcome because vesting, performance conditions, and subsequent share-price performance all matter. Headline reported compensation should therefore not be read as cash received or realized pay.
CEO Compensation Trends
Reported total CEO compensation
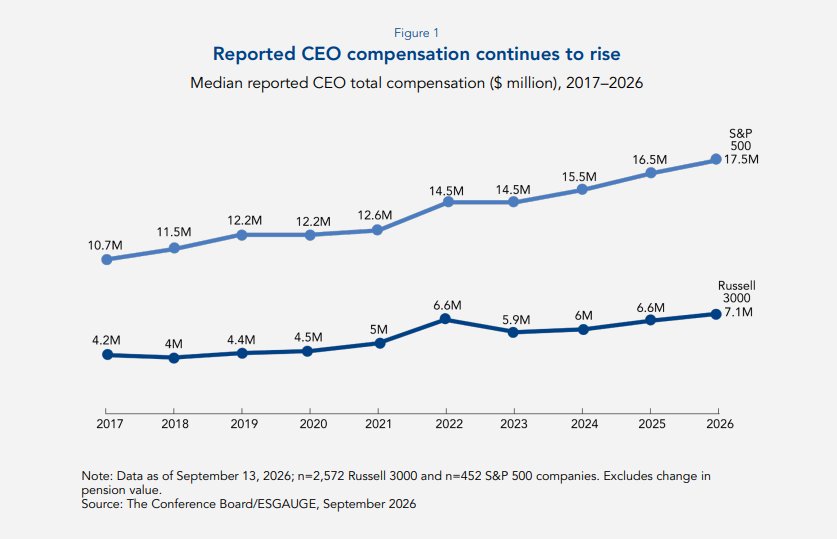
Median reported CEO compensation reached $7.1 million in the Russell 3000 and $17.5 million in the S&P 500 in 2026 filings, up 7% and 6% from a year earlier. Over the longer term, the increase was much larger. In 2017, the corresponding medians were $4.2 million and $10.7 million, respectively. By 2026 they were 68% and 63% higher. Russell 3000 compensation has been more volatile, including a sharp increase in 2022 followed by a pullback in 2023, but the longer-term direction remains upward.
The latest increase came in a supportive setting for incentive compensation. Real US GDP grew by 2.1% in 2025 and corporate profits from current production increased by $275.7 billion; consumer inflation ended the year at 2.7%.[1] These conditions do not determine executive pay, and grant-date equity values should not be confused with subsequent stock-price performance.
The S&P 500 premium remains substantial, with the median S&P CEO receiving about 2.5 times the reported compensation of the median Russell 3000 CEO.
CEO compensation by company size
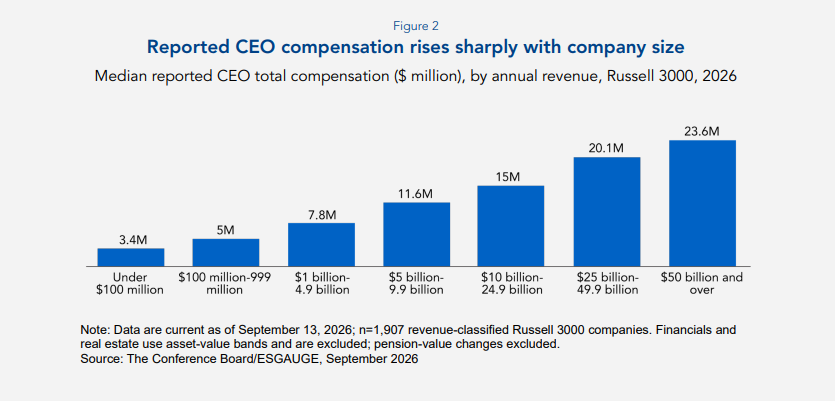
Company size produces one of the clearest divisions in CEO compensation. On the Russell 3000, median reported pay ranged from $3.4 million among companies with less than $100 million in annual revenue to $23.6 million among those with at least $50 billion, a difference of nearly sevenfold.
That gap is primarily about dollars, not simply percentage pay mix. Salary accounted for 24% of the package in the smallest revenue cohort, compared with 8% in the $50 billion-and-above cohort. Salary plus other cash compensation accounted for about 36% and 25%, respectively. Larger companies therefore pay much more in absolute terms while placing a greater share of the package into equity and longer-term incentives.
An index-wide median is therefore a poor substitute for a well-constructed peer group. Vanguard’s current US voting policy, for example, considers the appropriateness of compensation peers and target compensation relative to market benchmarks among the factors relevant to executive pay.[2]
CEO compensation by sector
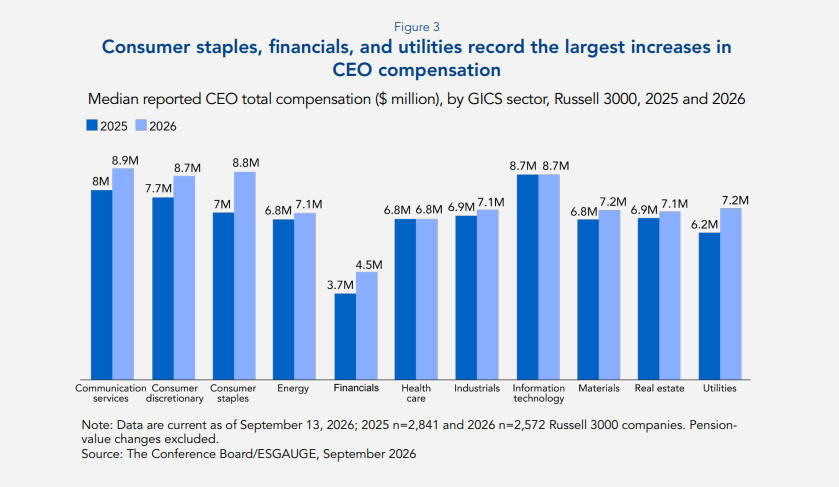
Communication services had the highest Russell 3000 median in the 2026 cohort, at $8.9 million. Consumer staples, information technology, and consumer discretionary followed closely, at roughly $8.7 million to $8.8 million. The largest year-over-year movements occurred in consumer staples, up 25%; financials, up 22%; and utilities, up 16%. Consumer discretionary rose by 13% and communication services 12%. Information technology and health care were essentially flat.
Those increases require some caution. The sector cohorts are not fixed panels. Consumer staples, for example, fell from 120 companies in the 2025 cohort to 91 in 2026, while financials declined from 548 to 512 and utilities from 73 to 66. Grant timing and individual awards can also move a sector median. The figures describe the current disclosure cohort, but they should not be read as estimates of across-the-board pay increases for CEOs within a sector. The wider spread by company size in Figure 2 also suggests that scale is a stronger differentiator of CEO pay than sector alone.
Highest reported CEO compensation
The largest reported compensation figures are extreme outliers relative to the market medians (Figure 4). Most reflect unusual long-duration awards or other accounting events.
Figure 4. Exceptional awards and accounting events dominate the top of reported CEO pay
Highest reported total CEO compensation, Russell 3000, 2026 (typically covering 2025 fiscal year)
| Company | Industry | CEO | Reported total compensation, 2026 |
|---|---|---|---|
| Tesla | Automobiles | Elon Musk | $158.4 billion |
| Welltower | Health care real estate investment trusts | Shankh Mitra | $821.1 million |
| Rivian Automotive | Automobiles | Robert J. Scaringe | $402.6 million |
| Wayfair | Specialty retail | Niraj Shah | $280.8 million |
| CrowdStrike Holdings | Software | George Kurtz | $247.6 million |
| Summit Therapeutics | Biotechnology | Mahkam Zanganeh | $246.0 million |
| Hut 8 | Software | Asher Genoot | $239.9 million |
| Broadcom | Semiconductors and semiconductor equipment | Hock E. Tan | $205.3 million |
| Warner Bros. Discovery | Entertainment | David M. Zaslav | $165.0 million |
| Blackstone | Capital markets | Stephen A. Schwarzman | $125.6 million |
Note. Data are current as of September 13, 2026. Reported values reflect applicable compensation accounting and are not cash received or realized compensation.
Source. The Conference Board/ESGAUGE, September 2026
The economics vary considerably. Tesla’s reported figure includes a maximum grant-date value and an award component later forfeited, while Welltower effectively front-loaded compensation intended to cover a decade.[3] More broadly, several of the largest packages are tied to multiyear retention, performance, or strategic-transition objectives rather than a conventional annual compensation cycle.
Tesla and Welltower show why headline figures can mislead when read as a single year of pay. One reflects the grant-date value of a highly contingent performance award; the other pulls forward compensation intended to cover a decade. Awards at this scale warrant closer scrutiny; boards need to explain the period covered, what must be achieved for value to vest, how the size was set, and why the regular program could not achieve the same objective.
CEO Compensation Elements and Pay Mix
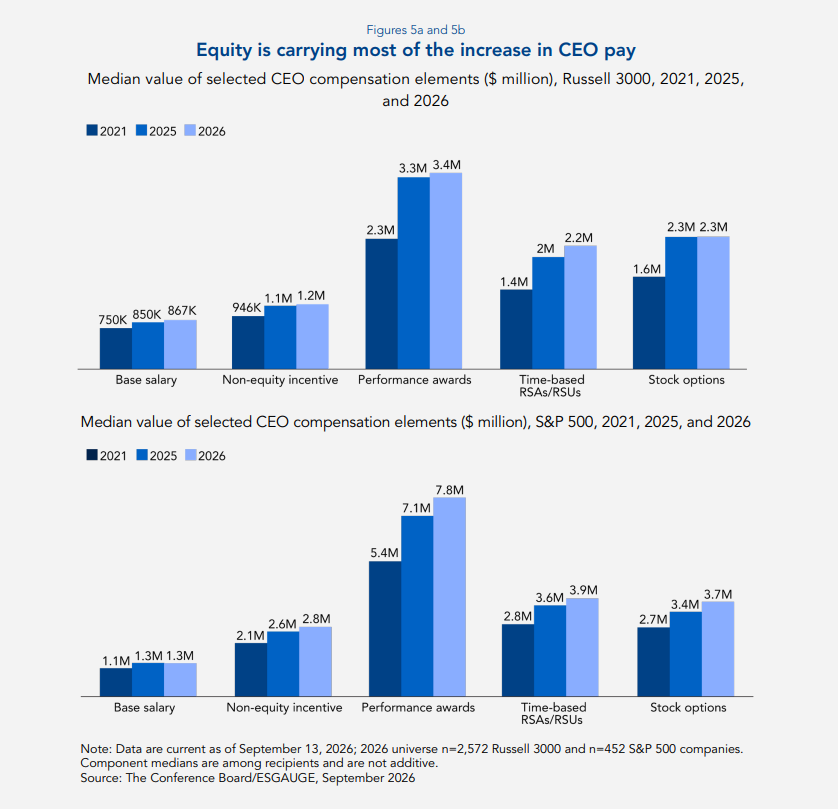
The rise in CEO compensation has come much more through equity and incentives than salary. Since 2021, median base salary has increased by about 16% in both indexes. Over the same period, median performance-award value increased by 51% in the Russell 3000 and 46% in the S&P 500. Time-based RSA/RSU value rose by 57% and 38%, while nonequity incentive compensation increased by 22% and 31%.
Salary remains comparatively constrained because an increase raises fixed compensation on an ongoing basis. Equity gives committees more room to increase potential value while retaining vesting and performance conditions.
That accounting distinction matters as equity makes up more of the package. Headline compensation is increasingly shaped by the grant-date value of equity rather than fixed cash pay, while realized value may ultimately be higher or lower. Grant timing and award design therefore matter when comparing one year with another.
Trends in Women CEOs
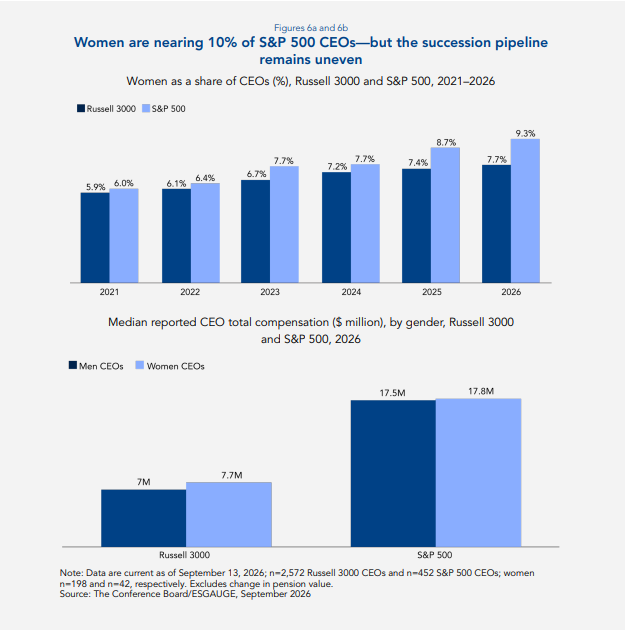
Women accounted for 7.7% of Russell 3000 CEOs and 9.3% of S&P 500 CEOs in 2026, up from 5.9% and 6% in 2021. Progress has been steady, particularly in the S&P 500, but women still hold fewer than one in 10 CEO positions.
Women accounted for 19.6% of Russell 3000 non-CEO NEOs and 20.3% of S&P 500 non-CEO NEOs, up from 16% and 16.1% in 2021. The distribution by role was uneven. Women accounted for 34.1% of Russell 3000 chief legal officers (CLOs) and 37.2% of S&P 500 CLOs, and 67% and 63.8% of chief human resources officers. By contrast, women represented 15.7% and 17% of chief financial officers (CFOs) and 16% and 14.4% of chief operating officers (COOs). That significantly shapes succession, as financial and operating roles remain common pathways to the CEO position.
Current CEO pay is similar for men and women in the S&P 500. Median reported compensation was approximately $17.8 million for women and $17.5 million for men. In the Russell 3000, the corresponding medians were approximately $7.7 million and $7.0 million. These are unadjusted comparisons and do not control for company size, sector, tenure, grant timing, or other factors.
NEO Compensation Trends
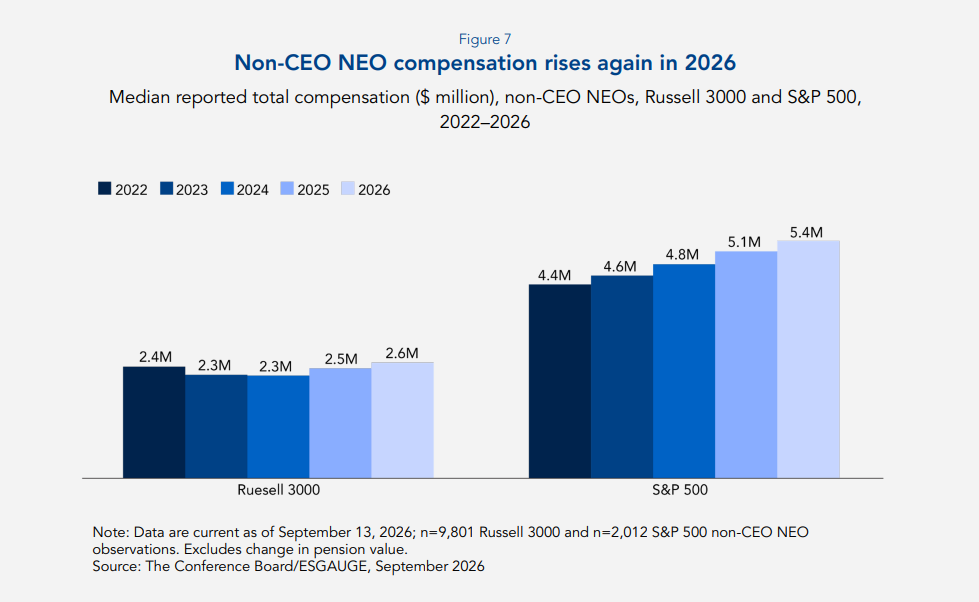
Median compensation for non-CEO NEOs rose by 5% to $2.6 million in the Russell 3000 and 5% to $5.4 million in the S&P 500. Since 2022, the S&P 500 median increased by 22%, compared with 9% in the Russell 3000.
As with CEO pay, equity has carried much of the longer-term increase. Since 2021, median NEO salary increased by 16% in the Russell 3000 and 13% in the S&P 500. Performance-award values increased by 51% and 43%, while RSA/RSU values rose 48% and 34%.
Among the major functional roles, COOs and CFOs had the highest 2026 medians. COO compensation was approximately $2.9 million in the Russell 3000 and $6.4 million in the S&P 500; CFO compensation was $2.6 million and $6.1 million. These comparisons vary considerably by company size and role definition, and some other functional-role samples were much smaller. Chief marketing officer data in particular should be treated cautiously in the S&P 500, where the 2026 sample contains only 27 executives. The same large-company pay premium seen for CEOs therefore extends across much of the senior executive team.
Say-on-Pay and Investor Scrutiny
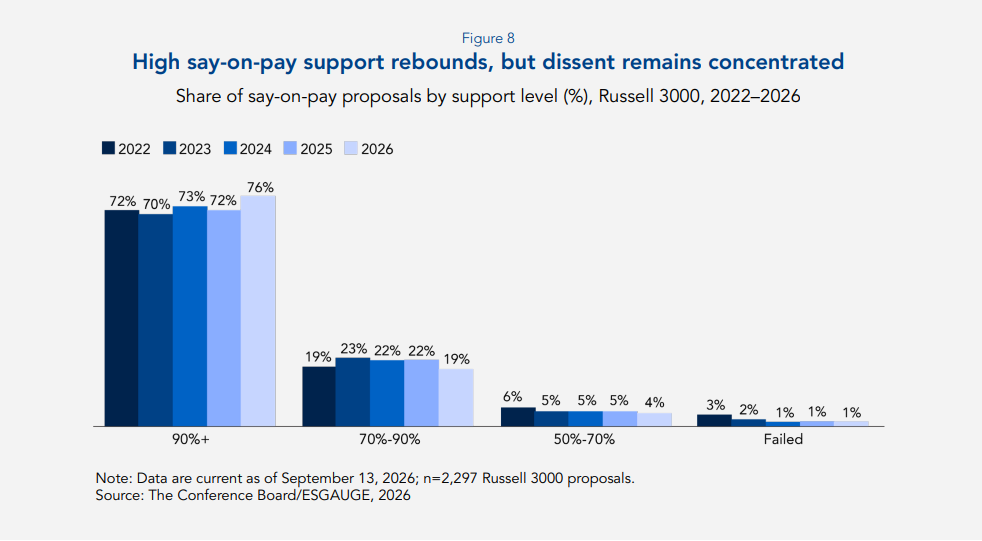
Shareholder support strengthened in 2026. 76% of Russell 3000 proposals received at least 90% support, up from 72% a year earlier. Only 20 proposals, 0.9% of the sample, failed to secure majority support. Another 4% received between 50% and 70%. The S&P 500 shows a similar pattern with 73% of proposals receiving at least 90% support and 1.1% failing.
Sector results vary considerably. 91% of utilities companies and 90% of energy companies received at least 90% support. Communication services and information technology were at the other end, with 57% and 66%, respectively. About 10% of communication services proposals and 10% of information technology proposals received less than 70% support.
Several of the weakest votes involved unusually large or distinctive awards. Warner Bros. Discovery received 15.6% support after reporting $165.0 million in CEO compensation that included a special option award. Aon received 38.4% after granting its CEO a special $50 million target-value performance stock unit (PSU) award tied to an employment extension through 2030. Thermo Fisher Scientific and Snowflake also faced substantial dissent following unusual CEO compensation decisions.[4] The circumstances differ, and no single award can be assigned responsibility for a vote result. In each case, however, the company had a compensation outcome outside ordinary annual practice to explain.
Taken together, the results suggest that pay level alone is not driving broad shareholder opposition. Performance context matters, but heavier scrutiny is concentrated around unusual awards that are harder to explain or appear out of step with shareholder returns. Investors are then more likely to ask why the award was needed, how demanding the conditions are, and whether the regular program was inadequate.
Trends in investor and proxy advisor scrutiny
The improvement in say-on-pay results coincides with a longer assessment horizon in some external pay-for-performance frameworks. ISS extended several elements of its US quantitative assessment from three years to five for the 2026 season. Glass Lewis also moved its North American framework toward a five-year assessment across a broader group of pay and performance measures.[5]
Institutional investors make their own voting decisions, and proxy-advisor models should not dictate compensation design. A longer assessment period does mean that an exceptional award can remain visible in external evaluations long after the year in which it was granted.
Figure 9. The questions compensation committees should expect from investors
| Issue | What the committee should be prepared to explain |
|---|---|
| Pay and performance | Why CEO pay is appropriate relative to financial performance, total shareholder return, and relevant peers over several years |
| Exceptional awards | Why the regular annual program is insufficient, and why the size, duration, and conditions of the award are appropriate |
| Incentive rigor | How targets were set, why above-target payouts were earned, and how adjustments or discretion were used |
| Shareholder dissent | What the board heard, what changed or did not change, and why |
Note. Informed by Vanguard, ISS, and Glass Lewis voting and compensation policies.
Source. The Conference Board, September 2026
Incentive Plan Design Trends
Long-term incentive award mix
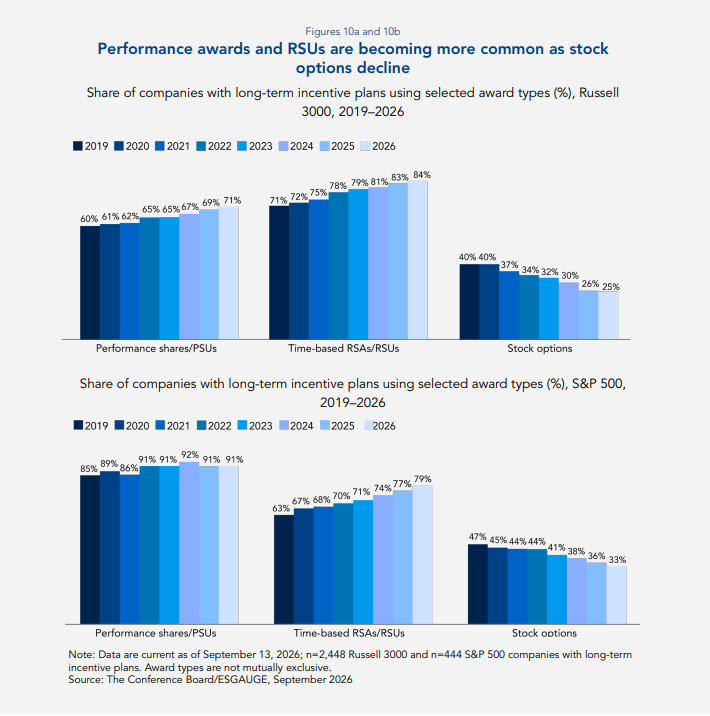
The direction of change was clearest in the Russell 3000. Performance shares/PSUs were used by 71% of companies in 2026, up from 60% in 2019. Time-based RSAs/RSUs increased from 71% to 84%, while stock options moved in the opposite direction, falling from 40% to 25%.
The S&P 500 started from a higher base for performance awards. PSU prevalence increased from 85% in 2019 to 91% in 2026. Time-based RSA/RSU use rose more substantially, from 63% to 79%, while stock options declined from 47% to 33%.
Companies are also increasingly combining performance-based awards with time-based stock. Among companies with long-term incentive plans, 54% of Russell 3000 companies and 51% of S&P 500 companies used performance-based awards alongside restricted stock or RSUs in 2026, up from 35% and 34%, respectively, in 2019. The combination allows boards to preserve a strong performance component while adding more predictable retention and ownership value.
Three years remains the standard performance measurement period, used by 85% of relevant Russell 3000 plans and 95% of S&P 500 plans.
Annual incentive plan design and payouts
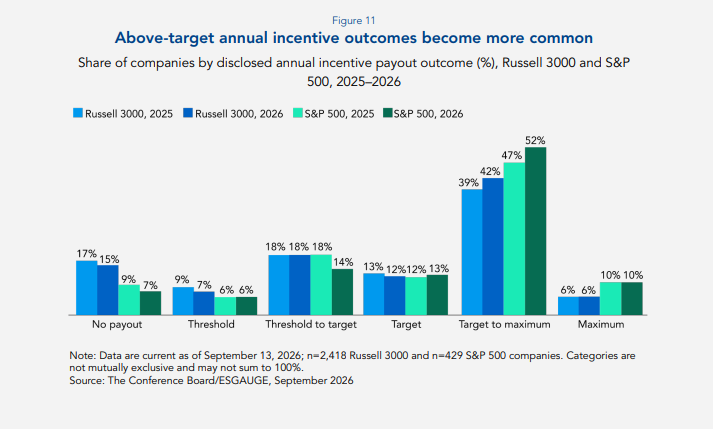
Annual incentive design changed little in 2026. Formulaic plans were used by 88% of Russell 3000 companies and 93% of S&P 500 companies. Among plans using financial metrics, profit remained the dominant measure, appearing in 88% and 91%, respectively. A 200% maximum payout remained the most common structure, used by 60% of Russell 3000 plans and 73% of S&P 500 plans in the available data.
Payout outcomes moved more noticeably. Target-to-maximum outcomes increased from 39% to 42% in the Russell 3000 and from 47% to 52% in the S&P 500. Maximum outcomes were broadly unchanged, at 6% in the Russell 3000 and 10% in the S&P 500. No-payout outcomes declined from 17% to 15% and from 9% to 7%, respectively.
Higher corporate profit in 2025 was consistent with stronger annual-incentive outcomes, particularly because profit measures dominate plan design. Widespread above-target payouts also increase the importance of the original goal-setting process. A formula can operate as designed and still produce an unconvincing result if the target was not sufficiently demanding when it was established.
CEO Perquisites and Other Benefits
Perquisite and benefit provision
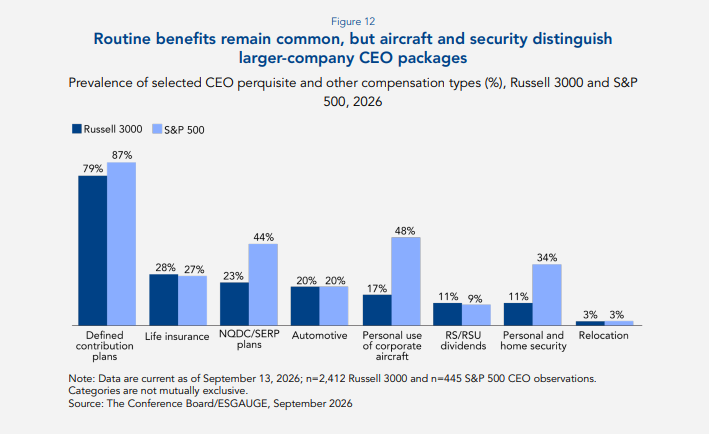
Most perquisites and other benefits remain small relative to salary and equity. Median reported perquisites and other compensation were approximately $59,000 for Russell 3000 CEOs and $301,000 for S&P 500 CEOs.
The sharper differences were concentrated in a few areas. Nonqualified deferred compensation (NQDC) and supplemental executive retirement plan (SERP) arrangements were reported for 23% of Russell 3000 CEOs and 44% of S&P 500 CEOs; personal use of corporate aircraft for 17% and 48%; and personal and home security for 11% and 34%. The security gap was still more pronounced with company size, as Figures 13 and 14 show.
Personal and home security
Executive security is drawing greater attention as risks to senior corporate leaders become more visible. The December 2024 killing of UnitedHealthcare CEO Brian Thompson in New York sharpened that concern. For boards, protection is increasingly a business-risk and duty-of-care issue, not simply an executive benefit.
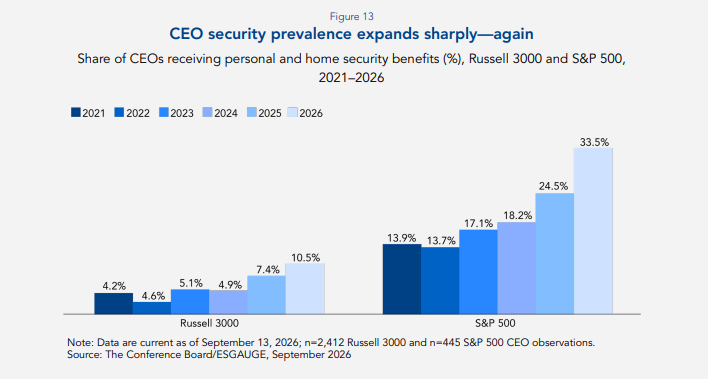
In that context, CEO security disclosures rose sharply (Figure 13). Personal and home security was reported for 4% of Russell 3000 CEOs and 14% of S&P 500 CEOs in 2021, rising to 11% and 34% in 2026. In the S&P 500 alone, prevalence climbed from 18% in 2024 to 25% in 2025 and 34% in 2026.
Median disclosed cost among current recipients was approximately $68,600 in the Russell 3000 and $101,900 in the S&P 500. Costs were much higher at the upper end; the 20 largest executive security observations in the Russell 3000 averaged approximately $4.3 million, with 17 concentrated in information technology, communication services, or financials. This includes $12.6 million for Stephen Schwarzman at Blackstone and $8.8 million for Sundar Pichai at Alphabet.
These cases are exceptional rather than representative of the wider market, but they show why security increasingly deserves its own governance lens. Once costs reach this scale, boards need to be clear about what is being provided for business and security reasons, what constitutes personal benefit, how the value is disclosed, and whether the arrangement is reviewed periodically. The broader market story remains the rapid spread of security itself, not the handful of multimillion-dollar disclosures.
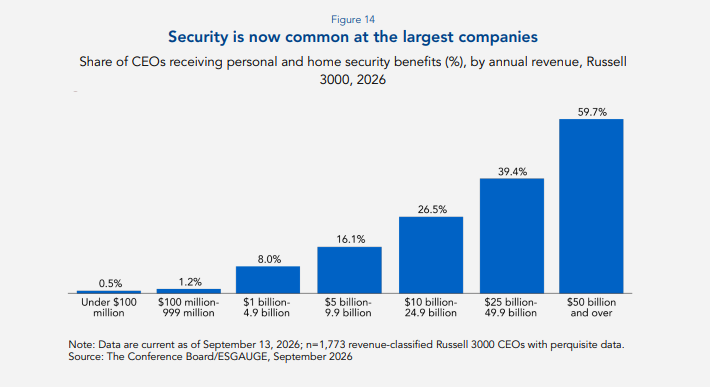
Company size makes the pattern especially clear. Personal and home security was reported for only 0.5% of CEOs in the smallest revenue cohort and 1.2% among companies with $100 million to $999 million in annual revenue. Prevalence rises to 8% at $1 billion to $4.9 billion, 16% at $5 billion to $9.9 billion, 27% at $10 billion to $24.9 billion, 39% at $25 billion to $49.9 billion, and 60% among companies with at least $50 billion in annual revenue. Among security recipients in that largest group, median disclosed spending was approximately $247,100.
Private aircraft is part of the same discussion at many large companies. Personal use of corporate aircraft was reported for 48% of S&P 500 CEOs in 2026, up from 43% in 2025, and 17% of Russell 3000 CEOs, up from 15%. Notably, some boards require or encourage company aircraft following security assessments. Personal use remains reportable compensation, but the rationale may be protection rather than convenience; boards still need clear distinctions among business, security, and personal use.
Regulatory Outlook
Looking ahead, executive compensation disclosure could change significantly as the Securities and Exchange Commission (SEC) advances its current disclosure reform agenda. The SEC is reviewing Regulation S-K, including Item 402, while a separate May 2026 proposal would extend scaled disclosure accommodations to a wider group of non-accelerated filers.[6]
Regulatory requirements and investor expectations may move at different speeds. Companies may be able to reduce repetitive disclosure if rules change while still preserving the information investors need to understand a material award, payout, or change in plan design. For unusual compensation decisions, that explanatory value may remain important even if the regulatory minimum changes.
Figure 15. Regulatory outlook
Key US regulatory developments and investor expectations relating to executive compensation disclosure
| Development | Potential impact | What companies should do |
|---|---|---|
| SEC review of Item 402 | Executive compensation disclosure could be simplified or restructured | Identify repetitive disclosure, but preserve information that explains key pay decisions |
| Proposed filer-status reform | More issuers could qualify for scaled compensation disclosure and related accommodations | Assess whether future relief would actually justify reducing disclosure |
| Investor expectations | Investors may continue to expect pay-for-performance, target, and special-award disclosure regardless of SEC requirements | Keep decision-useful information even if the regulatory minimum falls |
Source. The Conference Board, September 2026
Conclusion
Executive pay rose again in 2026, while shareholder support also strengthened. The broad market has not moved toward radically different incentive structures. Instead, the change is occurring within familiar frameworks. More compensation is flowing through equity, RSAs/RSUs have become more common, stock options are receding, and above-target annual incentive outcomes are increasing.
The outliers remain important. Exceptional awards attract disproportionate scrutiny because ordinary benchmarking provides less context for them. Security arrangements are also becoming much more common with the largest companies, making them less easily dismissed as a conventional executive perk.
For compensation committees, the central challenge lies in the decisions behind the numbers, including credible targets, proportionate awards, disciplined use of discretion, and a rationale that remains persuasive when viewed over several years of pay and performance.
This article is based on corporate disclosure data from The Conference Board Benchmarking platform, powered by ESGAUGE.
1 GDP (Third Estimate), Industries, Corporate Profits, State GDP, and State Personal Income, 4th Quarter and Year 2025, US Bureau of Economic Analysis, April 2026; Consumer Price Index—December 2025, US Bureau of Labor Statistics, January 2026. These indicators provide context for the latest compensation cycle, particularly annual incentive outcomes, but they do not by themselves explain changes in executive pay.(go back)
2 Vanguard’s policy illustrates why peer selection remains a governance issue rather than a purely technical benchmarking exercise. Its compensation assessment can consider the appropriateness of the peer group, target compensation relative to peers, performance periods, goal rigor, and one-time awards. See Proxy Voting Policy for U.S. Portfolio Companies, Vanguard Portfolio Management Investment Stewardship, January 2026.(go back)
3 Tesla’s $158.4 billion reported CEO compensation includes $132.3 billion representing the maximum grant-date fair value of its 2025 CEO Performance Award and $26.1 billion for an interim award that was later forfeited. Welltower’s $821.1 million reported figure reflects a 10-year executive program intended to replace virtually all annual cash and equity incentives for participating executives through 2035, apart from a $110,000 annual salary. The two examples show why the highest reported compensation figures cannot be read as ordinary annual pay.(go back)
4 These companies illustrate different forms of compensation controversy: special option awards, retention grants, unusually large new-CEO equity packages, and multiyear PSU awards.(go back)
5 Both ISS and Glass Lewis moved further toward multiyear assessment for the 2026 season. ISS extended several quantitative pay-for-performance measures to five years, while Glass Lewis broadened its North American framework across multiple tests of pay, total shareholder return, and financial performance. For committees, the implication is practical: an exceptional award can remain visible in external assessments long after the year in which it was granted. For more, see US: FAQ—Executive Compensation Policies, Institutional Shareholder Services, December 2025; 2026 Benchmark Policy Guidelines—US, Glass Lewis, December 2025.(go back)
6 See Statement on Reforming Regulation S-K, US Securities and Exchange Commission, January 13, 2026; and Enhancement of Emerging Growth Company Accommodations and Simplification of Filer Status for Reporting Companies, Release Nos. 33-11419 and 34-105515, May 19, 2026. (go back)