 Print
PrintStephen F. O’Byrne is the President of Shareholder Value Advisors. This post is based on an article by Mr. O’Byrne, forthcoming in the Journal of Applied Corporate Finance.
There is little need for shareholder oversight of executive pay if directors do a good job providing oversight themselves or have strong incentives to do a good job. In this article, we’ll show that there is substantial evidence that directors do a poor job overseeing executive pay and that directors have weak incentives to pursue shareholder interests in executive pay. We’ll then look at Say on Pay and present evidence that Say on Pay voting is sensitive to differences in pay for performance, but so forgiving that extraordinary pay premiums are required to elicit a majority “no” vote. We will show that three quarters of institutional investors have lower SOP voting quality—that is, less informed and fair voting ‐ than the average investor and almost all have a short‐term focus, with much greater vote sensitivity to current year grant date pay premiums than to long‐term pay alignment and cost. We’ll conclude with a proposal explaining how institutional investors can improve their SOP voting.
Objective Measures Show That Directors Do a Poor Job Overseeing Executive Pay
Executive compensation has three basic objectives: providing strong incentives to increase shareholder value, retaining key talent and limiting shareholder cost. These objectives have not changed since the advent of large corporations in the late 19th century and can be found in almost any public company’s Compensation Discussion & Analysis (CD&A). We can measure companies’ success in achieving these three objectives by comparing relative pay with relative performance. Relative pay is pay divided by market pay for position, industry and company size. Relative performance is relative shareholder return. [1] A regression of ln relative pay on ln relative performance quantifies incentive strength, retention risk and shareholder cost.
Figure 1 shows this analysis for Southwest Airlines. The slope of the trendline is a measure of incentive strength, i.e., the percent change in pay associated with a 1% increase in relative shareholder wealth, what we call “pay leverage”. Southwest’s pay leverage of 1.98 means that a 1% increase in relative shareholder wealth increases relative pay by 1.98%. The intercept of the trendline is the company’s pay premium at industry average performance. This provides a negative measure of retention risk and a positive measure of shareholder cost. The more above average a company pays for average performance, the lower is its retention risk and the higher is its shareholder cost. Southwest’s intercept of 0.19 is its ln pay premium and corresponds to a percentage pay premium of 21%. [2] Southwest’s positive pay premium at industry average performance means that it has below average retention risk and above average shareholder cost.
Figure 1
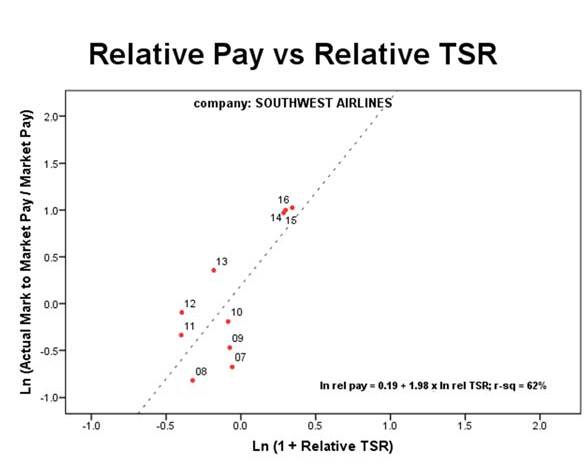
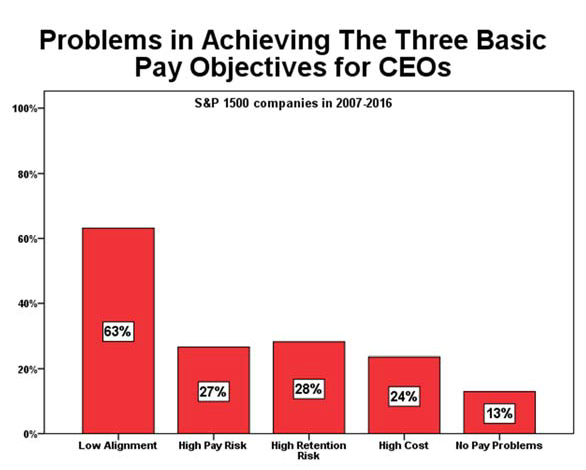
Pay leverage, as a regression coefficient, is the product of correlation or “pay alignment” and relative pay risk. With these two components, we can use the pay leverage regression to define four pay problems. The first is low alignment, which we define as alignment (r‐sq) less than 50%. A second is high pay risk, we define as relative pay volatility that’s more than 150% of relative performance volatility. A third is high retention risk, which we define as a pay “premium” at industry average performance of ‐33% (or more negative), and a fourth is high cost, which we define as a pay premium at industry average performance of 50%+. Southwest does not have low alignment, high retention risk or high cost, as we can see directly from Figure 1, but it does have high pay risk since its relative pay volatility is 251% of its relative performance volatility. [3]
Figure 2 shows the prevalence of these four problems for S&P 1500 CEOs over the ten years 2007‐2016. 63% of companies have low alignment and only 13% of companies have none of the four problems. This chart provides strong evidence that corporate directors are not doing a good job on CEO pay oversight.
Figure 2
A cross company analysis of relative pay vs relative performance provides more visually compelling evidence that directors are doing a poor job aligning relative pay and relative performance. A regression of ln relative pay on ln relative TSR using ten years of data for all S&P 1500 CEOs shows pay alignment (r‐sq) of only 10%. Figure 3 shows that scatterplot using a 10% random sample of the 13,289 data points. [4]
Figure 3
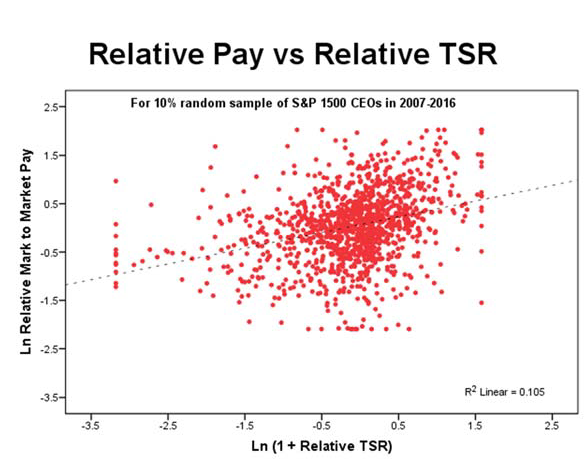
It’s possible that cross company pay alignment (r‐sq) appears to be very low because some companies, like Southwest Airlines, have very high pay leverage, while other companies have much lower pay leverage, and those differences in slope reduce cross company pay alignment even though they don’t reduce individual company pay alignment. We can assess the impact of individual company differences in pay leverage by changing the independent variable from ln(1 + relative TSR) to individual company pay leverage x ln(1 + relative TSR). This only raises pay alignment (r‐sq) from 9.6% to 10.9%, so differences in individual company pay leverage do little to explain low pay alignment across companies.
A further analysis of the cross company regression highlights the impact of differences in director oversight. When we restrict the sample to companies with pay alignment (r‐sq) of 50%+, cross company pay alignment (r‐sq) increases from 11% to 25%. When we then further restrict the sample to companies with interquartile pay premiums at industry average performance, cross company pay alignment (r‐sq) increases from 25% to 76%. This shows that cross company pay alignment would be seven times higher if directors did a good job at their own company of ensuring alignment and limiting pay premiums.
Directors Support Three Pay Practices That Undermine Pay for Performance
A great benefit of the relative pay vs relative performance regression is that it leads us to look for a “perfect” pay plan, i.e., a pay plan that provides a slope of 1.0, a correlation of 1.0 and an intercept of 0.0. It turns out that there is a simple pay plan with annual grants of performance shares that provides pay leverage of 1.0, pay alignment of 1.0 and a pay premium of industry average performance of 0.0. The four key features of this “perfect” performance share plan are:
- Target pay is market pay adjusted for trailing relative performance, i.e., target pay = market x (1+ relative TSR from plan start to date of grant).
- Shares granted = target pay / stock price.
- Vesting multiple = 1 / (1 + industry return from date of grant).
- Cash paid out prior to retirement is a draw against the ultimate value of the performance shares.
It’s possible to show that realizable pay under the “perfect” performance share plan is equal to cumulative market pay plus a symmetric share of the cumulative dollar excess return. It’s possible to show that two other perfect pay plans have this same underlying structure: the Dynamic CEO Compensation Plan developed by finance professors Alex Edmans of London Business School and Xavier Gabaix of Harvard and the optimal investment manager fee contract developed by Don Raymond, the chief investment strategist of Canada Pension Plan. [5]
This “perfect” performance share plan has three significant differences from conventional pay practices. First, target pay is market pay adjusted for trailing relative performance, not market pay regardless of past performance. Second, the role of vesting is to take out the industry component of the stock return, not to leverage the stock based on some measure of operating performance or stock price. Third, the time horizon of performance measurement is the executive’s career, not a three or five year period.
The policy of making target pay equal to market pay regardless of past performance has nearly universal acceptance even though it undermines the alignment of pay and performance. For example, the proxy advisor Glass Lewis says it may recommend a Say on Pay “no” vote for “targeting overall levels of compensation at higher than median without adequate justification”. [6] Targeting pay at the median regardless of past performance is perfectly acceptable for Glass Lewis. Figure 4 shows two scenarios where competitive pay policy leads to a 153% difference in cumulative pay for the same cumulative performance. In each scenario, there is market pay of $1,000 each year, paid in shares of restricted stock. The number of shares is calculated by dividing target pay by the stock price at the beginning of the year. In the “Good Early Performance” scenario, the executive is granted a total of 290 shares with an ending value of $5,800. In the “Bad Early Performance” scenario, the executive is granted a total of 735 shares with an ending value of $14,690. The Bad Early Performance executive gets paid 153% more even though the cumulative stock return is the same in both scenarios.
Figure 4
Competitive Pay Policy Leads to Huge Pay Differences for the Same Cumulative Performance
| Year
0 |
Year
1 |
Year
2 |
Year
3 |
Year
4 |
Year
5 |
|
|---|---|---|---|---|---|---|
|
Market pay |
1,000 |
1,000 |
1,000 |
1,000 |
1,000 |
|
|
GOOD EARLY PERFORMANCE |
||||||
| Stock price | 10 | 15 | 20 | 25 | 30 | 20 |
| Shares (= market pay / BOY stock price) | 100 | 67 | 50 | 40 | 33 | |
| Cumulative shares | 100 | 167 | 217 | 257 | 290 | |
| Ending wealth | 5,800 | |||||
|
BAD EARLY PERFORMANCE |
||||||
| Stock price | 10 | 7 | 6 | 5 | 8 | 20 |
| Shares (= market pay / BOY stock price) | 100 | 143 | 167 | 200 | 125 | |
| Cumulative shares | 100 | 243 | 410 | 610 | 735 | |
| Ending wealth | 14,690 | |||||
The performance variability reflected in these two scenarios is quite normal for public companies. The volatility of the annual returns is 0.41. This is 60th percentile five year volatility for S&P 1500 companies over the past 30 years.
In the Bad Early Performance scenario, the executive receives 235 shares that are attributable to poor performance, i.e., the decline in the stock price below the $10 price at the beginning of year 1, and these 235 shares increase the executive’s cumulative pay by 47% from $9,990 to $14,690. In a 2013 study, Mark Gressle and I analyzed Standard & Poor’s Execucomp database to identify S&P 1500 top executives who received additional shares (and lower exercise prices) as a result of stock price declines. To quantify the magnitude of the executive’s potential gain from poor performance, we looked at the additional shares received over a five year period and calculated the value of those additional shares (plus any additional option gain from lower exercise prices) assuming the company was able to get its stock price back to its five year high. The “top” 15 executives in this study all had potential gains from poor performance of $69+ million with a median of $105 million. [7]
The concept that executives (and directors) are entitled to competitive pay regardless of past performance developed gradually and over the objections of the consultants who lead the development of executive pay surveys. Arch Patton of McKinsey, who led the development of the first executive pay surveys at the American Management Association in the late 1940s, and Bud Crystal of Towers Perrin, who led the development of Towers Perrin’s Compensation Data Bank, both argued that pay percentile should track performance percentile, just as the perfect pay plans require. [8]
The second bad policy supported by directors is paying for industry performance instead of management’s contribution to shareholder value. Performance vesting is widely used for equity compensation and the broad goal of performance vesting is to reduce pay for performance that’s not due to superior management performance. But, in practice, performance vesting is not very successful in eliminating pay for industry performance. For S&P 1500 CEOs in the ten years 2007‐2016, median pay leverage to relative TSR is 0.48, i.e., a 1% increase in relative shareholder wealth increases relative pay by 0.48%, but median pay leverage to industry TSR is 0.53. This shows that the median S&P 1500 company rewards industry performance as generously as the CEO’s contribution to shareholder value.
Aetna CEO Mark Bertolini is a recent extreme case of high reward for industry performance. Assuming the CVS acquisition of Aetna goes through, his ten year realizable pay will reach $636 million, but that’s $439 million more than fair pay for his company size, industry, relative TSR and pay leverage. [9] The pay for performance analysis outlined above implies that fair pay is market pay x (1 + relative TSR) ^ pay leverage. For Bertolini:
Excess pay = realizable pay—market pay x (1 + relative TSR) ^ pay leverage
$439 million = $636 million ‐ $115 million x (1 + 31%) ^ 2
Bertolini has received enormous pay for industry performance because his equity compensation was largely fixed price stock options. He received 2.3 million fixed price options over a ten year period in which Aetna’s GICS sub‐industry, Managed Health Care, had a return of 352%. While Aetna outperformed its GICS industry and sub‐industries, it’s relative TSR, adjusted for “industry beta”, is only 31%.
500,000 of Bertolini’s 2.3 million options were earned from a grant that was subject to a relative TSR performance condition. The performance condition resulted in forfeiture of 200,000 option shares, but the fixed exercise price on the 500,000 shares that did vest gave Bertolini 100% of the industry return on those shares. This is a common flaw in the design of performance conditions: they operate as gates rather than filters. If the performance condition is met, the executive is entitled to participate in the industry component of the return.
The third bad policy supported by directors is paying out cash that exceeds cumulative fair pay. This results from failure to use cumulative performance tests for long‐term incentive vesting and failure to treat non‐performance cash and short‐term incentives as draws against the value of the company’s long‐term incentives.
Directors Engage in Deliberate Obfuscation in Communicating with Shareholders
Our analysis shows that a scatterplot of relative pay vs relative performance provides a compact and highly informative assessment of a pay program’s success in achieving the three basic objectives of executive compensation. It also shows that almost 2/3 of S&P 1500 companies do a poor job of aligning relative pay with relative performance and a quarter do a poor job of controlling cost.
Since the graph would quickly show investors whether director oversight of pay is effective, it’s not surprising that I’ve been unable to find a single U.S. public company that includes the graph in its proxy. I’m aware of only one company, Bunge, that provides a multi‐year chart of relative pay and relative performance. Bunge provides a bar chart showing relative pay percentile and relative TSR percentile for three year periods ending in each of the last ten years. Bunge does not report slope, correlation or intercept, but an investor can use the data reported in the bar chart to calculate the trendline (pay percentile = 0.85 + 0.83 x TSR percentile), the pay percentile at 50th percentile TSR (41) and alignment (r‐ sq) of 69%. This disclosure is highly informative even though leverage and pay premium are less useful when expressed in percentiles.
Lack of enthusiasm for graphs is not the reason companies don’t show a scatterplot of relative pay vs relative performance. Exxon’s 2017 proxy statement includes 16 graphs on pay and performance, but only one includes pay and performance in the same graph and that only shows percentage changes in earnings and annual bonus. In 2013, a Working Group established by three management focused industry groups, the Conference Board, the Center on Executive Compensation and the Society of Corporate Secretaries and Governance Professionals, noted that “realizable pay provides a relative comparison to judge alignment of pay with stock price for the company and relative to its peers” but recommended the graphic disclosure shown in Figure 5
Figure 5
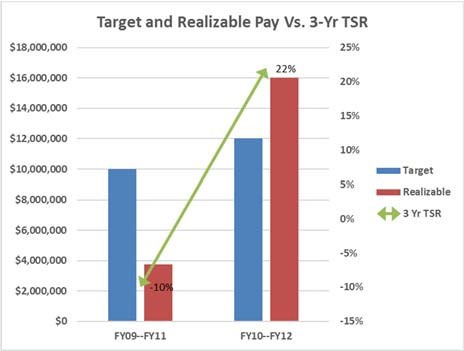
We can use the two points shown in this graph to calculate a trendline, realizable pay = $7.6 million + $0.381 million x TSR. The slope of the line ($0.381 million) is a measure of incentive strength, but not one that provides a meaningful cross company comparison. An additional $0.381 million provides a big incentive at a small company, but a weak incentive at a big company. The use of TSR, not relative TSR, implies that pay should have the same sensitivity to industry TSR and relative TSR, but pay sensitivity to industry TSR provides no incentive because industry TSR is beyond management’s control. The intercept ($7.6 million) is a measure of cost, but not one that provides a meaningful cross company comparison. $7.6 million for zero TSR may be a lot of money for a small company, but a modest amount for a big company. The graph assumes perfect alignment by using only two data points.
These three pieces of evidence—the complete absence of relative pay vs relative TSR scatterplots, the graphs provided by Exxon and the graph recommended by Conference Board Working Group—provide strong evidence that independent directors and their advisors engage in deliberate obfuscation in communicating with the shareholders that they purport to represent. We’ll see next that a plausible explanation for this obfuscation is that directors have weak incentives to pursue shareholder interests in executive and director pay.
Directors Have Weak Incentives to Pursue Shareholder Interests in Executive Pay
Directors’ continuing reliance on pay policies that undermine pay for performance and their support for deliberate obfuscation in the CD&A suggest that directors have weak incentives to pursue shareholder interests in executive pay. Examination of their stock holdings and their pay leverage provides more direct evidence that they have weak incentives to pursue shareholder interests in executive pay.
Let’s look first at stock ownership and assess the relative importance, in director income, of stock return vs compensation for director service. In a 2017 study of the demise of partnership sharing in executive pay at General Motors, David Young and I compared the income mix of the 1977 GM board that abandoned partnership sharing in favor of competitive pay concepts with the income mix of the GM board thirty years earlier in the “heyday” of partnership sharing. [10] The median board member in 1977 owned $34,000 in stock and received an annual director’s fee of $47,000, while the median board member in 1947 owned $1.65 million in stock and received an annual director’s fee of $900. If we assume an expected stock return of 10%, the median board member in 1977 had an expected annual income from stock ownership of $3,400 and an expected annual income from director service of $47,000, while the median board member in 1947 had an expected annual income from stock ownership of $165,000 and an expected annual income from director service of $900. Put another way, the annual director fee in 1977 would cover the loss of the expected stock return for almost 14 years, while the annual director fee in 1947 would cover the loss of the expected stock return for two days. Given this income mix, the 1977 director had strong incentives to join forces with management in providing higher pay for labor providers—directors and management—at the expense of the capital providers while the 1947 director had strong incentives to resist management pay plans that weren’t beneficial for shareholders.
I did a similar analysis of income mix for S&P 1500 directors in 2017 using the assumption that the expected stock return was 8%. For the median director, income from capital, i.e., the expected return on the stock, was only 23% of the director’s total expected income from capital and labor. Only 3% of S&P 1500 directors had an expected stock return that was 10 or more times greater than their annual director fee. These figures show that most directors will have a substantial gain when directors and managers are overpaid at the expense of capital providers.
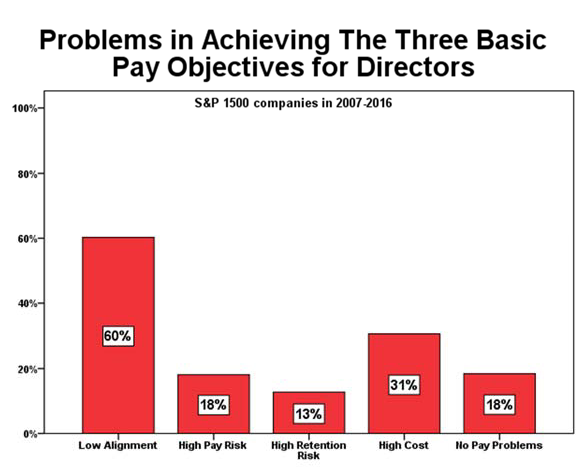
While director stock ownership is not sufficient to motivate close oversight of management pay, it’s possible that director pay is closely aligned with shareholder value and provides a strong incentive by itself. But, in fact, director pay plans suffer from the same design flaws as management pay plans and show similar prevalence of low alignment and high cost. Director pay plans, like management pay plans, are based on competitive pay policy, that is, providing competitive target pay regardless of past performance. In addition, director equity grants are rarely subject to performance vesting, so director equity compensation is even more likely than management equity compensation to pay for industry performance. Figure 6 shows the prevalence of director pay problems at S&P 1500 companies. 60% of S&P 1500 companies suffer from low director pay alignment vs 63% with low CEO pay alignment. 31% suffer from high cost vs 24% with high CEO cost.
Figure 6
Say on Pay Is Sensitive To Pay For Performance But Very Forgiving
Thus far, we have shown that Say on Pay is needed because directors do a poor job of providing oversight of executive pay and have little incentive to do a good job. Our next objective is to assess how well Say on Pay works.
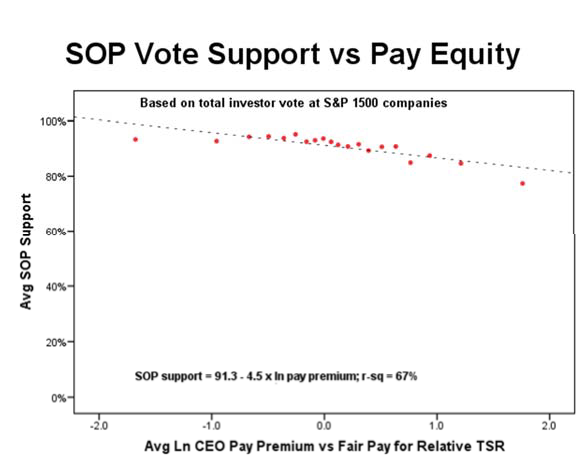
Say on Pay voting in the United States was mandated by the Dodd‐Frank act. Data from Institutional Shareholder Services shows that average SOP approval at Russell 3000 companies has risen from 90.7% in 2012 to 92.1% in 2017. [11] The high average approval rates suggest that approval is automatic and insensitive to individual company pay practices, but that’s not the case. Figure 7 shows 2016 SOP voting support for S&P 1500 companies on the vertical axis plotted against a measure of 2015 CEO pay equity on the horizontal axis. The measure of CEO pay equity is the ln difference from fair pay for relative TSR assuming pay leverage of 0.9, i.e., ln relative pay—ln (1 + relative TSR)^0.9 [12]. The S&P 1500 companies are divided into 20 equal groups (“ventiles”) based on the value of the CEO ln pay premium and the scatterplot shows average SOP vote support and average ln pay premium for each ventile. Figure 7 shows that average ln pay premium explains 67% of the variation in SOP vote support across the 20 ventiles and the equation of the trendline is SOP vote support = 91.3—4.5 x ln pay premium. The high r‐ squared shows that pay for performance is well correlated with SOP voting. It’s possible that the high correlation is just due to high pay or poor performance, but additional analysis shows that it’s really pay vs performance that matters [13], not just high pay or poor performance.
Figure 7
While pay for performance does matter for SOP voting, analysis of SOP voting highlights three basic weaknesses. First, SOP voting is focused on the short‐term, not the long‐term. The CEO grant date pay premium in the most recent year is much more influential than alignment or performance adjusted cost measured over a ten year horizon. The most recent year grant date pay premium explains 67% of the variation in SOP support, while the ten year alignment and performance adjusted cost of realizable pay explain only 36%. Second, SOP voting is extremely forgiving. The trendline equation implies that vote support won’t below 50% until the premium over fair pay is 9,679%. [14] Third, SOP voting can be unfair to management because it provides less than 100% support at fully fair pay. In the trendline above, support is only 91.3% at a zero pay premium, i.e., at fully fair pay.
This analysis of SOP voting leads to a two factor measure of SOP voting quality that we can use to evaluate SOP voting by individual funds. Our two factors tell us whether SOP voting is informed and fair. We use the alignment (r‐sq) of SOP voting with a pay equity measure to test whether SOP voting is informed and we use the percent “no” vote on CEOs with 100%+ premiums over fair pay to test whether SOP voting is fair to shareholders. Our measure of SOP voting quality is the average of alignment (r‐sq) and percent “no” vote for 100%+ pay premiums, giving us a scale that runs from 0 for uninformed and unfair SOP voting to 100% for fully informed and fair SOP voting.
We incorporate two refinements to the analysis above to improve the voting quality measure. First, we use 100‐300+ votes for each fund to test the importance of three measures of CEO pay equity (pay equity vs relative TSR, pay equity vs relative ROIC and pay equity vs other members of the top 5 [15]) and use the weighted average of these three pay equity measures that’s most consistent with the fund’s voting. Second, we adjust for unfairness to management before calculating the percent “no” vote on CEOs with 100%+ premiums over fair pay. As we saw above, the trendline for total investor SOP support is unfair to management because it provides support of only 91.3% at a zero pay premium. To correct for this bias, we need to increase the trendline constant from 91.3 to 100.0, making the trendline equation SOP support = 100—4.5 x ln pay premium. With this adjustment, the trendline “no” vote at a 100% pay premium is only 3.1.
In 2017, Mark Van Clieaf and I used SOP votes at 302 companies to measure SOP voting quality at 213 funds. Four key findings from this analysis are: (1) SOP voting quality at the best funds is 50% better than average investor voting, but (2) SOP voting quality at three quarters of the 213 funds is worse than average investor voting, (3) only 3 of 213 funds have SOP voting alignment (r‐sq) of 50%+ with long‐term (10 year) pay alignment or performance adjusted cost and (4) a quarter of the 213 funds are unfair to management in that they provide less than 90% support at zero pay inequity.
Figures 8 and 9 show the two components of SOP voting quality for the fund with the highest voting quality, Wells Fargo Advisors. Figure 8 shows that Wells Fargo’s weighted pay equity measure explains 76% of the variation in its SOP support. The pay equity weights that best explain Wells Fargo’s proxy votes are pay equity vs relative TSR 40%, internal pay equity 38% and pay equity vs relative ROIC 22%. Figure 9 shows that Wells Fargo voted “no” on 31 of the 86 companies with 100+ pay premiums vs its weighted pay equity measure, a “no” vote percentage of 36%. Wells Fargo’s SOP voting quality is the average of these two percentages, 56% = (76% + 36%)/2.
Figure 8 Figure 9

Figure 10 shows SOP voting quality for the top ten funds. The dashed line shows all investor voting quality (37.8%) measured using the same 302 companies we use to measure fund voting quality. When we restrict the sample to these 302 companies, all investor voting alignment with pay equity increases from the 67% shown in Figure 7 to 70.0%. The equation of the trendline is 92.613—8.202 x ln pay premium. When we correct for unfairness to management, the all investor percent “no” vote at a 100% pay premium is 5.7%, giving us a SOP voting quality of 37.8% (= 70.0% + 5.7%)/2. Voting quality for the best fund, Wells Fargo, is 55.9%, or almost 50% better than all investor voting quality.
Figure 10
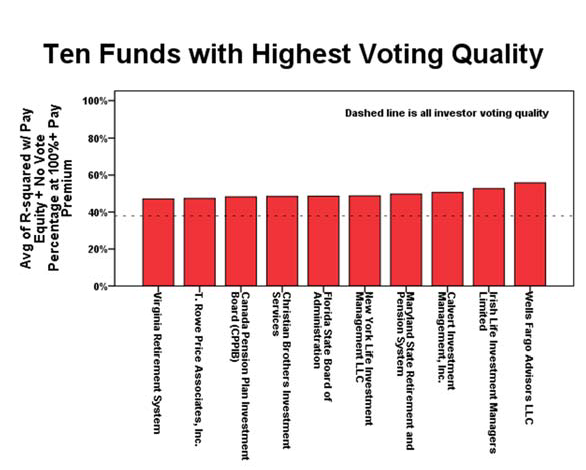
There is surprising diversity among the ten funds with highest voting quality. Four are asset owners (Maryland, Florida, Canada Pension Plan and Virginia) and six are asset managers. A desire to avoid offending potential 401(k) clients might cause asset managers to do a more perfunctory job than asset owners, but there is no statistically significant difference in SOP voting quality between asset managers and asset owners (and that’s still true when we control for assets under management).
Figure 11 shows SOP voting quality for the ten largest funds.
Figure 11
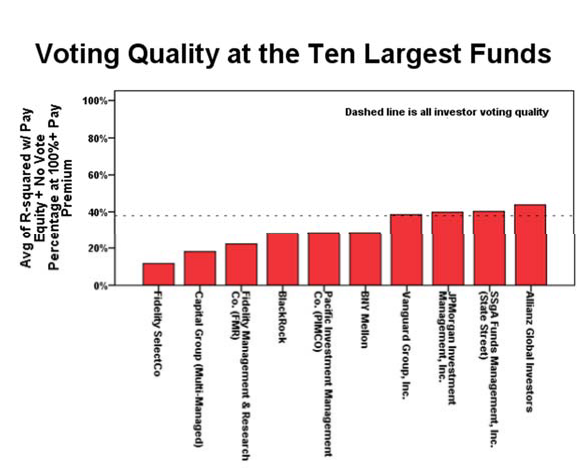
Six of the ten largest funds have lower SOP voting quality than the average investor. Having more resources available for governance analysis should lead to more informed voting, but a reasonable proxy for governance resources—total assets under management—does not have a statistically significant effect on voting quality across the whole sample nor for asset owners or asset managers separately.
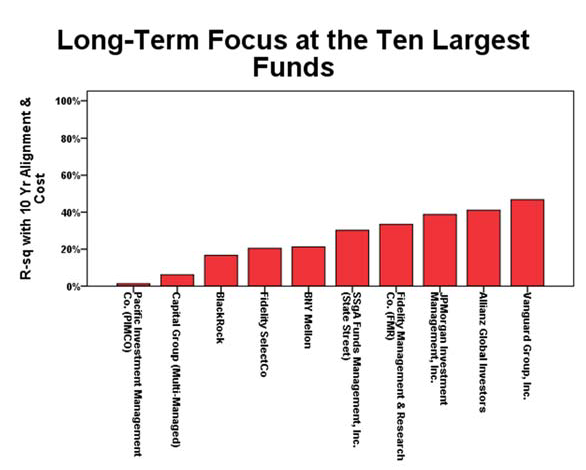
Figure 12 shows a measure of long‐term focus at the ten largest funds. We use SOP voting alignment with ten year measures of pay alignment and performance cost as our measure of long‐term focus. [16]
SOP voting alignment (r‐sq) with the current year pay premium averages 44% for these ten funds, while voting alignment (r‐sq) with ten year pay measures (alignment and/or performance adjusted cost) averages only 26%. Voting alignment (r‐sq) with ten year pay measures exceeds 50% for only three of all 213 funds (Maryland, Louisiana and Wells Fargo).
Figure 12
How Institutional Investors Can Improve Their SOP Voting
The biggest weakness in SOP voting as a mechanism of investor oversight of executive and director oversight is investor failure to clearly communicate their pay for performance analysis to their portfolio companies. T. Rowe Price is one of the ten best funds in SOP voting quality, but it is typical in communicating with its portfolio companies in very general terms: “we look at the correlation of executive pay and company performance over periods of three, four and five years. Performance is defined in terms of total shareholder return and financial measures appropriate to the company’s primary industry. We use data from two outside research providers, Glass Lewis and Equilar, to assess the long‐term linkage between pay and performance.” [17] Glass Lewis is similarly general, touting its “highly nuanced approach” and “proprietary pay‐for‐performance model.” `[18]
I believe that institutional investors would have much greater impact on their portfolio companies if they adopt a pay for performance analysis that is specific and practical. By specific, I mean that it’s articulated in sufficient detail that a portfolio company can do the analysis itself. By practical, I mean that the institutional investor can show that there is a pay plan design that provides perfect pay for performance. [19] In addition to the specific and practical analysis, the investor must articulate a standard that triggers a “no” vote.
I recommend that institutional investors adopt the pay for performance analysis shown in Figure 1 with the voting guideline that alignment (r‐sq) below 50% or a pay premium at industry average performance of 50%+ will trigger a “no” vote. I also recommend that institutional investors give their portfolio companies a right of rebuttal that gives them the opportunity to demonstrate high alignment and reasonable cost using a similar analysis with modified assumptions. For example, the portfolio company may feel that a different peer group or an operating measure of relative performance or a longer measurement period is appropriate. If the portfolio company feels that changed circumstances make its ten year pay history irrelevant, the portfolio company should have the opportunity to demonstrate high alignment and reasonable cost with a Monte Carlo simulation. [20]
Adopting Figure 1 as a model pay for performance analysis will require institutional investors to build expertise in four areas. They need the ability to:
- Compute realizable pay over ten year periods,
- Compute market rates of pay that take account of position, industry and company size, and estimate the expected future value of market pay,
- Compute relative TSR taking account of industry beta, and
- Measure pay alignment, pay leverage and performance adjusted cost.
While institutional investors may seek out vendors to provide them with this data, they need to build the in‐house expertise to understand the analyses and explain them effectively to companies they engage with over low alignment and/or high cost.
Conclusion
In this article, we have shown that there is a real need for investor oversight of executive and director pay, but also for institutional investors to do a much better job on SOP voting. Operating companies universally embrace a pay policy, i.e., competitive target compensation regardless of past performance, that leads to low alignment of pay and performance, and not surprisingly, 63% of S&P 1500 companies have low alignment of CEO pay and performance and 60% have low alignment of director pay and performance. Modern directors have little incentive to protect shareholder interests in pay because they are paid labor providers, just like management, not stewards of substantial personal capital.
A measure of SOP voting quality that takes account of whether voting is responsive to differences in pay equity and fair to both management and shareholders shows that three quarters of major institutional investors have lower voting quality than the average investor. Only three of 213 funds are even half way to fully informed and fair voting. Our analysis also shows that SOP voting is short‐term focused with much lower sensitivity to ten year pay alignment and cost than to current pay premiums. Investor impact is further weakened by failure to provide portfolio companies with specific and practical pay for performance analysis. We recommend that institutional investors tie their SOP voting to a ten year analysis of CEO pay for performance that uses realizable pay to quantify pay leverage, pay alignment and the pay premium at industry average performance.
The complete article is available here.
Endnotes
1All the analysis discussed in this paper can also be done using a measure of relative operating return. (go back)
221% = exp(0.19)—1. (go back)
3Pay leverage = correlation x (relative pay standard deviation / relative performance standard deviation). Southwest’s pay leverage is 1.98 and its correlation is 0.79 (the square root of its alignment (r‐sq) of 62%), so its relative pay risk is 1.98/0.79 = 2.51.(go back)
4Each observation is relative CEO pay and relative performance for a one to ten year period beginning in 2007 and ending in 2007 to 2016.(go back)
5See Stephen F. O’Byrne, “Three Versions of Perfect Pay for Performance (or the Rebirth of Partnership Concepts in Executive Pay)”, Journal of Applied Corporate Finance, Vol 26, Num 1 Winter 2014.(go back)
6Glass Lewis, 2018 Proxy Paper Guidelines, p. 28.(go back)
7See Stephen F. O’Byrne and E. Mark Gressle, “How ‘Competitive Pay’ Undermines Pay for Performance (and What Companies Can Do to Avoid That)”, Journal of Applied Corporate Finance, Vol 25, Num 2, Spring 2013, pp. 26‐38.(go back)
8See Stephen F. O’Byrne and E. Mark Gressle, “How ‘Competitive Pay’ Undermines Pay for Performance (and What Companies Can Do to Avoid That)”, Journal of Applied Corporate Finance, Vol 25, Num 2, Spring 2013, pp. 26‐38.(go back)
9Stephen F. O’Byrne, “Aetna’s $640 Million CEO Is Overpaid by $440 Million”, Seeking Alpha (https://seekingalpha.com/article/4133015‐aetnas‐640‐million‐ceo‐overpaid‐440‐million).(go back)
10Stephen F. O’Byrne and S. David Young, “The Evolution of Executive Pay Policy at General Motors 1918‐2008”, Journal of Applied Corporate Finance, Vol 29, Num 1, Winter 2017.(go back)
11Institutional Shareholder Services, ExecComp Insights August‐September 2017.(go back)
12The pay leverage in this study is based on the norm that pay percentile = performance percentile. We regressed ln relative pay on ln(1 + relative TSR) for companies where the CEO’s pay percentile was within 5 percentage points of the company’s relative TSR percentile. The slope of the trendline was 0.9.(go back)
13 Relative pay by itself only explains 57% of the variation in SOP vote support. Relative TSR by itself also explains only 57% of the variation in SOP vote support.(go back)
1414 91.3 – 4.5 x ln pay premium = 50 implies ln pay premium = 41.3/4.5.(go back)
15Our measure of internal pay inequity is ln(CEO pay/2.5 x median pay of the other top 5).(go back)
16Our measure is the fund’s highest SOP voting r‐squared across three ten year pay measures, i.e., pay alignment, the pay premium at industry average performance and pay alignment (r‐sq) minus the pay premium at industry average performance.(go back)
17T. Rowe Price, Proxy Voting Guidelines 2017, p. 8.(go back)
18Glass Lewis, U.S. Proxy Voting Guidelines 2018, pp. 27, 29.(go back)
19The two major proxy advisors, ISS and Glass Lewis, are both deficient on these standards. ISS has a specific pay for performance analysis but has never been able to show that there is plan design that provides perfect pay for performance in its system. See Stephen F. O’Byrne, “Achieving Pay for Performance”, Conference Board Director Notes, Vol 4, Num 24 Dec 2012, p. 10. Glass Lewis is unwilling to disclose a specific pay for performance analysis.(go back)
20For companies using Monte Carlo simulation, I recommend requiring higher standards of alignment and cost, e.g., alignment (r‐sq) of 75%+ and a pay premium at industry average performance of 25% or less, to mitigate the optimism of forecast assumptions.(go back)