 Print
PrintRebecca Burton is a lead associate and Michael Bowie is a senior associate at Willis Towers Watson. This post is based on a Willis Towers Watson memorandum by Ms. Burton and Mr. Bowie. Related research from the Program on Corporate Governance includes The Growth of Executive Pay by Lucian Bebchuk and Yaniv Grinstein and Paying for Long-Term Performance by Lucian Bebchuk and Jesse Fried (discussed on the Forum here).
Total pay for non-employee directors continues to grow at a modest but steady rate, driven by increases to the annual cash retainer and the value of annual equity grants. Not all aspects of director compensation and corporate governance remain predictable, however. Annual compensation for directors continues to be a hot topic for shareholders and boards alike, precipitated by the ongoing attention to shareholder lawsuits that allege “excessive” pay for board members. This mutual interest has prompted boards to look for ways to mitigate exposure to lawsuits involving director pay programs; the most visible result is the swift action taken in adopting annual compensation limits specific to directors.
Willis Towers Watson’s Global Executive Compensation Analysis Team (GECAT) reviewed 300 publicly-owned companies from the 2018 Fortune 500 list with proxies filed by June 30, 2018 for this director compensation trends analysis and compared results to data from the same companies reported in 2017. (For our previous director pay trends report, see “Balanced pay adjustments fuel growth in Fortune 500 outside director pay,” Executive Compensation Bulletin, July 27, 2017.) Figures 1 and 2 provide an overview of the range and prevalence of all elements of director pay.
Figure 1. Outside director compensation—percentile values [1]
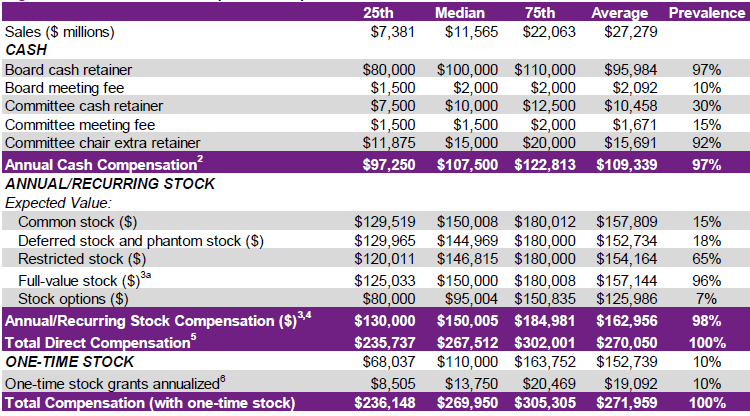
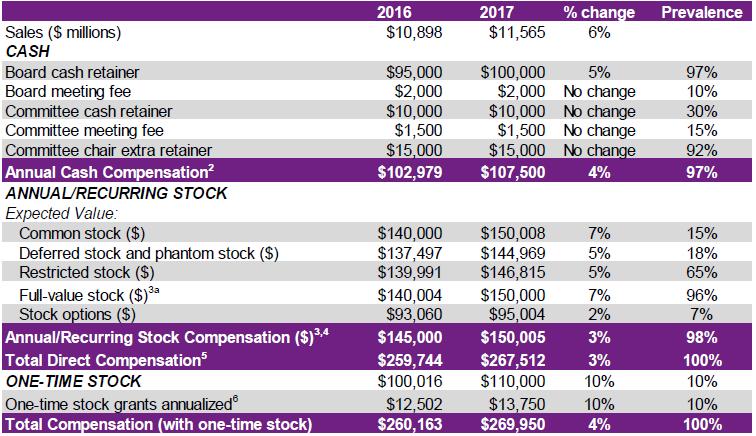
Figure 2. Median outside director compensation
The average pay mix for a director stayed constant at 43% cash and 57% equity, with restricted stock remaining the equity vehicle of choice with a prevalence of 65%. Variable cash elements did not change in value at the median, even as the prevalence of per-meeting fees for attendance at board and committee meetings fell from 13% to 10% and from 20% to 15%, respectively. Though usage of meeting attendance fees decreased, the prevalence of flat cash retainers for committee member service remained at 30%.
Total direct compensation rose to approximately $267,500 this year, compared to last year’s $259,750. This 3% growth occurred because 40% of companies made changes to the core elements of their director pay programs. Annual cash compensation increased 4% at the median, from $103,000 to $107,500, bolstered by a 5% increase to the annual cash retainer. Total stock compensation grew by $5,000 at the median, an uptick of 3%.
One-half of the companies that made changes to their annual pay programs adjusted both the cash retainer and stock grant. However, companies that made a change to only one of these two components were nearly three times more likely to modify the annual equity award rather than adjust the board cash retainer. More than a third (38%) of companies changed only their equity component compared to 13% that changed solely cash. The median value of increases to the annual cash retainer was $10,000, while the median stock value increase was $15,000.
Annual compensation limits
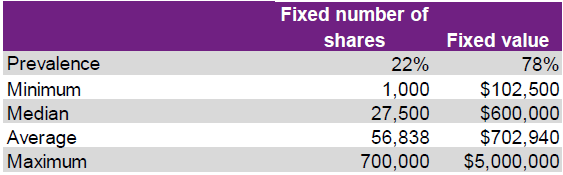
The percentage of companies implementing an annual compensation limit continues to grow, as 61% of the group (previously 55%) now have a limit, including 17 which were newly-established this year. Several shareholder lawsuits alleging that “excessive” board-approved stock grants had been made to directors first pushed annual award limits into the spotlight. The claims made by shareholders in these lawsuits were not dismissed because the company’s stock plan did not contain a “meaningful” limit for directors. Since the “meaningful” standard is not explicitly defined, companies are taking a practical approach to interpreting this criteria and are focusing on the form and scope of the limits. As shown in Figure 3, fixed-value limits are more prevalent than those based on a fixed number of shares (78% and 22%, respectively), as they offer a more clearly defined pay ceiling. Furthermore, limits continue to go beyond covering only annual stock grants: 32% of annual compensation limits now cover both stock and cash compensation, compared to 29% in this group last year. The direct cause of this shift is that the majority of newly-adopted limits in this sample (59%) incorporated both cash and equity.
Figure 3. Director–specific annual compensation limits: 2017
Compensation review
Nearly half (49%) of companies review their non-employee director pay program at least annually. Conversely, just 6% of companies disclosed either a biennial or triennial frequency of a compensation review, while 29% used less defined terminology such as “periodically” or “from time to time.” The responsibility of spearheading this review generally lies with either the compensation committee (55% of the group) or the nominating and corporate governance committee (36%). (The responsibility at the remaining 9% were divided among various committees, overseen by the board, or otherwise not disclosed.) Companies may want to review their pay structures more frequently to avoid becoming an outlier considering the increased attention recent shareholder lawsuits have brought to board compensation.
Board leadership
Figure 4. Pay for board leadership positions
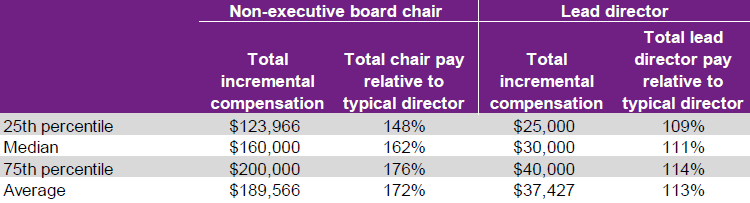
Forty-nine percent of the companies in our sample separated the positions of board chair and chief executive officer, up from 47% in the prior year. These stand-alone board chairs served largely in a non-executive capacity, with 71% (or 35% of the entire group) serving as non-executives, up from 68% last year. The overwhelming majority (95%) of companies provided additional pay above what is paid for services as a director to individuals serving as a non-executive board chair, the median value of the incremental additional compensation is $160,000 (Figure 4). Nine out of 10 non-executive chairs receive an extra cash retainer as all or part of their incremental compensation, while just 33% of board members serving in this leadership role are granted an additional equity award.
In contrast to the rise in the number of standalone board chairs, the prevalence of companies identifying a lead or presiding director decreased from 73% to 70%. However, the recognition that this should be a paid role is increasingly ubiquitous, as 84% of companies paid an additional fee for serving as a lead director, compared with 79% last year.
Ninety-seven percent of companies compensated their lead director with an extra cash retainer; only one out of eight were granted an additional stock award. While cash and equity values each rose marginally at the median, total additional compensation for the lead director remained unchanged at $30,000.
Share ownership and retention
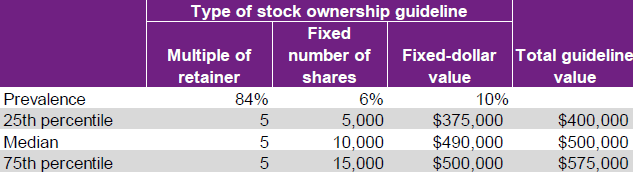
Stock ownership guidelines and retention requirements are nearly universal, with 94% of companies in this sample having one or both. Eighty-four percent of companies have equity ownership guidelines based on a multiple of the annual retainer (Figure 5), while the majority (55%) of retention requirements mandate a holding period which lasts until the stock ownership guidelines are met.
Figure 5. Stock ownership guidelines for directors
Define and refine pay
Non-employee director pay rose moderately this year, buoyed by measured increases to cash and equity which resulted in a static pay mix. However, pay program design remained relatively the same, as compensation continued to be delivered primarily through fixed-value components. As more companies implement director-specific annual compensation limits, it will be interesting to see if, and how, these mandates will affect how companies structure their director pay programs.
Endnotes
1The sample consisted of 300 publicly-owned companies in the 2018 Fortune 500 that filed their fiscal year 2017 proxy statements by June 30, 2018.(go back)
2 Annual cash compensation is calculated as follows:
-
- Values reported for fees earned or paid in cash in the Director Summary Compensation Table are identified for each director.
- Directors who did not serve the entire fiscal year, as well as directors in leadership positions receiving supplemental compensation (e., board chair and lead director) and chairs of the three primary committees (audit, compensation and nominating/governance) are removed.
- The median value is identified for the remaining directors to determine the total cash compensation for “typical” directorial duties.
- The value of the retainer is eliminated from the total cash compensation for the “typical” director to determine the value, if any, of total variable cash fees.
- Annual cash compensation is the combined value of the annual cash retainer and the median value of variable cash fees.(go back)
3Stock compensation is determined using ASC 718 values reported in company proxy statements.
- Full-value stock represents the combined value of all full-value grants, regardless of the form of the award.(go back)
4All board/committee meeting fees and retainers that are paid in stock are included under annual/recurring stock compensation.(go back)
5Total direct compensation includes annual cash compensation plus annual/recurring stock compensation.(go back)
6One-time stock includes initial and discretionary stock-based grants. The values reflect the incremental additional value above that of the annual grant.(go back)
