This post is based on an ISS EVA memorandum by Anthony Campagna, Global Director of Fundamental Research for Institutional Shareholder Services ISS EVA; and Dr. G. Kevin Spellman, Senior Advisor at ISS EVA and David O. Nicholas Director of Investment Management & Senior Lecturer at the University of Wisconsin-Milwaukee and Adjunct Professor at IE Business School. Related research from the Program on Corporate Governance includes The Illusory Promise of Stakeholder Governance by Lucian A. Bebchuk and Roberto Tallarita (discussed on the Forum here); Companies Should Maximize Shareholder Welfare Not Market Value by Oliver Hart and Luigi Zingales (discussed on the Forum here); and Reconciling Fiduciary Duty and Social Conscience: The Law and Economics of ESG Investing by a Trustee by Max M. Schanzenbach and Robert H. Sitkoff (discussed on the Forum here).
ESG has been buzzing around the investing lexicon for the better part of two decades now, and for good reason, because ESG Matters. In our most recent white paper we highlight just how important ESG is in financial analysis by showing is that High-ESG + High-EVA firms add Alpha.
ESG—Environment, Social, and Governance—has gone mainstream. According to the ISS Market Intelligence Asset Management Industry Market Sizing Report ESG Funds were among the largest winners in 2020, taking in a record $60 billion in net flows, nearly triple their 2019 total. The CFA Institute’s position on ESG integration states that one should consider all material information, which includes material ESG factors. Governments and regulations are also pushing this effort. The EU Taxonomy Regulation entered into force in July 2020 and establishes the conditions that an economic activity has to meet to be qualified as environmentally sustainable.
ESG metrics measure how a firm is taking care of the planet (E and S) and shareholders (G), and EVA Margin measures a firm’s true profitability (see Don’t Be Fooled by Earnings, Trust EVA, (EVA) Profitability Drives Value, and How EVA Can Enhance DCF and PE Analysis).
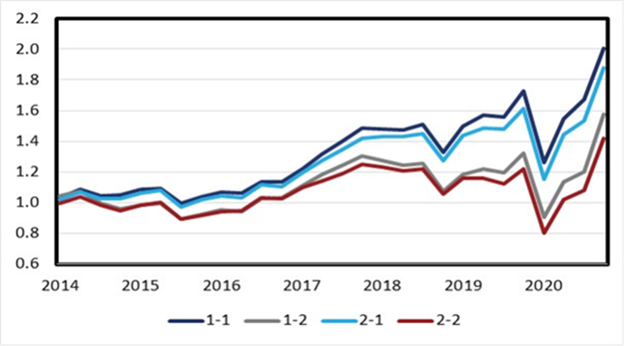
The use of ESG metrics in investment has been shown to provide sustainable value to investors. Figure 1 below shows that combining ESG with EVA is even better. The left axis is the total return of the basket of companies over the time period. The 1-1 line shows high-ESG Performance and high-EVA Margin stocks; 1-2 represents high-ESG Performance and low-EVA Margin securities; 2-1 stocks have low ESG Performance and high-EVA Margin; and 2-2 stocks are low-ESG Performance and low-EVA Margin companies. Companies represented by the 1-1 line are up 100% over the last five years (ie more than doubling), higher than stocks in line 2-1 with just a strong EVA Margin, and far better than companies with low ESG performance and EVA Margin.
Figure 1:

Source: ISS EVA
To pass the test of whether an investment strategy works, the results must not be driven by outliers. That means it should work in most sectors, countries, time periods, and in more stocks than not, and if it does not outperform, then it must make sense (e.g., risk-on versus risk-off markets favor different factors). Combining ESG with EVA passes the tests.
Lastly, a key finding from this research is that Improving profitability and growth are related to positive change in ESG Performance. The complete publication highlights that higher EVA Margin, EVA Spread, and return on invested capital are all associated with improvements in ESG Performance going forward.
The complete publication is available here.
 Print
Print