 Print
PrintNatalie Cooper is Senior Manager and Robert Lamm is an independent senior advisor, both at the Center for Board Effectiveness, Deloitte LLP; and Randi Val Morrison is Vice President, Reporting & Member Support at the Society for Corporate Governance. This post is based on a Deloitte memorandum by Ms. Cooper, Mr. Lamm, Ms. Morrison, Carey Oven, and Caroline Schoenecker. Related research from the Program on Corporate Governance includes Politics and Gender in the Executive Suite by Alma Cohen, Moshe Hazan, and David Weiss (discussed on the Forum here); and Will Nasdaq’s Diversity Rules Harm Investors? by Jesse M. Fried (discussed on the Forum here).
This post revisits topics raised in our earlier post, published in October 2020, that explored how companies and boards were responding to events of that year surrounding systemic racism and racial inequality. Specifically, we explore how practices pertaining to diversity, equity, and inclusion (DEI) have changed in the past year in areas such as reporting, meeting agendas, and actions taken by the company, management, and/or the board. We also review additional topics related to DEI, including board recruitment, board education, and executive compensation incentives.
Our findings are based on an October 2021 survey of Society for Corporate Governance members representing more than 120 public companies. As anticipated in our inaugural issue, the findings in this area have evolved over the past year, and we expect ongoing change in corporate governance practices, as well as on a societal level, amid increasing calls for action and progress.
Findings
Respondents, primarily corporate secretaries, in-house counsel, and other in-house governance professionals, represent public companies of varying sizes and industries. [1] The actual number of responses for each question is provided. Where applicable, commentary has been included to highlight differences among respondent demographics. In some cases, additional commentary is provided to highlight comparisons to public company results of similar questions asked in our 2020 inaugural Board Practices Quarterly survey and in our 2018 Board Practices Report.
Access results by company size and type.
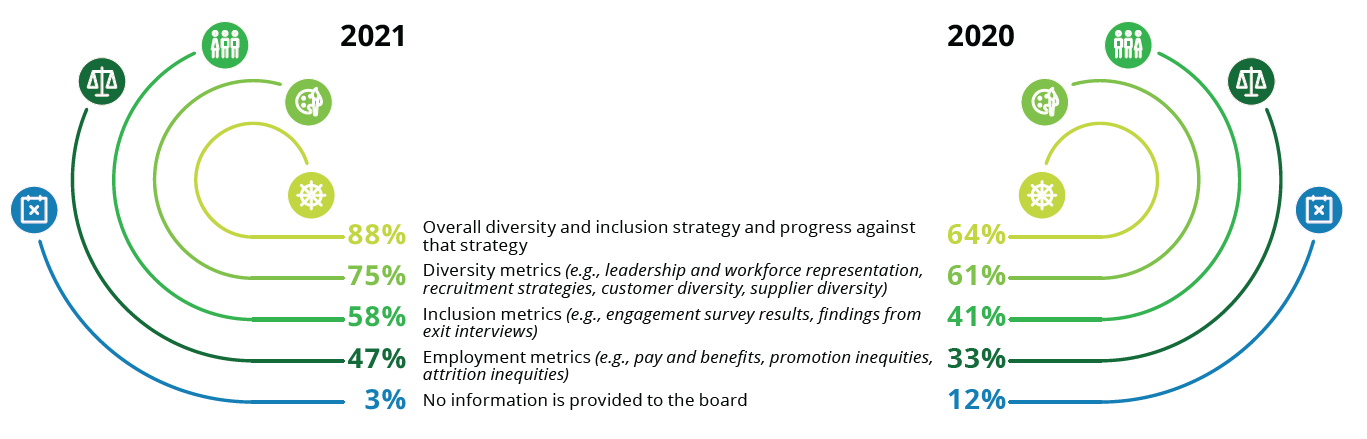
What information does management provide to the board on company practices, strategy, and performance related to diversity, equity, and inclusion? Select all that apply. (118 responses)
Compared to our 2020 survey results, all market caps reported more information being provided to the board on diversity and inclusion strategy and related progress. In 2021, 88% of public companies provided such information, versus 64% in 2020. In 2021, just 3% reported providing no DEI information to the board (representing 13% small-caps and 3% mid-caps), compared to 12% in 2020.
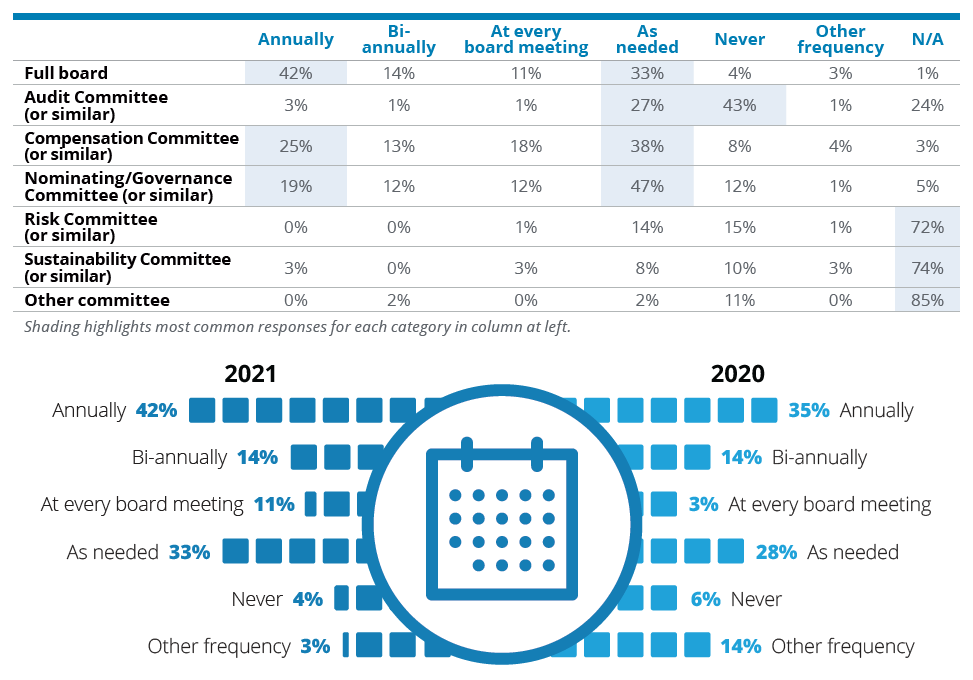
How often are diversity, equity, and inclusion-related matters on the agenda of the board and/or agenda(s) of the committee(s) responsible for oversight of DEI matters? (107 responses)
Aside from the full board, the compensation and nominating/governance or similar committees most commonly have DEI matters on their agendas. For those committees, DEI matters are most commonly on the agendas on an as-needed basis, followed by annually. At the full board level, DEI is most commonly on the agenda annually. This year’s results show year-over-year increases across frequencies at the full board level compared to a similar question asked in 2020. (See chart below.)
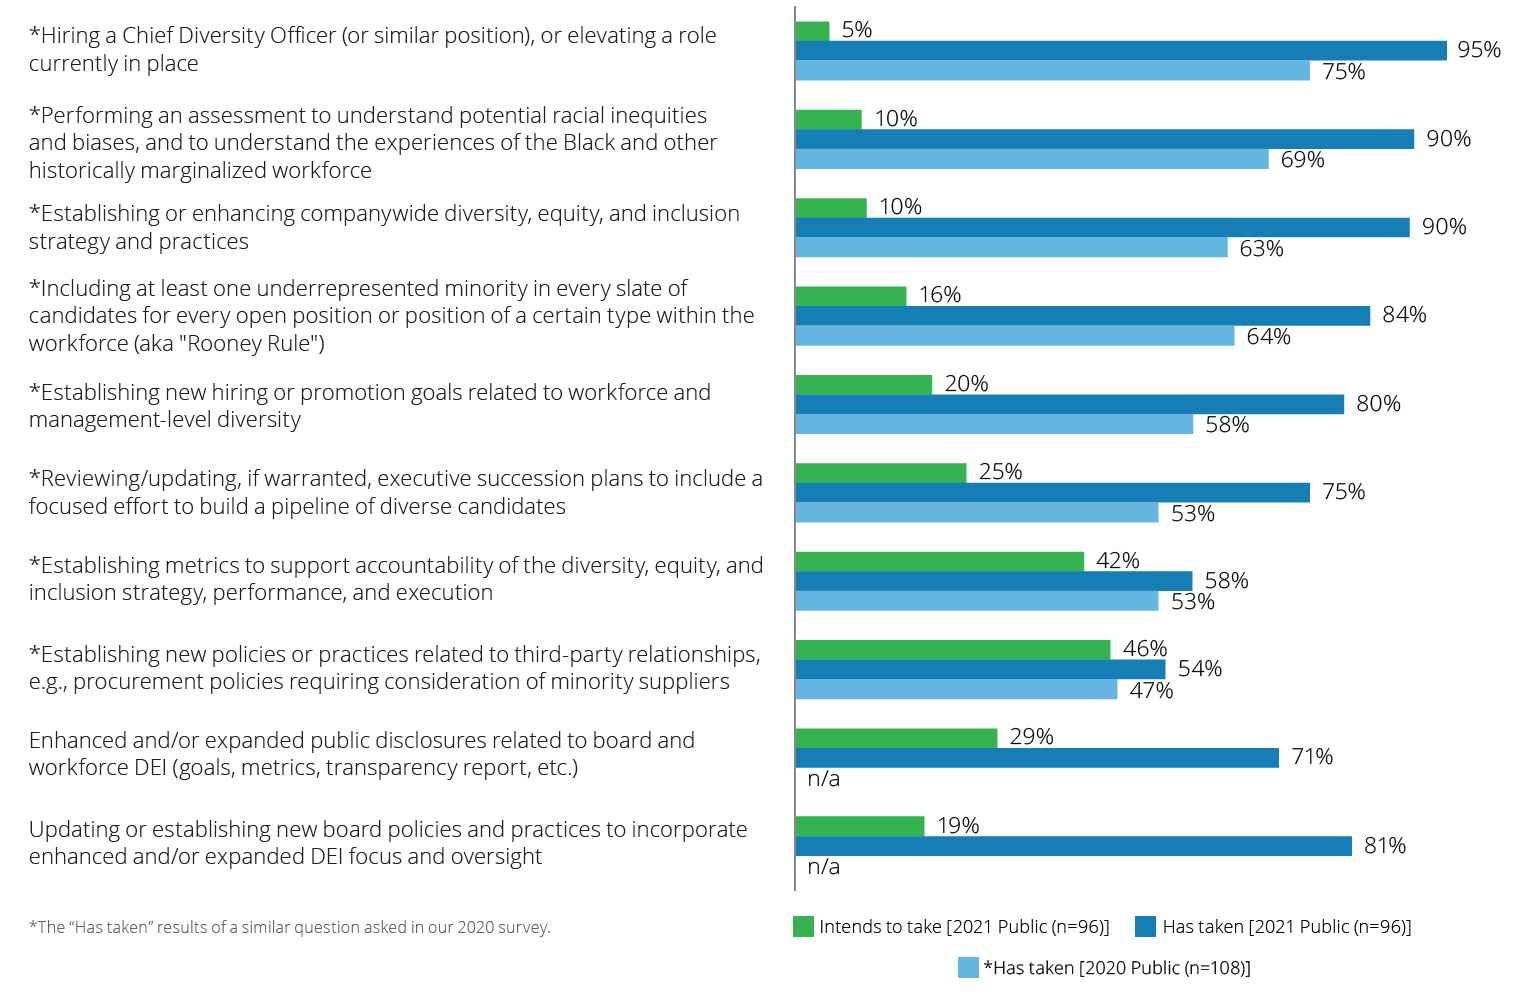
Which of the following actions has your company and/or board taken—or intends to take—in response to the widely publicized events of 2020 and ongoing developments surrounding racial inequality and inequity? Select all that apply. (96 responses)
More than 70% of all large-caps reported taking all of the enumerated actions, with 100% reporting hiring a Chief Diversity Officer (or similar) and performing an assessment to understand potential racial inequities and biases, and to understand the experiences of Black and other historically marginalized members of the workforce.
A majority of mid-caps reported having taken all of the enumerated actions other than establishing new policies or practices related to third-party relationships, which more than two-thirds reported they intend to pursue.
All small-caps reported having performed assessments and established new workforce and management-level diversity hiring or promotion goals. More than 70% reported they have established or enhanced company-wide DEI strategy and practices and 80% reported they have updated or established new board policies and practices to incorporate enhanced and/or expanded DEI focus and oversight. Few small-caps reported taking any of the other actions, although all reported they intend to include at least one underrepresented minority in every slate of candidates for open positions, and 75% reported they intend to enhance public DEI disclosures and establish accountability metrics.
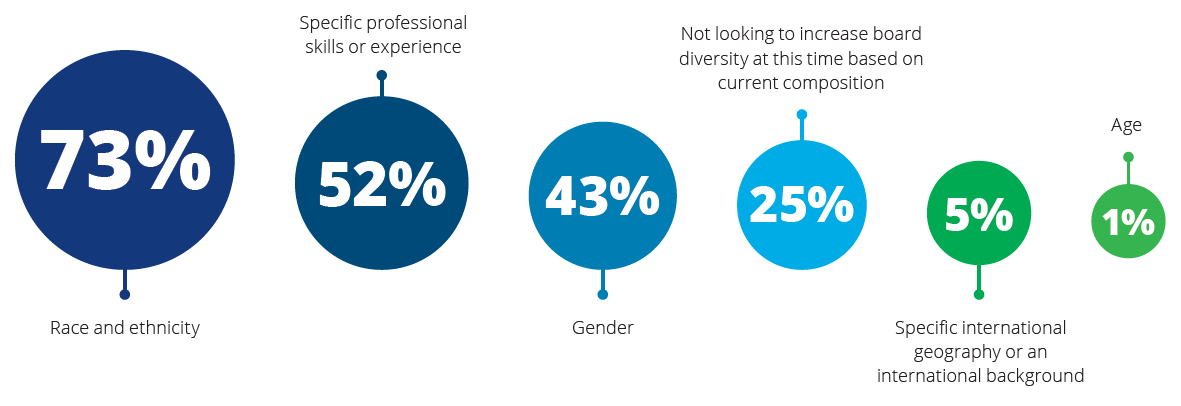
If your board is looking to increase diversity, which 1–2 attributes are the top recruitment priority? Select up to two. (84 responses)
Among large-caps, about 80% reported race and ethnicity was a priority, followed by gender at 56%. For mid-caps, 64% reported race and ethnicity, followed closely by specific professional skills and experience at 62%. All (100%) small-caps reported race and ethnicity is a top recruitment priority, followed by 50% that reported gender. A similar question was asked in our 2018 Board Practices Report, where the top responses among all company sizes were gender (61%); race and ethnicity (48%); and specific professional skills or experience (43%).
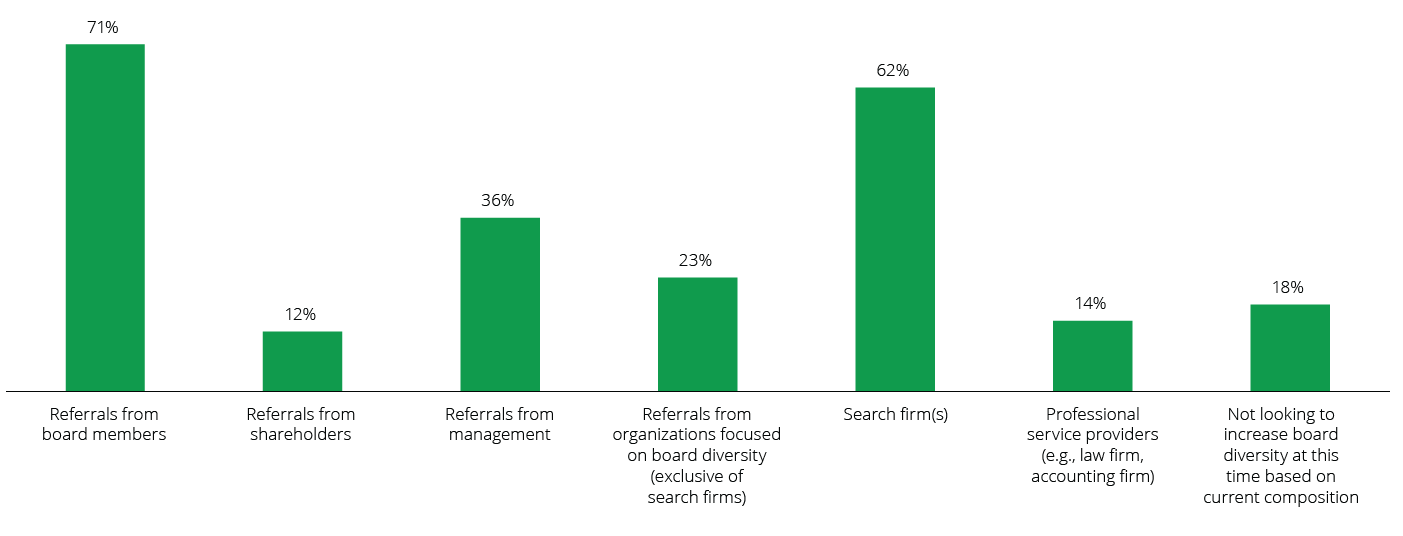
If your board is looking to increase diversity, where does it look for recruitment? Select all that apply. (90 responses)
Large- and mid-caps primarily seek referrals from board members as well as from search firms, whereas small-caps primarily look to board members and management. Referrals from organizations focused on board diversity (exclusive of search firms) varied across market caps: 16% large-cap, 26% mid-cap, and 43% small-cap.
A similar question asked in our 2018 Board Practices Report revealed similar responses, in which referrals from board members and from search firms were the most common responses by a significant margin, at 77% and 73%, respectively. Referrals from organizations focused on board diversity (exclusive of search firms) was not among the answer choices in 2018, but it will be interesting to see how this source of recruitment evolves given the increasing number of such organizations.
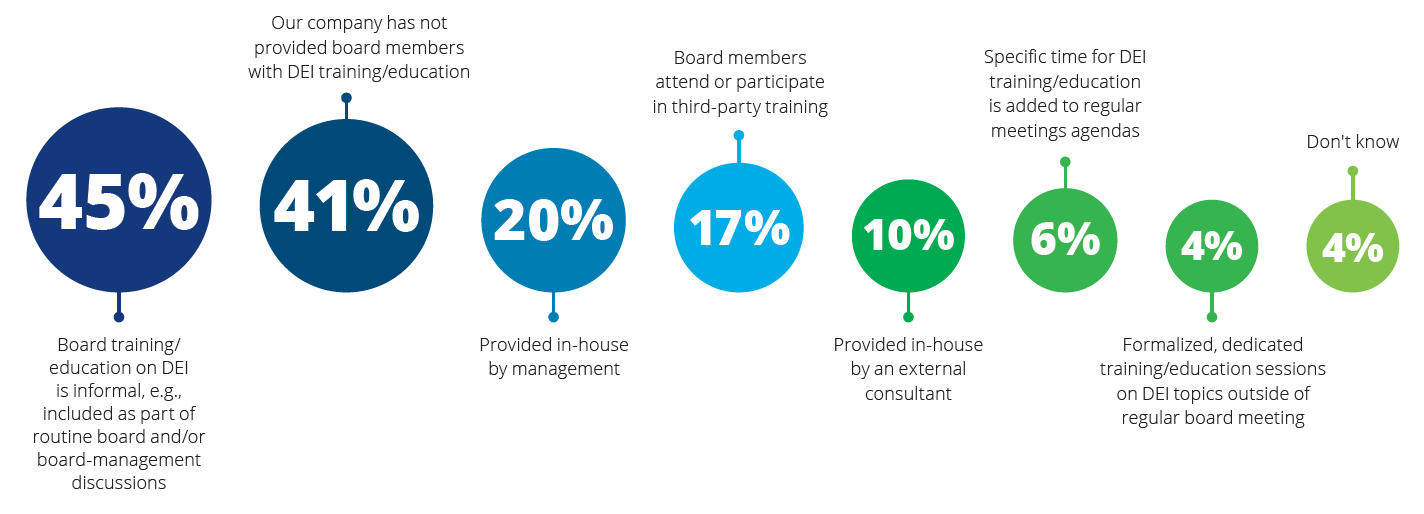
Which best describes DEI training/education for your company’s board? Select all that apply. (93 responses)
A plurality of companies (45%) reported informal DEI training/education (e.g., included as part of routine board and/or board management discussions). Another 41% reported that their companies have not provided such training/education.
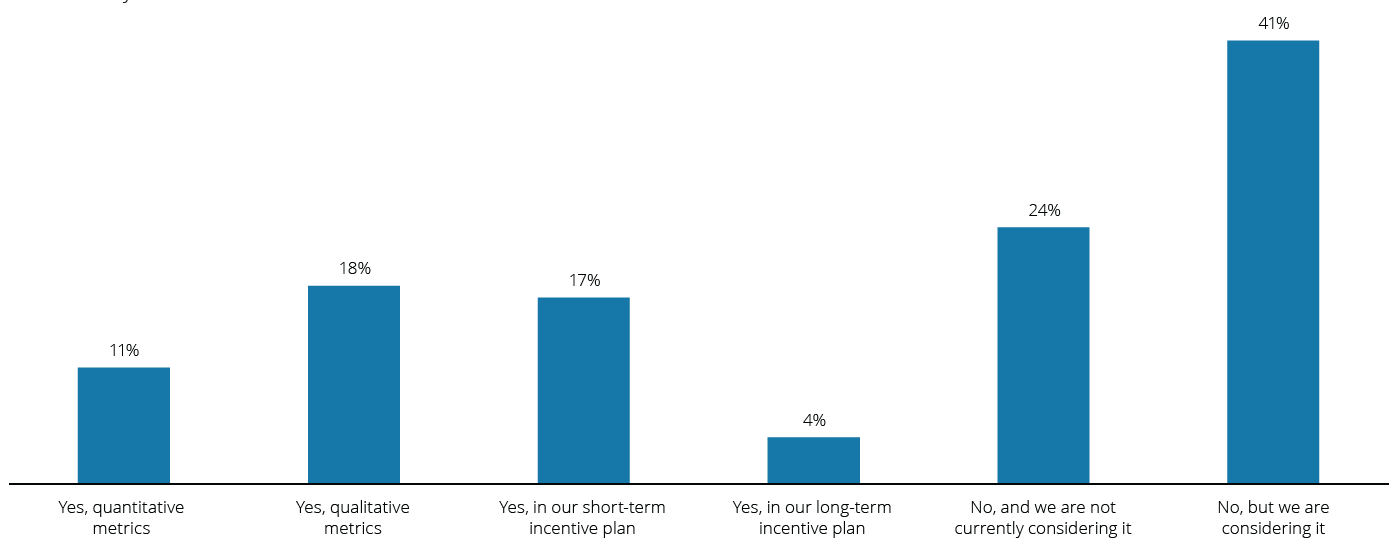
Has your company included one or more DEI metrics in its executive incentive plans? Select all that apply. (92 responses)
Although most respondents (65%) reported their company has not included one or more DEI metrics in its executive incentive plans, more than 40% say they are considering it.
Among large-cap respondents, 25% report that their executive incentive plans include at least one qualitative DEI metric; this is 16% for midcaps. Inclusion of quantitative DEI metrics is 17% and 8% for large- and mid-caps, respectively. Where such metrics are included, they most commonly appear in short-term incentive plans. 31% of large- and 51% of mid-caps do not include these but are considering doing so.
Among small-caps, none reported having DEI metrics included in their incentive plans; 29% are considering doing so, and 57% reported this is not currently under consideration.
Endnotes
1Public company respondent market capitalization as of December 2020: 42% large-cap (which includes mega- and large-cap) (> $10 billion); 52% mid-cap ($2 billion to $10 billion); and 6% smallcap (includes small-, micro-, and nano-cap) (<$2 billion). Respondent industry breakdown: 32% energy, resources, and industrials; 27% consumer; 25% financial services; 10% technology, media, and telecommunications; and 5% life sciences and health care. Throughout this post, in some cases, percentages may not total 100 due to rounding and/or a question that allowed respondents to select multiple choices.(go back)
