 Print
PrintKavya Vaghul is Senior Director of Research and Aleksandra Radeva and Kim Ira are Research Analysts at JUST Capital. This post is based on their JUST Capital memorandum. Related research from the Program on Corporate Governance includes Politics and Gender in the Executive Suite by Alma Cohen, Moshe Hazan, and David Weiss (discussed on the Forum here), and Duty and Diversity by Chris Brummer and Leo E. Strine, Jr. (discussed on the Forum here).
Key Findings
- As of September 2021, the majority of companies in the Russell 1000 (55%) disclose some type of racial and ethnic workforce data, a notable increase since January 2021, when only 32% of companies disclosed racial and ethnic data.
- Between September 2020 and September 2021, the share of companies disclosing an EEO-1 Report or Intersectional Data, the gold standard for demographic data reporting, has more than doubled, from 4% to 11%.
- While EEO-1 Report or Intersectional Data disclosure has historically been concentrated in the Technology industry (24 companies at the time of this analysis), the number of companies disclosing this data in the Financials industry has nearly caught up, more than doubling between January 2021 and September 2021, from nine companies to 22 companies.
After a year and half of pledges and promises to help advance racial equity, totaling at least $50 billion in both internal and external initiatives, investors, regulators, employees, and other key stakeholders are still looking for signals of action from corporate America. For many, a first step is transparency around corporate diversity, equity, and inclusion (DEI) efforts and, in particular, around racial and ethnic workforce and board demographics as an indicator of the state of representation.
While stakeholders recognize that this is a work in progress for companies, and that they can’t expect perfection, they’re making it clear that they’re no longer willing to accept inaction or silence on what steps companies have taken. Of Americans JUST Capital and The Harris Poll surveyed, 84% agreed that companies “often hide behind public declarations of support for stakeholders but don’t walk the walk.” Shareholder proposals on DEI soared last proxy season. Following New York City Comptroller Scott Stringer’s call to 67 S&P 100 companies to share the racial, ethnic, and gender breakdown of their workforces, half of this group has either disclosed or committed to disclose this data. The SEC has noted that disclosure of human capital metrics—workforce-related data, policies, and practices—is a key area of focus and that it could be issuing standards for disclosure on these measures this year.
JUST 100 leaders have reiterated the importance of this transparency, especially when achieving diversity targets or full representation is still out of reach. Accenture CEO Julie Sweet said in an interview with CNBC that when Accenture first disclosed the demographic breakdown of its U.S. workforce in 2015 its “numbers weren’t great,” but that recruitment “improved in all of our diverse categories because transparency builds trust.” Her sentiment was echoed by Nasdaq CEO Adena Friedman who said in a CNBC interview that Nasdaq’s decision to disclose the racial and ethnic demographics of its workforce has bolstered shareholder relations.
“In some respects, you sit there and say, ‘Well gosh I wish it was better, maybe I want to try and make it a better picture before I disclose it,’” she said. “But we made the decision, even though we know that we have work to do, to disclose that to investors and allow them to track our progress. Investors really appreciate the ability to track progress.”
Friedman’s point is one that many companies could soon no longer afford to ignore. At JUST Capital, we’ve been tracking if, and how, Russell 1000 companies have been sharing data around the demographics of their workforce and board. As investors, workers, the SEC, and others intensify their focus on these disclosures, we took a look at where companies currently stand and what’s changed in how they’re sharing this demographic information.
The Current State of Racial and Ethnic Workforce Data Disclosure
Despite how critical it is in assessing representation, the disclosure of racial and ethnic workforce data is highly unstandardized among companies in the Russell 1000. For instance, some companies follow the U.S. Census Bureau’s groupings, which include five baseline racial identities set out in government reporting standards (White; Black or African American; American Indian or Alaska Native; Asian; or Native Hawaiian or Other Pacific Islander) and two ethnic identities (Hispanic or Latino; or Not Hispanic or Latino), while others either further disaggregate or aggregate these groupings. What’s more, companies use different units of measurement: Some companies prefer to report the number (or count) of workers in each group while others display the data as percentages or shares of their U.S. workforce.
To best accommodate the wide variety of demographic data disclosed by companies, JUST Capital has been collecting 23 raw data points, comprising a range of highly generalized to highly granular racial or ethnic identities, since 2019. As of September 2021, when we last updated this data, a slim majority of companies in our currently ranked Russell 1000 universe (55%) disclose some type of racial and ethnic data about their U.S. workforce.
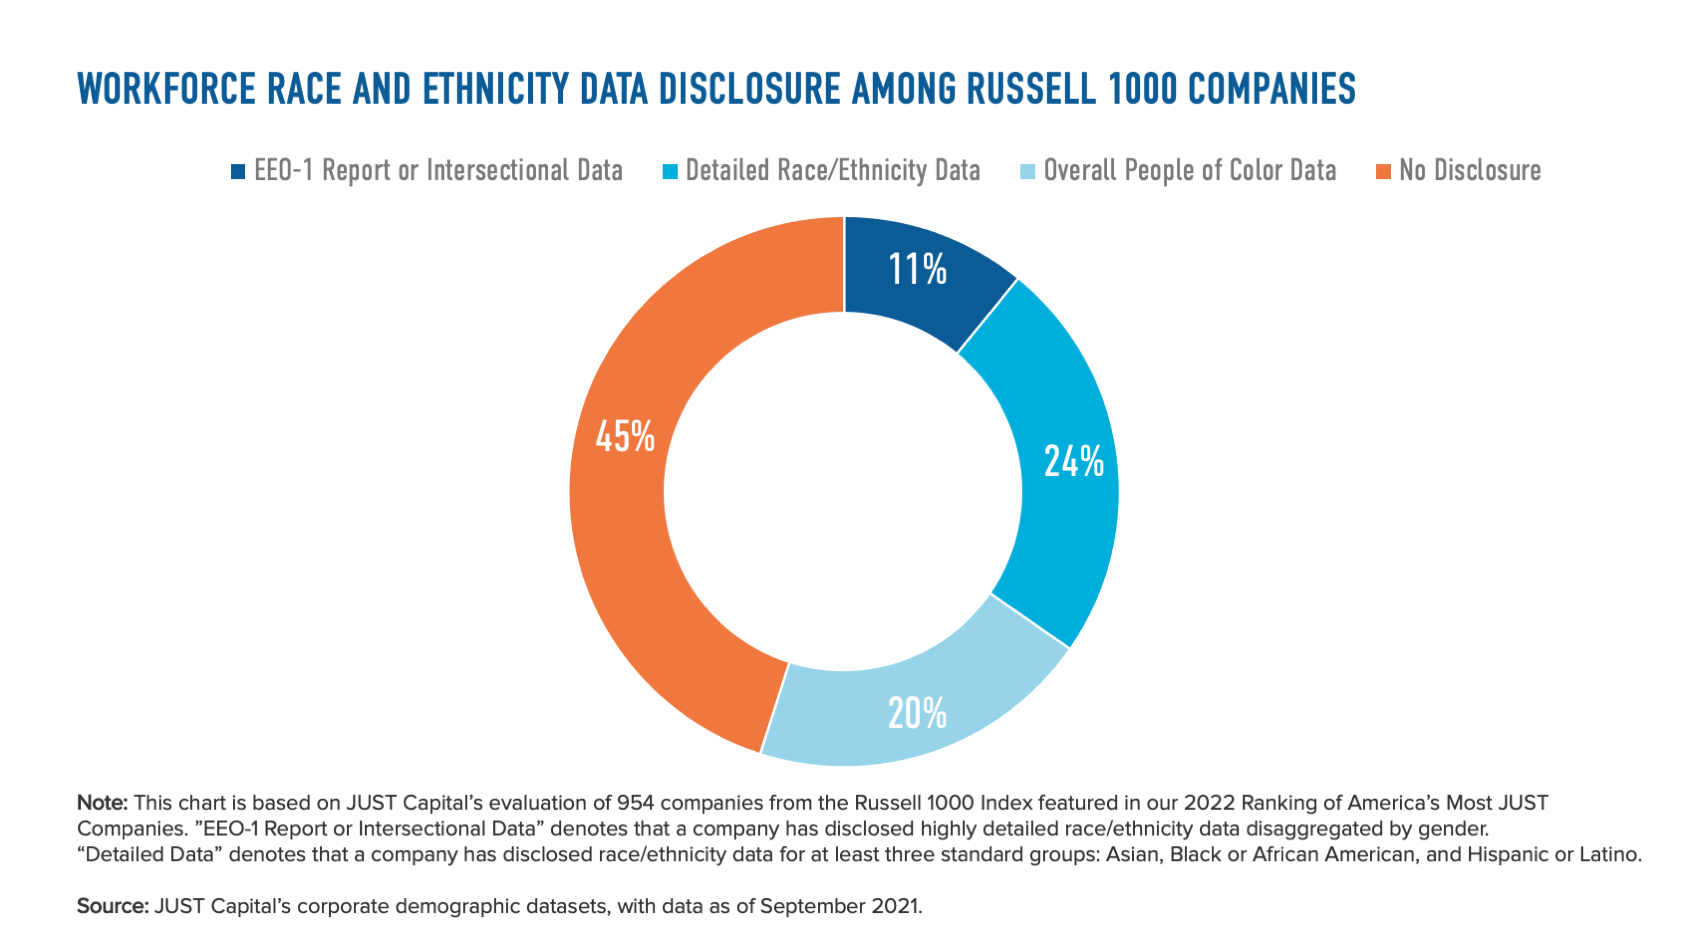
The 23 raw data points also help us parse companies into three key disclosure types, from least to most granular: (1) Overall People of Color Data, (2) Detailed Race/Ethnicity Data, and (3) EEO-1 Report or Intersectional Data.
Currently, 20% of our ranked universe (193 companies) publicly report Overall People of Color Data. This highly generalized data is characterized by the disclosure of the number or share of workers identifying as People of Color (which companies more commonly refer to as “non-white” or “minority”), lumping together racial and ethnic groups that have different economic, social, and cultural experiences in the U.S.
Nearly 24% of our ranked universe (227 companies) share Detailed Racial/Ethnic Data. This disclosure type includes, at the bare minimum, a breakdown of the number or share of workers identifying as Asian, Black or African American, and Hispanic or Latino. Some companies categorized within this disclosure type also provide highly disaggregated data for different racial and ethnic groups—like American Indian or Alaska Native, Native Hawaiian or Pacific Islander, or Two or More Races—to more accurately capture representation.
Finally, almost 11% of our ranked universe (104 companies) disclose an EEO-1 Report or Intersectional Data, the most granular workforce demographic disclosure we track. Employers that have at least 100 employees are required to file, though not publicly release, an EEO-1 Report with the Equal Employment Opportunity Commission (EEOC) annually. Component 1 of this report asks companies to provide the number of employees by gender, racial, and ethnicity identity (a total of 14 intersectional groups) by 10 standardized job categories for a common payroll period. While these reports have their limitations, they also offer a highly standardized and comparable framework for racial and ethnic workforce data disclosure. Not every company, however, releases a full EEO-1 Report: 22 of the 104 companies released a modified or condensed version of an EEO-1 Report that either uses different units or omits select job categories.
When further examining the workforce race and ethnicity data disclosure type distribution by industry*, we find that a majority of companies in all but two broad industries—Basic Materials and Technology—report some type of workforce race and ethnicity data.
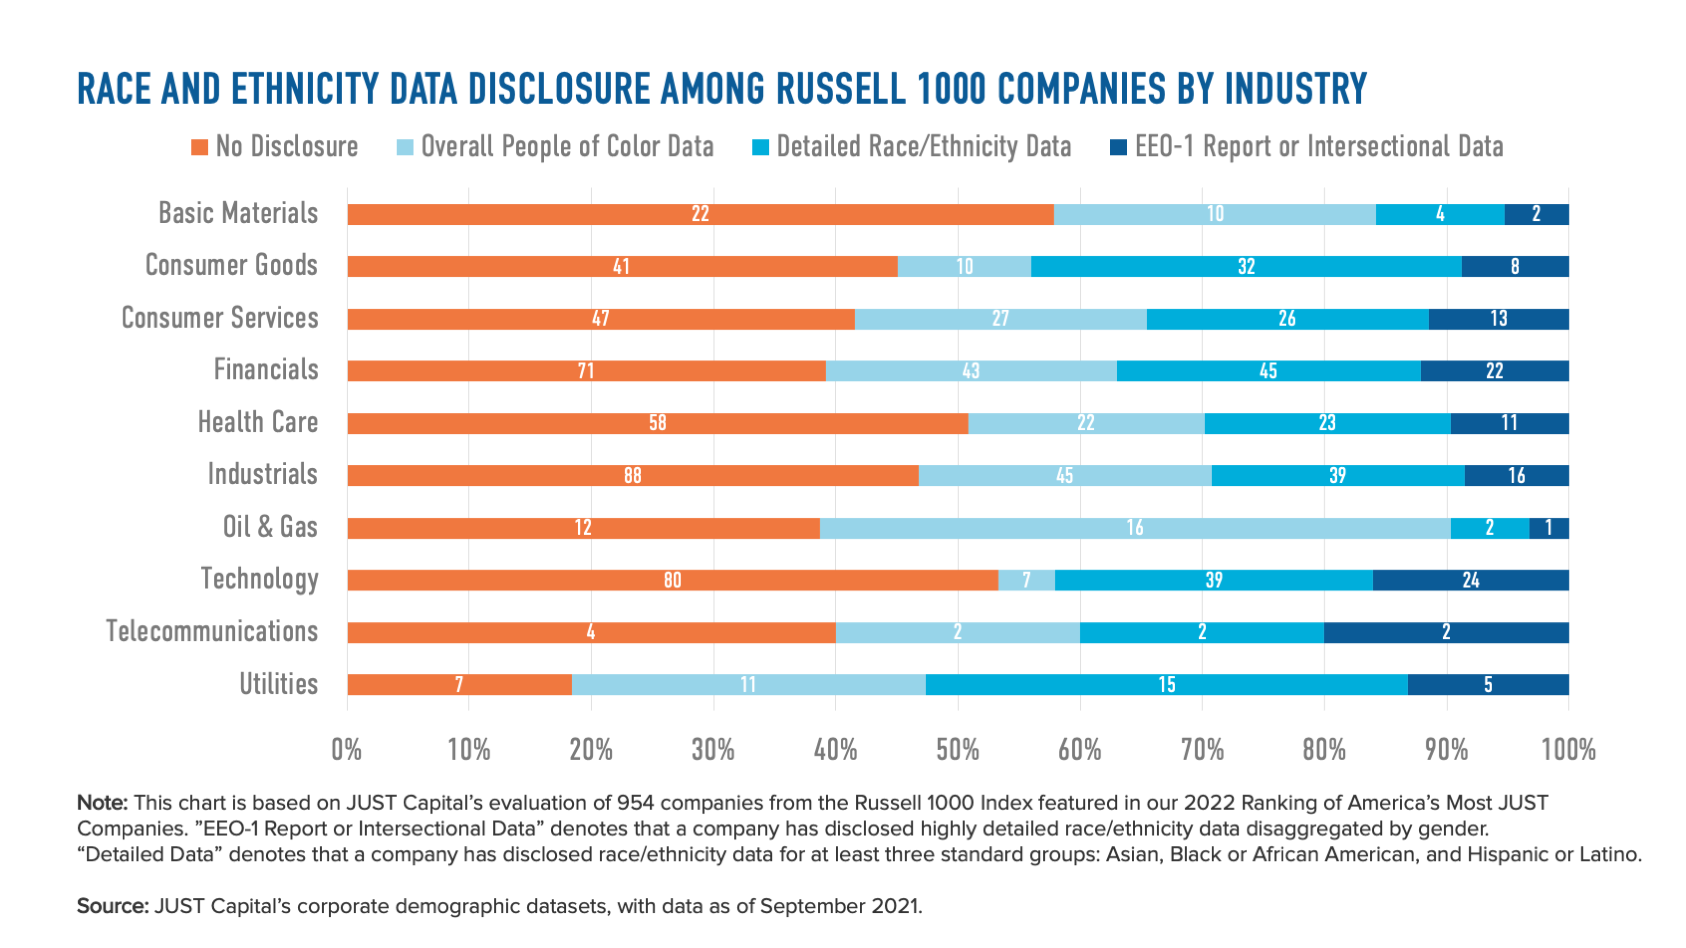
Companies in the Utilities industry are the most likely to disclose some racial and ethnic workforce data, with 82% (31 companies) in that industry sharing one of the three disclosure types. While there is no clear trend across industries for how each of the three disclosure types break down, it is interesting to note that companies in the Oil & Gas and Basic Materials industries appear to heavily favor disclosing Overall People of Color Data above more granular workforce race and ethnic data.
Changes in Racial and Ethnic Workforce Data Disclosure over Time
At face value, the current state of racial and ethnic workforce data indicates there is much room for improvement in both standardization and disclosure. But looking at this data over time tells an encouraging story.
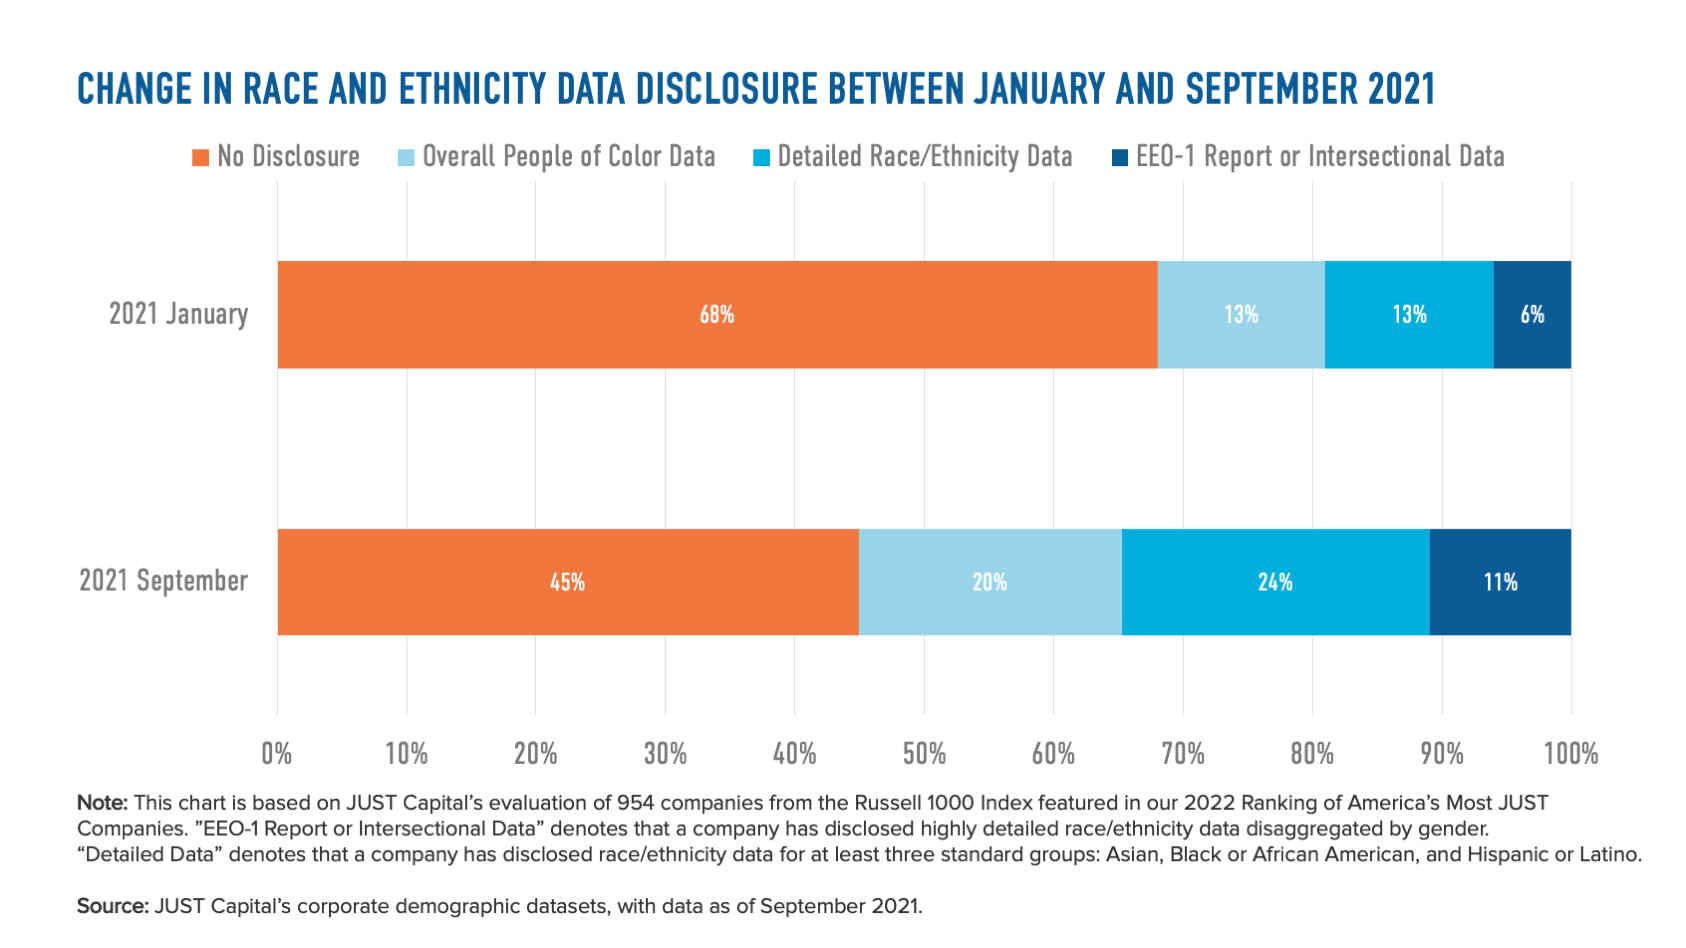
Since JUST Capital last ran this analysis, we have seen a flip in the data: In January 2021, only 32% of our ranked companies disclosed some type of racial and ethnic data and the majority of companies had no disclosure. Just nine months later, as of September 2021, 55% of companies (and therefore a majority) have some type of disclosure, amounting to a 23 percentage point increase in racial and ethnic workforce data disclosure rate.
Changes in EEO-1 Report or Intersectional Data Disclosure over Time
While corporate racial and ethnic data disclosure across all three disclosure categories has grown substantially, the increase in EEO-1 Report or Intersectional Data disclosure is of greatest interest. In two years, it went from an obscure term on the fringes of the Environment, Social, and Governance (ESG) space to the focus of racial equity advocacy efforts among the institutional investor community.
When we first began tracking EEO-1 Reports (or other intersectional data) in November 2019, just 32 companies in our ranked universe at the time disclosed this rich demographic data. Since then, we have seen a rapid rise in disclosure: In September 2021, 104 companies disclosed an EEO-1 Report or Intersectional Data, a 225% growth from our 2019 numbers.

Much of this growth has happened in the last year. Between September 2020 and September 2021, the disclosure rate grew from 4% to nearly 11%, or 7 percentage points. In just the last nine months, EEO-1 Report or Intersectional Data disclosure nearly doubled.

When decomposing the changes by industry, we find that companies in the Financials industries, which includes Banks, Capital Markets, Consumer & Diversified Finance, Insurance, and Real Estate, had the greatest increase in EEO-1 Report or Intersectional Data disclosure between January 2021 (nine companies) and September 2021 (22 companies), adding disclosures from 13 companies. While this is unsurprising given that companies in these industries were among the target audiences for disclosure advocacy efforts, it is interesting to note that nine companies report a modified version of an EEO-1 Report. These modified reports still feature intersectional data, but may include percentages instead of counts, or may condense or exclude job categories.
Companies in the Technology industries (including Computer Services, Internet, Semiconductors & Equipment, Software, and Technology Hardware), which have long been a leader in these disclosures, actually saw no change in the count of companies with an EEO-1 Report or Intersectional Data disclosure between January and September 2021. It is stagnant at 24 companies out of 150, as other industries continue to make strides.
The growth in disclosure we’ve seen among the Russell 1000 is encouraging. Key stakeholders, including the American public, have sent a clear message about the importance of demographic data transparency to companies—and they’re listening. For example, ahead of the release of our 2022 Rankings of America’s Most JUST Companies, we received over 1,500 comments from companies on their workforce demographic data, which made up more than a fifth of total comments we received for the data used in our Rankings. And that engagement correlates with increased transparency and disclosures: Of the companies that disclose the gold standard of EEO-1 or equivalent workforce demographics, 90% engaged with JUST. The pressure from investor pushes, like that from the New York City Comptroller and a number of shareholders during proxy season, has also paid off.
As the SEC gears up to develop new standards on disclosure, those companies that are sharing this data, especially those disclosing an already highly standardized EEO-1 Report, are leading the way. With these new standards in place, it will be easier to understand companies actual performance on diversity, leveraging comparable data about where companies’ workforce demographics stand in relation to each other, and the U.S. at large. The varied reporting methods we’re currently seeing from companies make this a confusing and difficult task.
Disclosing workforce and board demographics is an important step for companies to jumpstart or even refine their DEI initiatives. By doing so, they provide a baseline to track progress and a method to hold themselves accountable to improving diverse representation. And, as the rise in calls for transparency has shown, they’re elements stakeholders are increasingly looking for from corporate America.
Explore EEO-1 Report or Intersectional Data Disclosure
Use the table below to explore which companies from our 2022 Rankings of America’s Most JUST Companies have publicly reported their EEO-1 Report (or other highly detailed intersectional diversity data). Data featured in the table is as of September 2021.
| Company | Industry | Type of Disclosure | Date of Demographic Data | Link |
|---|---|---|---|---|
| 3M | Industrial Goods | Full EEO-1 Report | 2020 | Source |
| Abbott Labs | Health Care Equipment & Services | Full EEO-1 Report | 2020 | Source |
| AbbVie | Pharmaceuticals & Biotech | Full EEO-1 Report | 2020 | Source |
| Accenture | Commercial Support Services | Full EEO-1 Report | 2020 | Source |
| Adobe | Software | Full EEO-1 Report | 2020 | Source |
| AEP | Utilities | Full EEO-1 Report | 2019 | Source |
| Agilent Tech | Health Care Equipment & Services | Full EEO-1 Report | 2018 | Source |
| Allstate | Insurance | Full EEO-1 Report | 2020 | Source |
| Alphabet | Internet | Full EEO-1 Report | 2018 | Source |
| Altria | Food, Beverage & Tobacco | Full EEO-1 Report | 2020 | Source |
| AMD | Semiconductors & Equipment | Full EEO-1 Report | 2020 | Source |
| American Airlines | Transportation | Intersectional Data | 2020 | Source |
| American Tower | Real Estate | Full EEO-1 Report | 2020 | Source |
| Apple | Technology Hardware | Full EEO-1 Report | 2018 | Source |
| Applied Materials | Semiconductors & Equipment | Full EEO-1 Report | 2018 | Source |
| Aptiv | Automobiles & Parts | Full EEO-1 Report | 2020 | Source |
| AT&T | Telecommunications | Full EEO-1 Report | 2020 | Source |
| Bank of America | Banks | Intersectional Data | 2020 | Source |
| Biogen | Pharmaceuticals & Biotech | Full EEO-1 Report | 2020 | Source |
| BlackRock | Capital Markets | Full EEO-1 Report | 2020 | Source |
| BNY Mellon | Capital Markets | Full EEO-1 Report | 2020 | Source |
| Boston Scientific | Health Care Equipment & Services | Full EEO-1 Report | 2018 | Source |
| Capital One | Commercial Support Services | Intersectional Data | 2020 | Source |
| Cardinal Health | Pharmaceuticals & Biotech | Full EEO-1 Report | 2020 | Source |
| Carrier Global | Building Materials & Packaging | Full EEO-1 Report | 2020 | Source |
| Caterpillar | Commercial Vehicles & Machinery | Full EEO-1 Report | 2020 | Source |
| CBRE | Real Estate | Intersectional Data | 2020 | Source |
| Charles Schwab | Capital Markets | Full EEO-1 Report | 2019 | Source |
| Chevron | Oil & Gas | Full EEO-1 Report | 2020 | Source |
| Chipotle | Restaurants & Leisure | Intersectional Data | 2020 | Source |
| Cisco Systems | Technology Hardware | Full EEO-1 Report | 2018 | Source |
| Citigroup | Banks | Full EEO-1 Report | 2019 | Source |
| Citrix Systems | Software | Full EEO-1 Report | 2020 | Source |
| Coca-Cola | Food, Beverage & Tobacco | Full EEO-1 Report | 2018 | Source |
| Colgate-Palmolive | Personal Products | Full EEO-1 Report | 2018 | Source |
| Comerica | Banks | Full EEO-1 Report | 2020 | Source |
| Costco Wholesale | Retail | Full EEO-1 Report | 2018 | Source |
| CVS Health | Food & Drug Retailers | Full EEO-1 Report | 2018 | Source |
| Digital Realty | Real Estate | Full EEO-1 Report | 2020 | Source |
| Dominion Energy | Utilities | Intersectional Data | 2020 | Source |
| Dow | Chemicals | Full EEO-1 Report | 2019 | Source |
| Duke Energy | Utilities | Full EEO-1 Report | 2020 | Source |
| eBay | Retail | Full EEO-1 Report | 2018 | Source |
| Eli Lilly | Pharmaceuticals & Biotech | Full EEO-1 Report | 2020 | Source |
| Essential Utilities | Utilities | Intersectional Data | 2020 | Source |
| Exelon | Utilities | Full EEO-1 Report | 2020 | Source |
| F5 Networks | Computer Services | Full EEO-1 Report | 2017 | Source |
| Ford Motor | Automobiles & Parts | Full EEO-1 Report | 2020 | Source |
| General Motors | Automobiles & Parts | Intersectional Data | 2020 | Source |
| Gilead Sciences | Pharmaceuticals & Biotech | Full EEO-1 Report | 2020 | Source |
| GoDaddy.com | Internet | Intersectional Data | 2020 | Source |
| Goldman Sachs | Capital Markets | Full EEO-1 Report | 2020 | Source |
| Hartford Financia | Insurance | Full EEO-1 Report | 2020 | Source |
| Hilton Worldwide | Restaurants & Leisure | Intersectional Data | 2020 | Source |
| Hologic | Health Care Equipment & Services | Full EEO-1 Report | 2018 | Source |
| HPE | Computer Services | Full EEO-1 Report | 2018 | Source |
| Huntington Banc | Banks | Intersectional Data | 2019 | Source |
| ICE | Capital Markets | Full EEO-1 Report | 2018 | Source |
| Illumina | Pharmaceuticals & Biotech | Intersectional Data | 2020 | Source |
| Intel | Semiconductors & Equipment | Full EEO-1 Component 2 | 2019 | Source |
| Juniper Networks | Technology Hardware | Full EEO-1 Report | 2018 | Source |
| Landstar System | Transportation | Full EEO-1 Report | 2018 | Source |
| Las Vegas Sands | Restaurants & Leisure | Intersectional Data | 2019 | Source |
| Lowe’s | Retail | Full EEO-1 Report | 2020 | Source |
| Lyft | Retail | Full EEO-1 Report | 2017 | Source |
| LyondellBasell | Chemicals | Full EEO-1 Report | 2018 | Source |
| Mastercard | Commercial Support Services | Full EEO-1 Report | 2019 | Source |
| McDonald’s | Restaurants & Leisure | Full EEO-1 Report | 2018 | Source |
| MDU Resources | Building Materials & Packaging | Full EEO-1 Report | 2018 | Source |
| Merck | Pharmaceuticals & Biotech | Full EEO-1 Report | 2020 | Source |
| Meta Platforms | Internet | Full EEO-1 Report | 2018 | Source |
| MetLife | Insurance | Full EEO-1 Report | 2020 | Source |
| Microsoft | Software | Full EEO-1 Report | 2018 | Source |
| Morgan Stanley | Capital Markets | Intersectional Data | 2018 | Source |
| Netflix | Media | Full EEO-1 Report | 2018 | Source |
| Norfolk Southern | Transportation | Full EEO-1 Report | 2020 | Source |
| NVIDIA | Semiconductors & Equipment | Full EEO-1 Report | 2020 | Source |
| Oracle | Software | Full EEO-1 Report | 2020 | Source |
| Owens Corning | Building Materials & Packaging | Intersectional Data | 2020 | Source |
| Palo Alto Networks | Software | Full EEO-1 Report | 2018 | Source |
| PayPal | Commercial Support Services | Full EEO-1 Report | 2018 | Source |
| PCA | Building Materials & Packaging | Full EEO-1 Report | 2020 | Source |
| PepsiCo | Food, Beverage & Tobacco | Full EEO-1 Report | 2020 | Source |
| Internet | Full EEO-1 Report | 2018 | Source | |
| Procter & Gamble | Personal Products | Full EEO-1 Report | 2018 | Source |
| Prudential | Insurance | Intersectional Data | 2020 | Source |
| S&P Global | Consumer & Diversified Finance | Full EEO-1 Report | 2020 | Source |
| Salesforce | Software | Intersectional Data | 2020 | Source |
| ServiceNow | Software | Full EEO-1 Report | 2018 | Source |
| Splunk | Software | Full EEO-1 Report | 2018 | Source |
| Starbucks | Restaurants & Leisure | Full EEO-1 Report | 2018 | Source |
| State Street | Capital Markets | Intersectional Data | 2020 | Source |
| T. Rowe Price | Capital Markets | Intersectional Data | 2019 | Source |
| Target | Retail | Full EEO-1 Report | 2019 | Source |
| Teradata | Computer Services | Full EEO-1 Report | 2018 | Source |
| Truist Financial | Banks | Intersectional Data | 2020 | Source |
| Uber Technologies | Retail | Intersectional Data | 2021 | Source |
| UPS | Transportation | Full EEO-1 Report | 2020 | Source |
| Verizon | Telecommunications | Full EEO-1 Report | 2018 | Source |
| Visa | Commercial Support Services | Full EEO-1 Report | 2020 | Source |
| VMware | Software | Full EEO-1 Report | 2018 | Source |
| Wells Fargo | Banks | Intersectional Data | 2020 | Source |
| Xylem | Industrial Goods | Full EEO-1 Report | 2018 | Source |
| Zendesk | Software | Full EEO-1 Report | 2018 | Source |
Methodological Notes:
For ease of presentation, we have consolidated the 33 JUST Industries (derived from the Industry Classification Benchmark maintained by FTSE Russell) into 10 broad industries.
Each year, the constitution of the Russell 1000 (maintained by FTSE Russell) changes and further adjustments are made due to merger and acquisition activity over the course of the year. For this reason, year-over-year disclosure rate comparisons have a slightly different universe of companies.
