 Print
PrintMerel Spierings is a Researcher at The Conference Board ESG Center. This post is based on her recent publication, which was released by The Conference Board and ESG analytics firm ESGAUGE, in collaboration with Debevoise & Plimpton, the KPMG Board Leadership Center, Russell Reynolds Associates, and The John L. Weinberg Center for Corporate Governance at the University of Delaware.
Related research from the Program on Corporate Governance includes Politics and Gender in the Executive Suite by Alma Cohen, Moshe Hazan, and David Weiss (discussed on the Forum here); Will Nasdaq’s Diversity Rules Harm Investors? by Jesse M. Fried (discussed on the Forum here); and Duty and Diversity by Chris Brummer and Leo E. Strine, Jr. (discussed on the Forum here).
Investor and regulator focus on board composition and practices has evolved significantly over the past 20 years. In the wake of the Enron and WorldCom collapses, these stakeholders initially focused on strengthening board independence and oversight. [1] After the financial crisis of 2008, that gave way to a greater focus on whether boards have the right mix of skills and experience to guide business strategy—as well as mechanisms for shareholders to hold boards accountable for business performance. [2] More recently, the focus on board diversity has not only accelerated, but also expanded to the broader question of how boards are overseeing environmental, social, and governance (ESG) matters. For example, in early 2022, investors raised the bar for board diversity, [3] and the US Securities and Exchange Commission (SEC) proposed rules seeking greater disclosure of the board’s role in climate change and cybersecurity, with rules on human capital management to come.
These trends have significant implications for board composition, size, and education. Companies need boards with directors who have a diversity of backgrounds, as well as the skills and experience to oversee the expanding list of priorities. They also need boards of sufficient size to accommodate these individuals, as well as to populate the (new) board committees that address ESG topics. And they need to have more robust onboarding programs for these new directors, as well as ongoing board education programs to ensure the entire board is not relying on the expertise of a few directors but is fluent in the growing list of issues that boards are expected to oversee.
This post provides insights relating to board composition (including gender, race, and sexual orientation diversity, director qualifications and skills), size, and education at S&P 500 and Russell 3000 companies. Our findings are based on data derived from our live, interactive online dashboard powered by ESGAUGE, [5] as well as a Chatham House Rule discussion with leading governance professionals held in April 2022.
Insights for What’s Ahead
- Although boards may want to add functional experience in ESG areas, such as technology, cybersecurity, human capital, and climate, directors can bring meaningful value only if they can make the connection between these functional areas and business strategy. The recent decline in the reported percentage of board members with business strategy experience is worrisome, as board members without broad strategic experience can hinder effective board discussions and will likely be less useful partners for management. Boards should not sacrifice business strategy experience to achieve functional expertise.
- While boards are becoming more gender diverse, many companies will need to further increase their efforts to meet investors’ future demands, which include having a board that is at least 30 percent gender diverse instead of merely having one or two female directors. This means, for example, that a board with nine directors will need at least three women.
- Companies should also anticipate a greater push on racial (ethnic) diversity, which will increasingly spill over into director elections, as investors and proxy advisors alike have started setting targets for the racial composition of boards and will (advise to) vote against directors if those targets are not being met.
- Disclosure on other personal and less visible traits, such as sexual orientation, needs to be carried out with sensitivity to the directors’ individual and collective views. Before adding new questions about personal traits, it’s important to have a conversation with board members about what additional topics should be covered and why. It’s also helpful to discuss whether the company should disclose these characteristics on an individual or aggregate basis.
- While companies have traditionally focused on recruiting directors with “hard skills,” boards need to keep an eye on “soft skills” when vetting new directors. Recent events have made it clear that even though traditional skills and expertise are pivotal, other competencies should be taken into account as well when recruiting new directors, including crisis management, the ability to listen, eagerness to learn, and openness to change.
- Expect boards to increase modestly in size as companies seek to add diversity, new skills and expertise, and board committees providing ESG oversight. This increase is likely to be permanent as a result of the pressure to recruit directors with additional expertise relating to cybersecurity and climate change (proposed SEC rules will require more disclosure on the role of the board and its expertise in these two areas), as well as the need to keep the workload for directors manageable.
- Given the need to ensure directors are able to effectively oversee a growing number of ESG areas, companies will want to adopt a hybrid approach of using internal and external resources for director education. It’s vital for outside providers to offer trusted and objective information, benchmarking, and advice. And as management may also benefit from additional education, companies should consider outside firms that are adept at educating both the C-suite and boards—although the breadth and depth of education for management may be greater.
Board Composition
Independent Director Qualifications and Skills
- Even though business strategy continues to be the most commonly cited experience for directors, the reported percentage of board members with such experience has been declining. In the S&P 500, the share of directors with such experience—as reported in the proxy statement or other disclosure documents—declined from 69.7 percent in 2018 to 67.5 percent in 2021. The Russell 3000 saw a larger decrease, from 67.7 percent in 2018 to 62.9 percent in 2021. This suggests that boards may be attracting directors with knowledge in specific areas (e.g., cybersecurity) who do not have broad business strategy experience.
- The decline in strategic experience has been accompanied by a decline in international experience on boards as well—even as the world has become more interconnected. In the S&P 500, it went from 19.6 percent in 2018 down to 14.4 percent in 2021, and in the Russell 3000, it declined from 10 to 8.1 percent.
- By contrast, experience in business operations, finance, and technology in the S&P increased in recent years. Experience in business operations grew from 5.7 percent in 2018 to 11.9 percent in 2021 and in finance from 19.7 percent in 2018 to 22.2 percent in 2021. The percentage of directors with technology experience is also increasing: from 22.1 percent in 2020, to 22.6 percent in 2021, and to 23.9 percent in 2022 (following a decline from 2018 to 2020).
Director Qualifications and Skills (S&P 500)
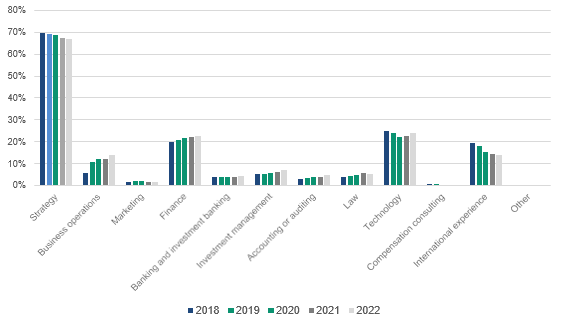
Source: The Conference Board/ESGAUGE, 2022
- Directors with strategic experience are more sought after in larger companies than in smaller companies; the opposite is true for directors with a background in investment management. In 2021, 74 percent of directors at the largest companies, with an annual revenue of $50 billion and over, had business strategy experience, but the percentage dropped to 63.7 percent for the smallest companies, with an annual revenue under $100 million. Conversely, investment management experience was the most prevalent at the smallest companies (12.1 percent versus 3.2 percent at the largest companies). This may reflect the view at large companies that they can obtain such experience by hiring outside advisors, while smaller companies have fewer resources to do so.
- Technology experience seems to be desired at all but the smallest companies. Whereas the average percentage of directors with a technology background ranged between 19 percent (for companies with an annual revenue of $100-999 million) and 25.8 percent (for the largest companies), only 6.7 percent of directors in companies with an annual revenue of under $100 million reported having such experience.
- In 2021, information technology companies had by far the highest percentage of board members who report a technology background in their professional profile (40.6 percent of all Russell 3000 directors at entities in the sector), followed by communication services (21.7 percent), and utilities (19.6 percent) companies. Firms in the materials, consumer staples, and industrials sectors had the highest percentages of directors with experience at the international level (15.7, 15.1, and 11.1 percent, respectively); conversely, only 4.7 percent of independent directors in the financial sector reported an international background. The highest shares of directors with legal experience were found on boards of financial institutions (12.7 percent), real estate companies (11.9 percent), and utilities (11.8 percent). The financial sector also leads with the highest representation of directors with accounting or auditing experience (11.4 percent, compared to only 4.2 percent of directors at health care companies).
Director Gender
- The share of female directors on US boards continues to grow—a trend spurred in part by investors’ growing demands and the SEC’s approval of Nasdaq’s Board Diversity Listing Standards. [5] In the S&P 500, the share of female directors grew from 22.8 percent in 2018 to 28.9 percent in 2021. And preliminary data from 2022 indicate this trend will continue: as of April, 30 percent of directors were women. [6] The share of female directors in the Russell 3000 continues to be lower than in the S&P 500, at 24.1 percent in 2021, but it is up from 16.6 percent in 2018.
Director Gender, by Index
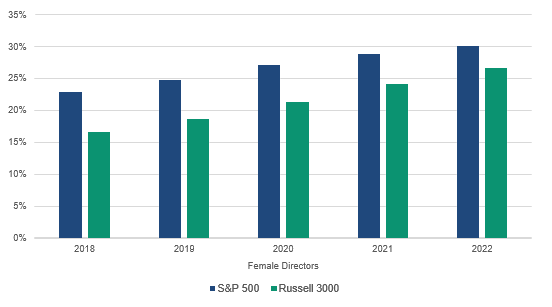
Source: The Conference Board/ESGAUGE, 2022
- Similarly, the number of companies with an all-male board in the S&P 500 was near zero in 2021 (averaging 0.2 percent), compared to 1.4 percent in 2018. In the Russell 3000, 5.1 percent of companies reported having no female representation in 2021, but representation was dramatically lower in 2018, when 20.5 percent disclosed having all-male boards.
- There is a direct correlation between company size and gender diversity in the boardroom, with the highest percentage of female directors concentrated among boards of larger companies: in 2021, 30.8 percent of directors at companies with annual revenue of $50 billion or higher were women, compared to 19.5 percent of those in companies with annual revenue of $100 million or lower.
- Companies in the utilities (29.6 percent), consumer staples (28.7 percent), and consumer discretionary (27.7 percent) sectors have the highest percentage of female directors in the Russell 3000. Boards of nonutility energy firms are the most male dominated, with only 19.8 percent being women, and almost half (48.3 percent) of such companies have no or only one female director on the board.
Director Race/Ethnicity
- Disclosure of director race/ethnicity surged in 2021—and an early analysis indicates that even more companies are planning to disclose this type of information in 2022. In the S&P 500, a majority of companies now disclose race/ethnicity: 58.8 percent in 2021, up from 11.4 percent in 2018. As of April 2022, this percentage has gone up even further, to 73.3 percent. The Russell 3000 has also seen increased disclosure, from 3.8 percent in 2018 to 27.7 percent in 2021 to 45.1 percent currently in 2022.
Director Race/Ethnicity – Disclosure Rate, by Index
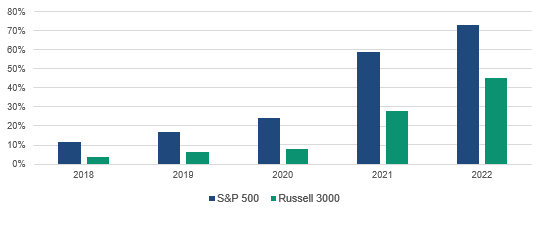
Source: The Conference Board/ESGAUGE, 2022
- There are vast disparities between large and small companies in disclosing racial/ethnic diversity: in 2021, 70.9 percent of companies with an annual revenue of $50 billion and over disclosed director race/ethnicity, compared to only 8 percent of companies with an annual revenue under $100 million.
- Across business sectors in the Russell 3000, disclosure of director race/ ethnicity was most common at companies in the utilities sector (52.9 percent), followed by those in materials (42.1 percent), and consumer staples (38.2 percent). Health care companies were least likely to disclose this information (17.5 percent).
- The number of non-White directors is steadily increasing—at least at larger companies. In 2021, 76.7 percent of directors in the S&P 500 were White, which is roughly on par with the percentage of the US population between 50 and 70 years old and down from 80.1 percent of directors in 2018; 12.6 percent were African American (up from 11.3 percent in 2018); and 5.1 percent were Asian, Native Hawaiian, or Pacific Islander (up from 1.8 percent in 2018). Conversely, the percentage of Latino or Hispanic directors went down, from 6.6 percent in 2018 to 5.1 percent in 2021. [7]
-
- Interestingly, the share of White directors in the Russell 3000 ticked up from 78.1 percent in 2018 to 79 percent in 2021—and even further up to 80 percent as of April. Moreover, the percentage of African American and Latino or Hispanic directors went down in 2021 compared to 2018, but the share of Asian, Native Hawaiian, or Pacific Islander directors went up.
Director Race/Ethnicity (S&P 500)
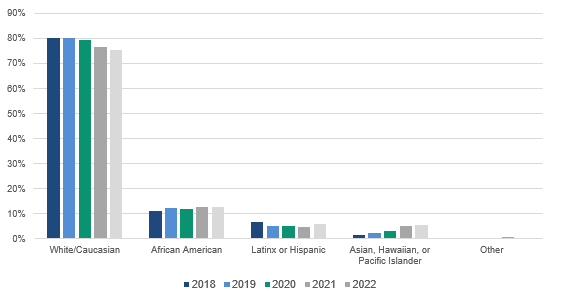
Source: The Conference Board/ESGAUGE, 2022
- Larger companies’ boards continue to be more racially/ethnically diverse than those of their smaller counterparts. In 2021, 25.7 percent of directors at companies with annual revenue of $50 billion or higher were non-White, compared to 20.6 percent of directors at companies with annual revenue under $100 million.
- In the Russell 3000 in 2021, companies in the IT sector (26.2 percent) had the most racially/ethnically diverse boards, followed by those in the utilities sector (24.6 percent). Boards of nonutility energy companies (14.3 percent) were the least diverse.
Director Sexual Orientation
- Disclosure of directors’ sexual orientation remained low in 2021 but seems to be increasing in 2022. In 2021, 6.6 percent of S&P 500 companies disclosed their directors’ sexual orientation, compared to 3.5 percent in the Russell 3000. However, as of April 2022, this percentage has gone up dramatically in both indexes, to 22.7 percent in the S&P 500 and 25.4 percent in the Russell 3000. [8]
Direct Sexual Orientation – Disclosure Rate, by Index
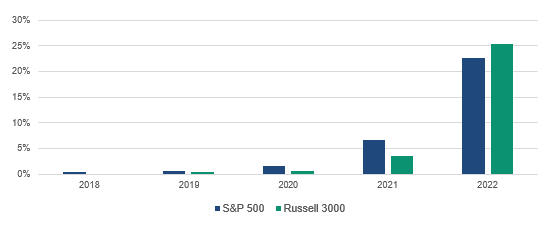
Source: The Conference Board/ESGAUGE, 2022
- Not all boards that are now disclosing director sexual orientation actually have directors who are—or are willing to identify for purposes of corporate public disclosure document as—LGBTQ+. As disclosure of directors’ sexual orientation increases even for those who are not LGBTQ+, the percentage of corporate directors who are LGBTQ+ decreases, from 6.7 percent in 2021 to 3.9 percent thus far in 2022 in the S&P 500, and from 7.1 percent in 2021 to 2.2 percent in 2022 in the Russell 3000.
- Unlike gender and race, there is no apparent correlation between disclosure rates of sexual orientation and company size. In 2021, directors’ sexual orientation was disclosed by 0.9 percent of companies with revenue under $100 million and 9.6 percent in the $25-49.9 billion group, but by none of the companies with revenues of $50 billion or higher.
- There is also no clear correlation between director self-identification of sexual orientation and company size. However, in 2021, the highest percentage of directors who self-identify as LGBTQ+ was seen among the smallest companies: 20 percent of directors at companies with an annual revenue under $100 million self-identified as LGBTQ+ versus no directors at companies with an annual revenue of $50 billion or higher. This may reflect the fact that directors at smaller companies believe that they can have a bigger impact on the firm and its culture by such disclosure. [9]
Insights for What’s Ahead in Board Composition
- The decline in directors with business strategy experience should raise a yellow, if not red, flag for boards, management, and investors: boards should not sacrifice business strategy experience to achieve functional expertise. While boards understandably want to add functional experience in technology, cybersecurity, human capital, climate, and other areas, directors will bring meaningful value only if they can make the connection between these functional areas and business strategy. Indeed, that is equally true of C-suite executives, which is why directors without broad strategic experience can actually be a drag on board deliberations and be ineffective partners for management. This is especially true as ESG topics are no longer siloed but are being integrated into board strategy.
- Although boards are becoming more gender diverse, many companies will need to further ramp up their efforts to meet investors’ future demands. Some major institutional investors and proxy advisors (e.g., State Street Global Advisors and Glass Lewis) are moving away from static gender diversity targets (i.e., a minimum of one or two female directors) and have pledged to vote against the nominating committee chairs of boards that are not at least 30 percent gender diverse, starting in 2023. To illustrate the challenge this presents: in the Russell 3000, the average board size was 9.2 in 2021, and almost 60 percent of companies had nine or more directors on board. Yet only 37.1 percent of companies had three or more female directors and would meet the 30 percent threshold.
- Companies should also anticipate a greater push on racial/ethnic diversity, which will increasingly spill over into director elections. Disclosure of director race/ethnicity surged in 2021, but disclosure alone won’t be enough: investors and proxy advisors alike have begun setting targets for the racial makeup of boards and will (advise to) vote against directors, particularly of the nominating and governance committee, if those targets are not met. Companies, especially the smaller ones and those in the nonutility energy sector, will want to augment the racial/ethnic diversity of their board by executing a succession plan where the focus on strategic skills and expertise is accompanied by the pursuit of racially diverse board members.
- Disclosure on sexual orientation, and other personal and less visible traits, needs to be undertaken with sensitivity to the directors’ individual and collective views. Companies typically collect information about board characteristics through an annual Directors & Officers (D&O) questionnaire. Before adding new questions about board diversity, it’s important to have a conversation with the nominating committee (and through the committee, with the board), about what additional topics you might cover and why. At some companies, for example, directors may want the company to make a statement about LGBTQ+ inclusion at the board level; at other companies, directors may be hesitant to do so or may personally want to opt out of answering the question. It’s also helpful to discuss how the company could disclose these traits, including on an individual or aggregate basis.
- Even though companies have traditionally focused on recruiting directors with “hard skills,” boards need to keep an eye on “soft skills” in recruiting new directors. From the COVID-19 pandemic to social and economic disruptions to supply chain disturbances, staggering inflation, labor shortages, and now the war in Ukraine—corporate America has been faced with crisis after crisis. Even though traditional skills and expertise (e.g., in business strategy, finance, technology, operations) are still important, boards need to give full attention to other competencies as well when vetting new directors, including crisis management, the ability to listen, eagerness to learn, and openness to change. [10]
Board Size
- The average board size of S&P 500 companies has been relatively steady in recent years. Yet preliminary data from 2022 indicate that it is increasing, from an average of 10.8 directors in the past four years to an average of 11.2 directors as of April. Additionally, in 2022, the number of companies with more than 10 directors increased compared to previous years, from 73.9 percent in 2018 to 82.4 percent in 2022.
- The increase in board size holds true for smaller companies as well: in the Russell 3000, the average board size increased from nine directors in 2018 to 9.8 directors in 2022 (as of April). Similarly, the number of companies with more than 10 directors increased from 37.8 percent in 2018 to 51.4 percent in 2022.
- Larger companies tend to have larger boards. In 2021, manufacturing and nonfinancial services companies with an annual revenue of $50 billion or over had an average board size of 11 directors, with 81.8 percent having 10 or more directors, and 18.2 percent with 13 or more directors. By comparison, companies with an annual revenue under $100 million had an average board size of 7.5, with just 8.9 percent reporting 10 or more directors, and none reporting more than 12. Likewise, the smallest boards, with fewer than six directors, are seen almost exclusively among small companies. Indeed, at companies with a revenue under $100 million, 12.8 percent have fewer than six directors. By comparison, no boards with fewer than six directors are found at companies with an annual revenue of $50 billion or higher.
Board Size, by Index
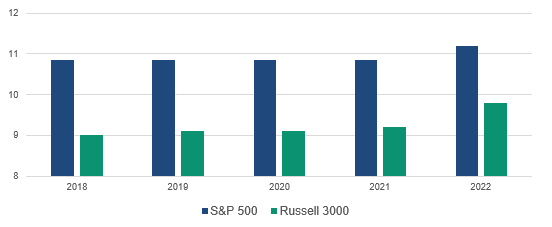
Source: The Conference Board/ESGAUGE, 2022
- Across business sectors in the Russell 3000, financial services companies had the largest boards in 2021, with an average of 10.7 directors, followed by those in utilities (average of 10.5 directors). These sectors also reported the biggest shares of boards with 10 or more directors (70.6 percent for utilities and 63.4 percent for financial services). The smallest boards were found in the health care sector, where the average board size was 8.3 directors and only 23.8 percent of companies reported having a board of 10 directors or more. One driver of board size may be the way these industries are regulated. For example, the Dodd-Frank Act requires a separate risk committee composed of independent directors for publicly traded nonbank financial companies supervised by the Federal Reserve as well as publicly traded bank holding companies with $10 billion or more in assets. Similarly, those in the utilities sector are far more likely than other companies to have a finance committee (41 percent versus 10 percent).
Insights for What’s Ahead in Board Size
- Expect boards to continue to increase in size as companies seek to increase diversity, add new skills and expertise, and populate new board committees providing ESG oversight. As companies are seeking to increase diversity on their boards, they cannot wait until a retirement creates an opening to add a new director because the attractive candidates may have other offers before then. Instead, they need to strike while the iron is hot, which means at least temporarily increasing the size of the board to allow for some overlap. That temporary increase, however, is likely to become permanent due to two factors: (1) the pressure to add directors with additional expertise will continue, particularly with the proposed SEC rules requiring additional disclosure on the role of the board and its expertise relating to cybersecurity and climate change; and (2) workload: while some boards are adding ESG and other responsibilities to existing committees, other boards are establishing new committees. In either case, boards need to be careful not to stretch their existing directors too thin by having them serve on too many committees. [11]
Director Education
- Companies are increasingly using both in-house and outside resources to educate their directors. Relying exclusively on in-house resources remains the predominant practice. In 2021, 67.5 percent of companies in the S&P 500 relied solely on in-house education programs and 64.8 percent in the Russell 3000 did so. Yet the practice of using a combination of in-house and outside resources to develop and deliver educational programs has been increasing in both indexes in recent years. In the S&P 500, the percentage of companies taking this approach grew from 25.3 percent in 2018 to 29.1 percent in 2021. In the Russell 3000, the share grew from 11.8 percent in 2018 to 16.4 percent in 2021. The use of combined in-house and outside resources is especially common at the largest firms: 40 percent of companies with a revenue of $50 billion and over reported taking this approach, versus only 6.1 percent of companies with revenues under $100 million. Across the Russell 3000, companies in the real estate sector are most likely to organize programs entirely in-house (76.5 percent), those in the energy sector are most likely to use just outside providers (2.6 percent), and companies in the utilities sector are most likely to use a combination (30.9 percent).
Director Education (S&P 500)
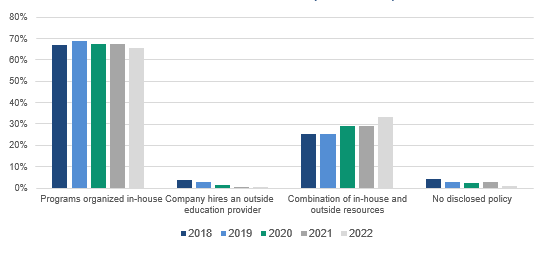
Source: The Conference Board/ESGAUGE, 2022
- Most of the firms not disclosing policies on continuing education are smaller companies with revenues under $100 million: 44.3 percent of them did not disclose information on their professional development programs for directors in 2021, while only 1.8 percent of companies with revenues of $50 billion and over, and none of the firms with revenues in the $25 billion-$49.9 billion category, lack a disclosed policy.
- In the Russell 3000, companies in the health care and financial services sectors report the highest percentages of firms without a disclosed policy on director continuing education (31.4 percent and 24.2 percent, respectively). The lowest are materials (4 percent) and real estate (6 percent).
Insights for What’s Ahead in Director Education
- Given the need to ensure directors are able to effectively oversee a growing number of ESG subject areas, and senior management itself may also need to be brought up to speed, more companies will likely adopt a hybrid approach of using internal and external resources for director education. While it can be useful for directors to meet with advocacy organizations in other contexts, for board education programs it’s critical for outside providers to provide trusted and objective information, benchmarking, and advice. Especially as management may also benefit from additional education, companies should consider firms that are adept at educating both the C-suite and boards.
Endnotes
1See H.R.3763 – Sarbanes-Oxley Act of 2002 (July 2002) and SEC’s adoption of NASD and NYSE’s Rulemaking Relating to Corporate Governance (November 2003).(go back)
2See H.R.4173 – Dodd-Frank Wall Street Reform and Consumer Protection Act (July 2010) and the SEC’s Final Rule on Facilitating Shareholder Director Nominations (“Proxy Access Rule”) (August 2010).(go back)
3Merel Spierings and Paul Washington, 2022 Proxy Season Preview and Shareholder Voting Trends, Brief 2: Human Capital Management Proposals, The Conference Board, February 2022.(go back)
4The Conference Board, in collaboration with ESG data analytics firm ESGAUGE, is keeping track of disclosures made by US public companies with respect to their board composition, director demographics, and governance practices. Our live, interactive online dashboard allows you to access and visualize practices and trends from 2016 to date by market index, business sector, and company size. The dashboard is organized in six parts: (1) Board Organization, (2) Board Leadership, (3) Board Composition, (4) New Directors, (5) Director Election & Removal, and (6) Other Board Policies.(go back)
5On August 6, 2021, the SEC approved Nasdaq’s Board Diversity Rule, which requires board diversity disclosures for Nasdaq-listed companies. Additionally, investors continue to make their proxy voting guidelines relating to board diversity more stringent. The pressures for increased diversity are continuing, even though California’s board gender diversity quota law has been initially ruled unconstitutional.(go back)
6Throughout this post, the data for 2022 is as of April 19, 2022.(go back)
7To put these numbers in perspective, according to the US Census Bureau, 76.3 percent of the US population is White (population estimates from July 2021). The older the population, the higher this percentage: 69 percent of 40-year-olds, 74 percent of 50-year-olds, 78 percent of 60-year-olds, and 83 percent of 70- and 80-year-olds were White in 2017, according to data derived from the American Community Survey (source: Overflow Solutions). By comparison, in 2021, the average director age was 63 years in the S&P 500 and 62 years in the Russell 3000.(go back)
8This increase may be due to Nasdaq’s Board Diversity Rule, which requires companies to explain why they do not have at least one director who identifies as female and one who identifies as LGBTQ+ or another underrepresented group. Similarly, BlackRock now encourages companies to have at least one director who identifies as a member of an underrepresented group, which includes individuals who identify as LGBTQ+.(go back)
9Nasdaq’s Board Diversity Rule may have had an impact here as well, as Nasdaq tends to have companies with smaller average market capitalization than the NYSE. Having said that, Nasdaq permits the smallest companies some flexibility in satisfying the threshold with two female directors(go back)
10Lindsay Beltzer and Paul Washington, Crisis Management in the Era of “No Normal,” The Conference Board, September 2021.(go back)
11If a board has four committees with five members each, it will have 20 slots to fill. That requires at least 10 independent directors if each serves on two committees. Given that committee chairs often serve on only one committee, that suggests a board with 12 independent directors.(go back)
