 Print
PrintCarey Oven is National Managing Partner at the Center for Board Effectiveness and Chief Talent Officer, Caroline Schoenecker is an Experience Director at Deloitte & Touche LLP and Cid Wilson is the President and CEO of the Hispanic Association on Corporate Responsibility. This post is based on a report from the Alliance for Board Diversity in Collaboration with Deloitte by Ms. Oven, Ms. Schoenecker, Mr. Wilson, Linda Akutagawa, Lorraine Hariton, and Michael Hyter. Related research from the Program on Corporate Governance includes Politics and Gender in the Executive Suite (discussed on the Forum here) by Alma Cohen, Moshe Hazan, and David Weiss; Will Nasdaq’s Diversity Rules Harm Investors? (discussed on the Forum here) by Jesse M. Fried; and Duty and Diversity (discussed on the Forum here) by Chris Brummer and Leo E. Strine, Jr.
Executive summary and key findings
At the risk of oversimplifying things, the data for the 7th edition of the Missing Pieces report shows a persistent theme that might be best characterized as: uneven progress. On the one hand, women and underrepresented racial and ethnic groups (UR&EG) hold 46.5% of Fortune 100c and 44.7% of Fortune 500 board seats—the highest ever. However, women from underrepresented racial and ethnic groups hold only 7.8% of board seats across Fortune 500 companies. This is an increase from 2020, when women from underrepresented racial and ethnic groups held 5.7% of board seats.
Another way to assess progress is whether levels of boardroom representation reflect the demographic composition of the nation. At a high level, the analysis suggests there is still much work to be done in this area. For example, individuals from underrepresented racial and ethnic groups hold 22.2% of board seats across Fortune 500 companies. This is certainly an improvement from 2020, when the proportion of UR&EG board members was 17.5%. However, United States census data shows 40.6% of the nation’s population is from underrepresented racial and ethnic groups. At the current pace, it would take the boards of Fortune 500 companies more than two decades for board representation to match the current level of representation of individuals from underrepresented racial and ethnic groups in the population.
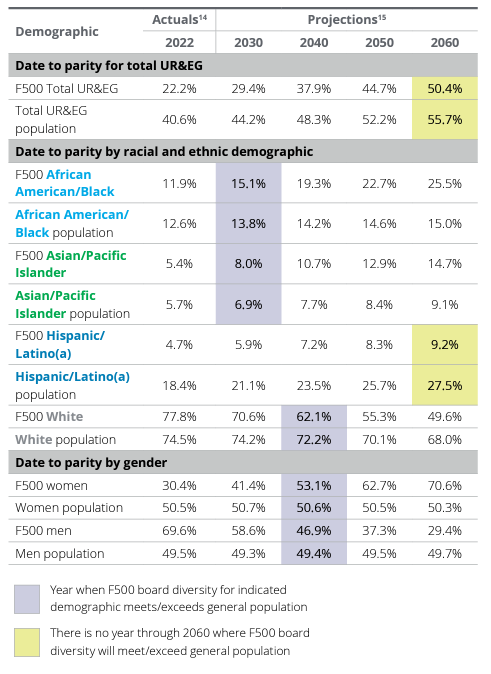
Of course, as time passes, underrepresented racial and ethnic groups will continue to be a larger share of the broader population. Based on the Census Bureau’s population projection figures, there is no period where the total proportion of board seats held in the Fortune 500 by individuals from underrepresented racial and ethnic groups reaches population parity through at least 2060. [1] As the table to the right indicates, some individual UR&EG populations will see parity at current rates—though the date of parity varies greatly.
Since the last edition of the Missing Pieces report, many Fortune 100 companies made notable advancements in terms of increasing levels of representation of both women and individuals from underrepresented racial and ethnic groups. If we broaden the lens to the larger subset of companies in the Fortune 500, overall levels of representation are slightly lower. But while the level of representation in the Fortune 100 is somewhat higher, the rate of change is much slower. To put these findings into context, a recent study [4] of the Russell 3000 suggests markedly lower levels of both racial and gender diversity.
The 2022 Fortune 100 data shows some advancement, with the combined representation of women and individuals from underrepresented racial and ethnic groups reaching a high of 46.5% on the boards of the Fortune 100. The boards of these companies remain marginally more diverse than those of the Fortune 500.
The Fortune 100 data shows a steep increase from 2020 to 2022 for the board seats held by African American/Black board members after periods of stagnation and losses in the prior years. African American/Black women gained twice as many seats as African American/Black men.
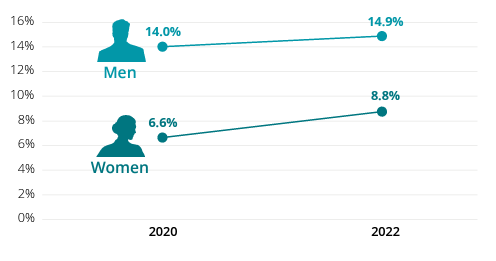
The increase in seats held by women from underrepresented racial and ethnic groups in the Fortune 100 from 2020 to 2022 (6.6% to 8.8%) is significantly higher than that of men from the same groups (14.0% to 14.9%).
In the Fortune 100, the percentage of board seats held by Asian/Pacific Islanders continued to steadily increase. While this progress continues, it is a minute amount in terms of the number of board seats—an increase of just nine seats since 2020. Asian/Pacific Islander women saw a growth of 23.5% board seats.
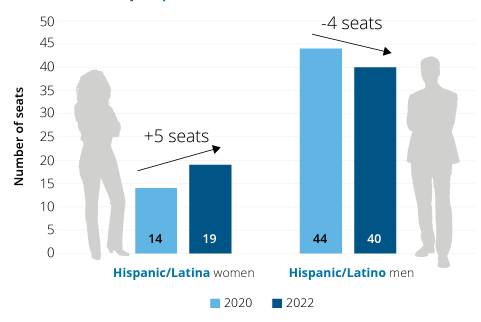
For the Fortune 100, the largest gain in seats in percentage terms between 2020 and 2022 was Hispanic/Latino(a) board members (45.5%, five seats). But this large percentage gain is due to a low starting number. The net gain for Hispanic/Latina women is compared to a net loss of four seats by Hispanic/Latino men.
Since the last iteration of the report two years ago, the data shows significant growth in the number of Fortune 100 companies with greater than 50.0% board members who are women and/or individuals from underrepresented racial and ethnic groups. In the past decade, the number of companies in this group has tripled.
Fortune 500 board seats held by individuals from underrepresented racial and ethnic groups increased to 22.2% in 2022, an improvement from 17.5% in 2020. But as we note in other sections of this edition of the Missing Pieces report, the level of representation in the Fortune 500 lags the Fortune 100.
Women from underrepresented racial and ethnic groups gained more board seats than White women (127 compared to 95 seats), and African American/Black women made significant gains in board seats since 2020, gaining 86 board seats, a 47.0% increase in seats. Asian/ Pacific Islander women gained slightly fewer seats this cycle than last (24 in 2022 compared to 28 in 2020) and saw a 27.0% increase. Hispanic/Latina women saw a 23.7% (14 seats) increase. White women also increased their share of seats by 7.7%, versus a decline of 10.5% for White men.
More than half of the Fortune 500 now have boards where more than 40.0% of seats are held by women and individuals from underrepresented racial and ethnic groups (53 companies have greater than 60.0% diversity). At present only four companies have boards where fewer than 10.0% of directors are White women and individuals from underrepresented racial and ethnic groups.
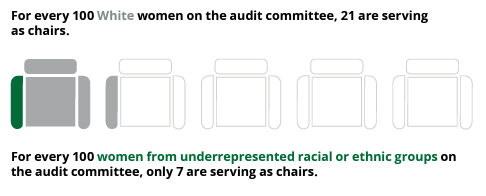
In terms of committee leadership in the Fortune 500, there are notable proportionality differences for women from underrepresented racial and ethnic groups versus White women for the audit committee. White women make up 27.3% of audit committee members and 26.5% of audit committee chairs, whereas women from underrepresented racial and ethnic groups make up only 8.5% of audit committee members and only 3.0% of audit committee chairs.
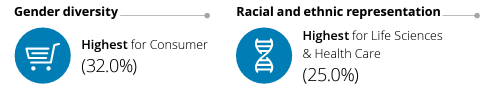
When looking at Fortune 500 board diversity across Deloitte’s five overarching industry categories, gender diversity was highest for Consumer (32.0%), and representation of individuals from underrepresented racial and ethnic groups was highest for Life Sciences & Health Care (25.0%).
Download the complete report here.
Endnotes
1The Bureau’s official projections use sophisticated cohort-component modeling to arrive at these figures. Population projections were last released in 2017. However, the model has been documented to have a high degree of accuracy and its 2020 projections largely reflected the final figures of the 2020 Census. At the time of publication, the last year for which population figures are available is 2060.(go back)
2Population figures are the Census Bureau American Community Survey 5-Year Average for 2017-2021, the 5-Year Average for 2018-2022 vintage were not available at time of publication. ACS figures are survey-based, and we use the 5-Year Average series because the methodology smooths out any survey sampling error. Total UR&EG population is the percentage of the total US population not classified as non-Hispanic White. Individually listed UR&EG demographics are the percentage of the US population classified as the indicated race, ethnicity, or gender.(go back)
3Population figures are based on the Census Bureau’s Population Projections data series. Board figures are based on a linear regression model of data from 2016, 2018, 2020, and 2022. Because earlier data show a slight dip in the total number of director seats, incorporating those years into linear modeling would create confounding results. Our estimates are simply a guide on how director representation might change if the current trend continues—but, of course, we know these trends will change.(go back)
4Equilar, “Gender Diversity Index (GDI) and Racial Diversity Index (RDI)” (Board Factbook, 2022).(go back)