Print
PrintJulie Daum is a Leader, North American Boards Practice, and Ann Yerger is a Corporate Governance Advisor at Spencer Stuart. This post is based on their Spencer Stuart memorandum. Related research from the Program on Corporate Governance includes Politics and Gender in the Executive Suite (discussed on the Forum here) by Alma Cohen, Moshe Hazan, and David Weiss; Will Nasdaq’s Diversity Rules Harm Investors? (discussed on the Forum here) by Jesse M. Fried; and Duty and Diversity (discussed on the Forum here) by Chris Brummer and Leo E. Strine, Jr.
Looking ahead: How are boards future-preparing themselves?
Today’s boards face an increasingly complex business environment, an intensifying regulatory environment and growing activism by investors and other stakeholders. In response, they are focusing on their own composition and taking a strategic approach to director appointments.
Here’s what the 2023 proxy statements, combined with our own 2023 survey of 141 nominating/governance committee chairs (“2023 survey”), reveal about forward-looking boards:
What’s top of mind for nominating/governance committee chairs?
56% say that board composition is their main focus in the coming years
Board composition is high on the agenda
- Nominating/governance committees are scrutinizing board composition, rethinking boardroom needs and planning for refreshment. They are looking again at board matrices — disclosed by 68% of S&P 500 boards — and ensuring that the matrix categories are defined, relevant and specific to their future strategies and risks.
38% say that financial expertise is their top recruitment priority
- According to our 2023 survey, board composition is the top focus area for nominating/governance committees in the coming years (56%), followed by CEO succession (52%) and ESG oversight (35% — down from the top position in last year’s survey).
- Boards are placing more emphasis on their composition and are enhancing their disclosures around the rationale for the mix of directors. Not only are they increasingly disclosing their board matrix, but some are also tackling the over-checked-matrix problem by limiting directors to a handful of top skills/qualifications. They are making sure that directors’ biographies are in sync with the board matrix and are relevant to the company’s strategies and the board’s needs.
25% are focusing on adding an active or retired CEO or COO
Financial expertise is now the top recruitment priority
- Financial expertise is the top recruitment priority (chosen by 38% of survey respondents).
- Our view is that this focus is less a reflection of boardroom gaps and more the result of natural turnover. It is now 20 years since the Sarbanes–Oxley Act of 2002 finalized the financial expert rules, and the second generation of financial experts are now rolling off boards.
About 20% are prioritizing recruitment of women and underrepresented minorities
CEOs are in demand
- Active and retired executives with CEO experience are in demand, with appointments returning to 2018 levels and reversing several years of decline. While 75% of survey respondents say they have enough CEO experience in the boardroom, 25% are focusing on adding an active or retired CEO or COO — the second highest recruitment priority, according to our survey.
- Our view is that with fewer CEOs serving as directors, boards today are increasingly interested in recruiting executives with current or very recent experience running a public company, or a similarly complex business unit.
Candidates with technology backgrounds are increasingly popular
- “Specialist” directors are not generally in high demand, but interest in directors with technology backgrounds is growing.
- Our 2023 survey reveals that boards are prioritizing the following technology-related skills for recruitment: technology (21%, down from 38% last year), digital (20%, up from 12% last year) and cyber (19%, up from 8% last year).
Diversity continues to be important
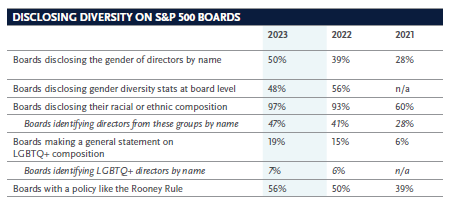
- Specific professional skills are driving director recruitment, but diversity of gender, race or ethnicity and LGBTQ+ remains a consideration for boards. Fifty-six percent of boards disclosed a Rooney Rule-type commitment to include diverse candidates in their searches.
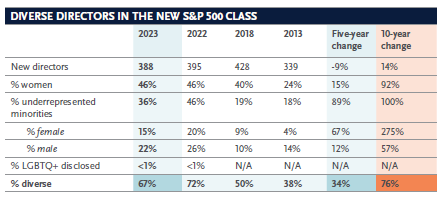
- Sixty-seven percent of this year’s class of new directors are diverse, defined by Nasdaq as directors who self-identify as female and/or underrepresented minorities (Black or African American, Hispanic or Latinx, Asian, Native American or Alaska Native, Native Hawaiian or Pacific Islander, or two or more races or ethnicities), and/or LGBTQ+.
- About 20% of respondents to our 2023 survey say their boards are prioritizing the recruitment of women and underrepresented minorities.
Class of 2023: The new S&P 500 directors
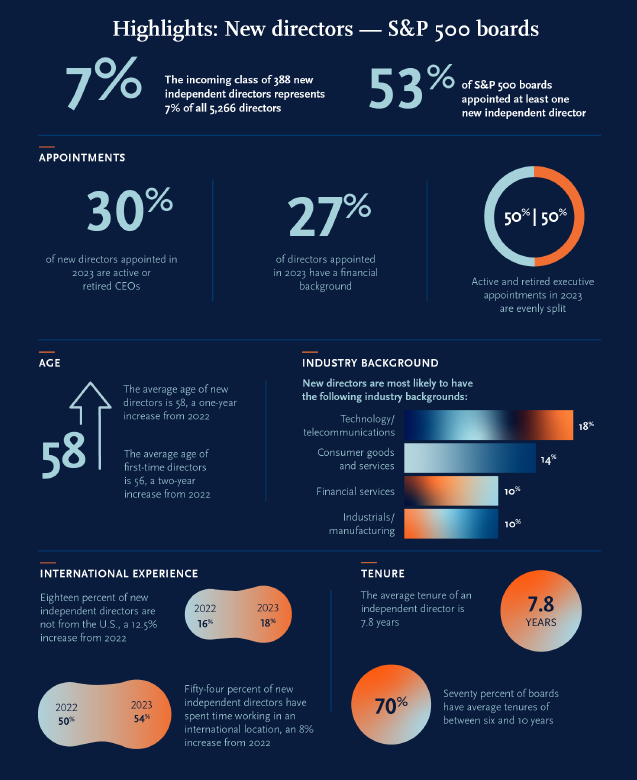
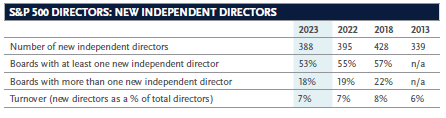
S&P 500 boards appointed 388 new independent directors this year, out of a total of 5,266.
More than half of S&P 500 boards (53%) appointed at least one new independent director, down from 2022 (55%) and from 2021’s particularly high level of activity when 59% of S&P 500 boards appointed at least one new director and 20% appointed more than one.
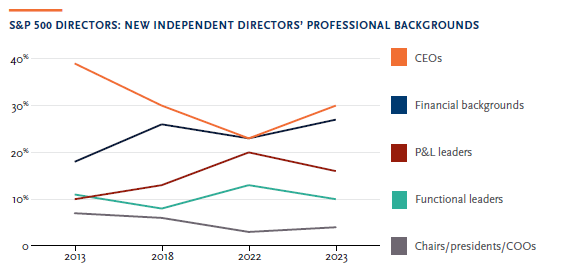
Financial expertise and CEOs are in demand
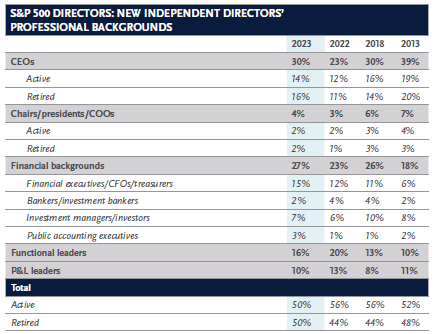
The 2023 data show changes in new directors’ professional backgrounds as S&P 500 boards seek top-level executive experience and financial expertise: boards appointed more CEOs, both active and retired, and more directors with financial backgrounds. Fewer functional and P&L leaders were appointed as directors.
Overall, the class of 2023 is split equally between directors who are actively employed and directors who are retired. This is in contrast with previous years, when active directors were in the majority.
The most common industry background for new directors is technology/telecommunications
The most common industry background for the class of 2023, as in 2022, is technology/ telecommunications, accounting for 68 appointments (18%). New directors also have backgrounds in consumer goods and services, accounting for 54 appointments (14%), industrials/manufacturing sectors (10%) and financial services (10%).
New directors are older on average than in previous years, and the proportion of next-generation directors has declined
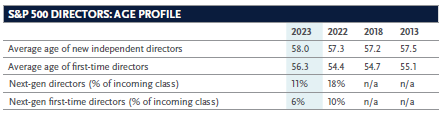
The average age of new directors is up from 57.3 years to 58 years. The average age of first-time directors has increased almost two years, from 54.4 to 56.3 years.
The proportion of next-gen new directors (those aged 50 or under) has dropped more than a third. They account for 11% of the incoming class of 2023, down from 18% in 2022.
New next-gen directors are most likely to have an investment background
A fifth (20%) of this year’s next-gen new directors have backgrounds in private equity/ investment management, up from 7% in 2022; 14% have backgrounds in technology/telecommunications, down from 31%; 11% have healthcare/ pharmaceuticals backgrounds; and 11% have industrials manufacturing backgrounds (both up from 8%).
First-time directors are more likely to be actively employed
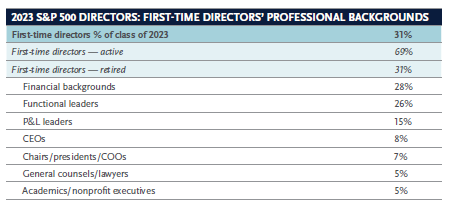
Thirty-one percent of the class of 2023 are first-time directors. Directors in this group are much more likely to be actively employed (69%) than retired. They are also much more likely to be actively employed than those who are not first-time directors (43%).
Among first-time directors, the most common professional background is financial: finance executives and CFOs, accounting executives, bankers and investors (28%).
Directors with global experience continue to be in demand
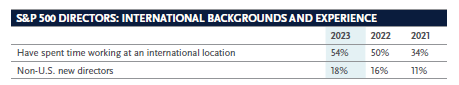
S&P 500 boards continue to strengthen their global outlook. Among new independent directors appointed in 2023, 54% have spent time working at an international location — a four-point increase from last year.
The number of new directors born outside the U.S. rose two points to 18%, more than double the level a decade ago.
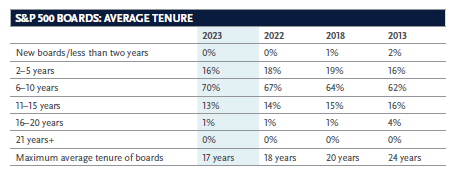
Average board tenure is 7.8 years
The average tenure of boards has remained unchanged from last year (7.8 years), but has decreased from 8.6 years in 2013.
Seventy percent of boards have an average tenure of six to 10 years, continuing the upward trend from 67% in 2022 and 63% in 2021. This is a 13% increase over the past decade and a 9% increase in the past five years.
In 2023, 69% of boards reported having a mandatory retirement policy — down one point from 2022. Fifty-seven percent of boards with age limits set the age of mandatory retirement at 75 years or older, compared with 53% in 2022. Across all S&P 500 boards the average retirement age was 74 years, which has remained unchanged for the past three years.
The number of independent directors who retired or left board service increased 4% from 2022. On average, these directors were 6.1 years within mandatory retirement, compared with 5.6 years in 2022. Thirty-eight percent of departing directors had served the board for less than 15 years, compared with 34% of departing directors in 2022.
The percentage of diverse new directors has declined
This year, 67% of new director appointments have been filled by diverse individuals. This is down from 72% in 2022 and 2021, but diverse directors still make up a significantly bigger share of new director appointments than in 2018 or 2013.
Nearly half of new directors are women
The percentage of new directors who are women remains the same as last year: 46% of appointments. This is a 92% increase in 10 years and 15% over the past five years. Seventy-eight boards (16%) expanded to add one or more women directors.
Among first-time directors, female directors make up 56% of appointments this year. This is up 12 points from 2022 and more than twice the level of a decade ago, when female directors were a quarter of first-time directors.
Female directors make up a slightly smaller share of underrepresented minorities among the class of 2023 than they did last year.
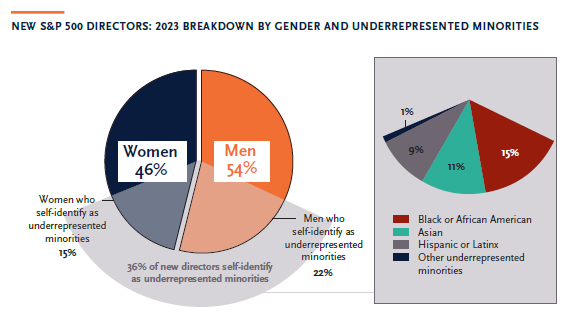
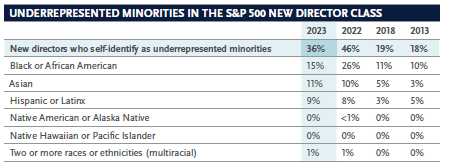
The percentage of new directors who self-identify as underrepresented minorities has dropped
In 2022 and 2021, nearly all of the gains in representation of underrepresented minorities among new directors were due to an increase in Black or African American directors. That increase has not been sustained: this year, Black or African American individuals make up 15% of new directors, less than half the level seen in 2021 (33%). The representation of Asian (11%) and Hispanic or Latinx directors (9%) each increased one point from last year. However, compared with 2013, the number of new directors who self-identify as underrepresented minorities has increased 100%.
Ten percent of boards expanded to add one or more directors who self-identify as underrepresented minorities.
Three-quarters of first-time directors are diverse
Of the first-time directors appointed this year, 75% are diverse. This is down from 2022 (82%) and 2021 (86%), but it does represent a significant shift over the longer term: up from 60% five years ago and 39% a decade ago.
Among first-time directors, female directors make up 56% of appointments this year. This is up 12 points from 2022 and more than twice the level of a decade ago, when female directors were a quarter of first-time directors.
Appointments of underrepresented minorities among first-time directors have dropped from 61% to 36%. However, they remain higher than prior levels (24% in 2018, for example).
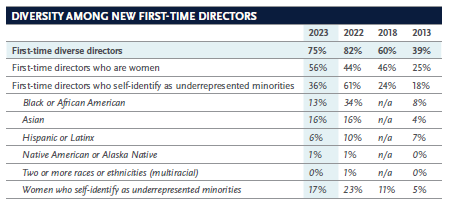
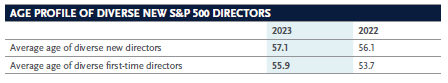
Diverse directors are younger
The average age of new diverse directors is 57.1, compared with 58.5 among those who are not diverse. Among first-time directors, diverse new directors are 55.9 on average, compared with 56.6 among non-diverse individuals. The average age of these directors is higher than in 2022, as with the average age of new directors overall.
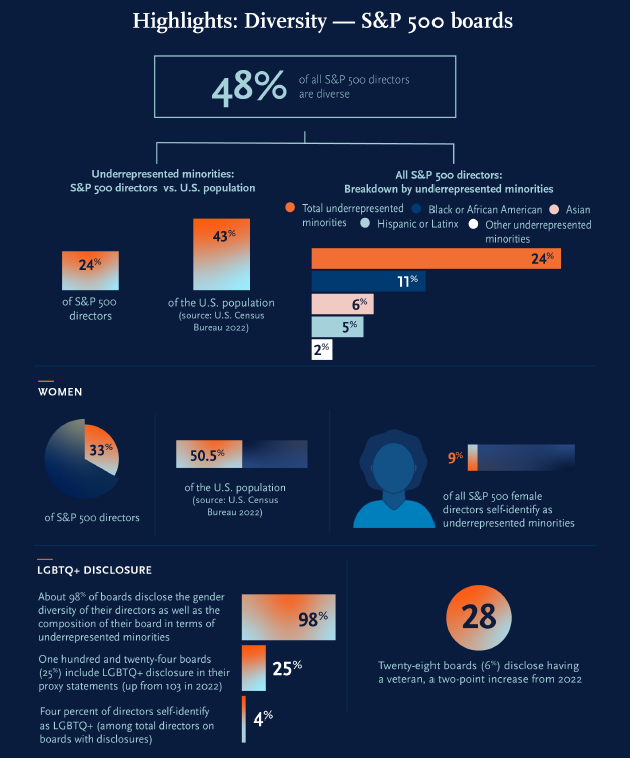
The diversity of S&P 500 boards continues to increase
The overall diversity of S&P 500 board composition has continued to shift incrementally, with low boardroom turnover impacting year-over-year change.
Some demographic groups on S&P 500 boards more closely reflect the broader U.S. population; others have a significant disparity in representation.
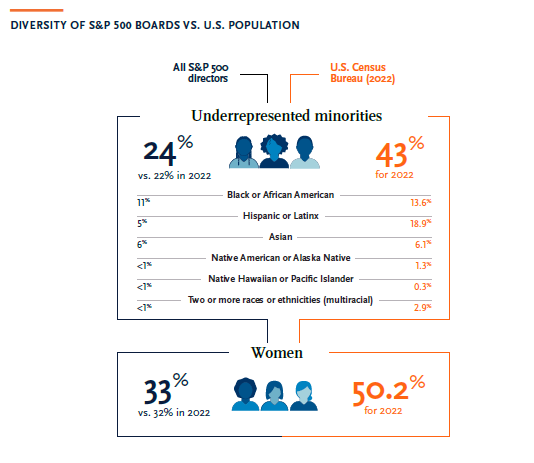
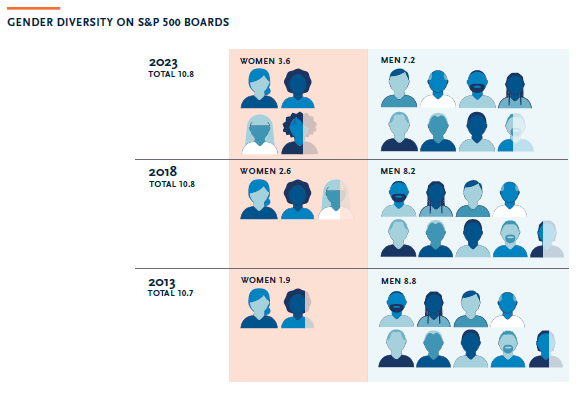
The percentage of women on S&P 500 boards continues to rise
Female directors now account for 33% of S&P 500 directors, up one point from last year. This is an 83% increase from a decade ago and a 38% increase from five years ago.
Boards today have 3.6 female directors on average, up from 3.4 last year and 1.9 in 2013; 99% of boards now have two or more female directors, compared with 66% a decade ago.

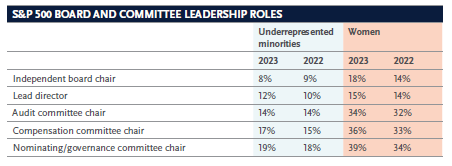
Board leadership is still lagging when it comes to diversity
Diversity in board leadership continues to climb, albeit less steeply compared with previous years.
In particular, the representation of women is marginally increasing on all counts. The same is true for the representation of underrepresented minorities in board leadership, which improved a few points from last year in all categories but one — only 8% of S&P 500 independent board chairs self-identify as underrepresented minorities, a decrease of one point from last year.
Boards are more transparent about diversity
Nearly all S&P 500 boards disclose their gender balance (98%) and composition relating to underrepresented minorities (97%).
More boards this year — 56%, up from 50% last year — report implementation of a policy like the Rooney Rule for candidate pools.