 Print
PrintMick Bain, Peter Buckland, and David D. Gammell are partners at Wilmer Cutler Pickering Hale and Dorr LLP. This post is based on a WilmerHale publication.
US Market Review and Outlook
Review
Following record levels of financing activity and proceeds in 2014 and 2015, the venture capital market cooled in 2016, with a decrease in the number of financings and a sharp contraction in valuations. Despite the decline in deal flow, however, the $52.4 billion invested in the US venture capital ecosystem still represented the third-highest annual total since 2000. Once all 2016 deals are accounted for, the number of 2016 venture capital financings should be commensurate with the 4,039 deals in 2013. VC-backed company liquidity activity was mixed in 2016, with the M&A market producing strong levels of acquisition activity and attractive valuations, while the IPO market declined for the second consecutive year to its lowest annual level since 2009.
Equity Financing Activity
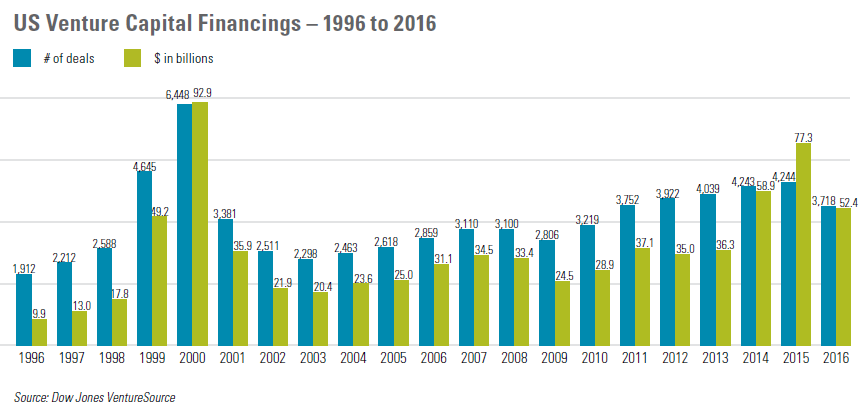
The number of reported venture capital financings declined by 12%, from 4,244 in 2015 to 3,718 in 2016. Even adjusting for the normal lag in deal reporting, deal flow appears to have slowed toward the end of the year, with the 862 deals in the fourth quarter representing the lowest quarterly tally since the first quarter of 2011.
Total reported venture capital financing proceeds contracted by almost one-third, from $77.3 billion in 2015 to $52.4 billion in 2016. Despite falling short of the total annual proceeds in 2014 and 2015, the 2016 figure is 52% higher than the annual average of $34.5 billion that prevailed for the three-year period preceding 2014.
The median size of all venture capital financings decreased 12%, from $5.8 million in 2015 to $5.0 million in 2016—but still tied with 2009 and 2014 as the second-highest level since 2008. The median size of first-round financings decreased 8%, from $3.25 million in 2015 to $3.0 million in 2016. The median size of second-round financings decreased by a wider margin, down 15%, from $7.3 million in 2015 to $6.2 million in 2016. Later-stage financings experienced the largest decline, their median size contracting by 28%, from $15.0 million in 2015 to $10.9 million in 2016. While the 2016 figure is also well shy of the $14.0 million figure for 2014, it is comparable to the $10.0 million annual median that prevailed between 2011 and 2013. In this light, 2016 should be regarded as a return to normalcy following a two-year period with elevated valuations.
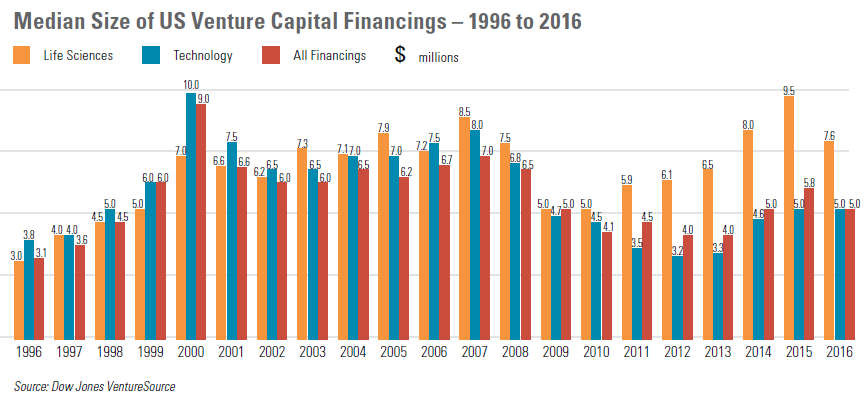
After increasing for five consecutive years, the median financing size for life sciences companies declined from $9.5 million in 2015 to $7.6 million in 2016. For technology companies, the median financing size remained steady at $5.0 million, still significantly lower than the typical annual median during the ten-year period preceding 2009. The general decline in the median financing size for technology companies in recent years is at least partly attributable to technological advances that have enabled startups to commence and grow their operations with a lower level of funding than historically required—in many cases, cloud computing and open-source software have replaced the need to purchase expensive server racks, hire support staff and acquire costly software licenses.
Between 2012 and 2015, the volume of very large financings increased dramatically, as venture-backed companies increasingly relied on IPO-sized later-stage rounds of financing—sometimes with the intention of eschewing the public markets entirely. The number of financing rounds of at least $50 million increased from 83 in 2012 to 112 in 2013, almost doubled to 209 in 2014, and then increased a further 35% to 283 in 2015. The number of financing rounds of at least $100 million increased from 19 in 2012 to 28 in 2013, more than doubled to 63 in 2014, and then leapt another 63% to 103 in 2015.
Through 2015, the increases in super-sized rounds were driven largely by private equity, crossover and hedge funds, which historically had avoided investments in private companies, but were attracted to pre-IPO companies that offered the potential for sizeable valuation increases and investment returns, especially when investors were able to negotiate ratchet provisions guaranteeing them a minimum return at the time of an IPO, typically in the form of additional shares if the offering priced below a set price. As these investors became wary of sky-high valuations, the number of financing rounds of at least $50 million declined by 37%, from 283 in 2015 to 177 in 2016, and the number of financing rounds of at least $100 million decreased by 58%, from 103 to 43.
There were a pair of billion-dollar financing rounds in 2016, down from six in 2015. This elite club was led—for the third year in a row—by Uber, with a $3.5 billion financing on top of its $2.1 billion and $1.0 billion financings in 2015. The other billion-dollar financing in 2016 came from Snap, with a $1.16 billion-dollar financing at a valuation of $17.8 billion that now looks to have been a solid investment, as the company went public in March with a $24 billion valuation.
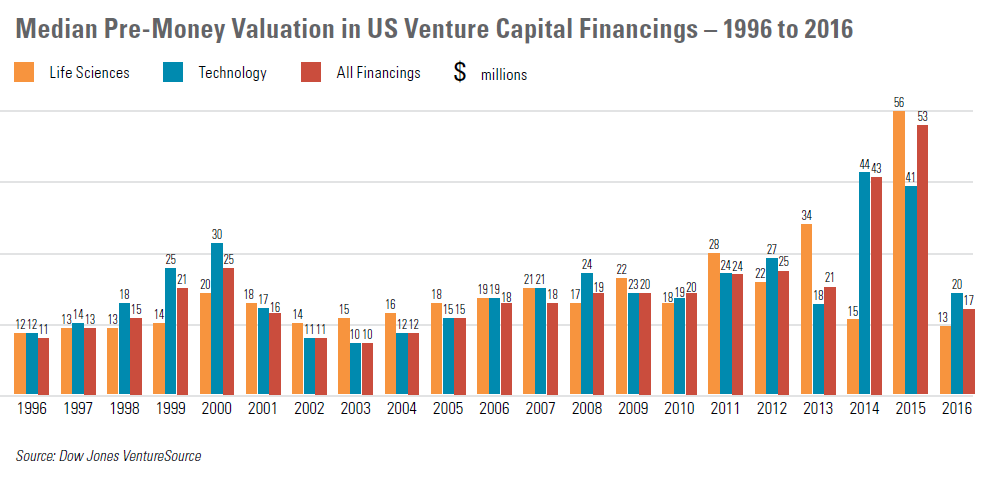
The median pre-money valuation among all venture financings in 2016 fell to its lowest level in ten years, declining by more than two-thirds, from $53.4 million in 2015 to $16.8 million in 2016. Both life sciences and technology companies experienced sharp decreases in valuations. The median pre-money valuation in the technology sector decreased 52%, from $41.3 million in 2015 to $20.0 million in 2016. Life sciences companies saw an even greater drop, with a median pre-money valuation that plunged by 76%, from a record high of $56.2 million in 2015 to $13.4 million.
While the 2016 figures are likely understated, the number of reported seed and first-round venture capital equity financings declined by 36% and 13%, respectively, between 2015 and 2016.
Seed and first-round financings accounted for 40% of all venture financings in 2016—down from 42% in 2015 and 45% in 2014. Proceeds from seed and first-round equity financings represented 17% of all venture capital financing proceeds in 2016, up from 13% in 2015 and 16% in 2014. The number of second-round and later-stage financings decreased by 12% and 10%, respectively, between 2015 and 2014. Proceeds from later-stage equity financings represented 17% of all venture capital financing proceeds in 2016, down from 63% in 2015.
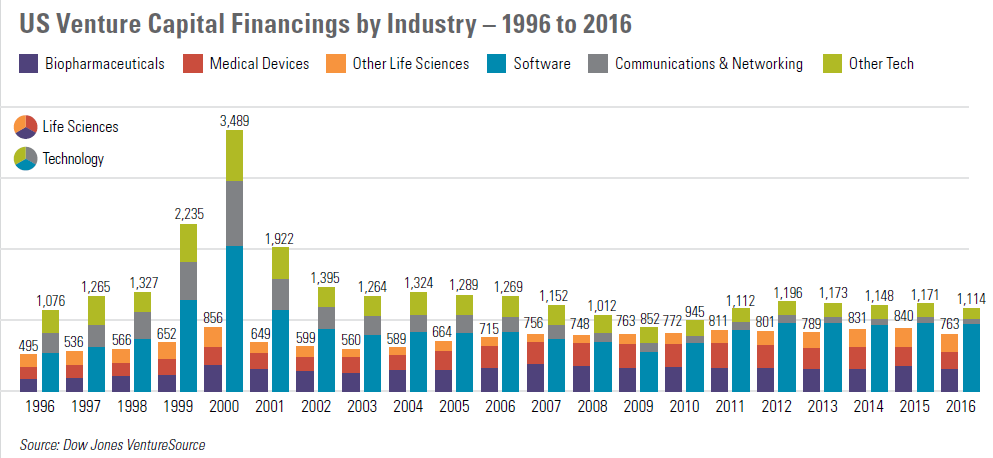
The technology sector accounted for 30% of the year’s transactions in 2016, up slightly from 28% in 2015. The business and financial services sector (which had supplanted the technology sector for the largest market share for the first time in 2014) saw its market share decline from 25% to 24%. The market share for life sciences companies increased for the third year in a row, from 20% in 2015 to 21% in 2016.
California—which has led the country in financing activity in each year since 1996—accounted for 41% of all venture financing transactions in (1,529 financings) and 52% of all proceeds ($27.3 billion). New York, home to companies with 442 financings raising $5.67 billion in 2016, finished second in deal flow for the fifth year in a row, just ahead of Massachusetts, which logged 281 financings raising $5.00 billion. Texas (with 142 financings raising $1.36 billion) and Washington (with 124 financings raising $1.26 billion) rounded out the top five positions for 2016.
Liquidity Activity
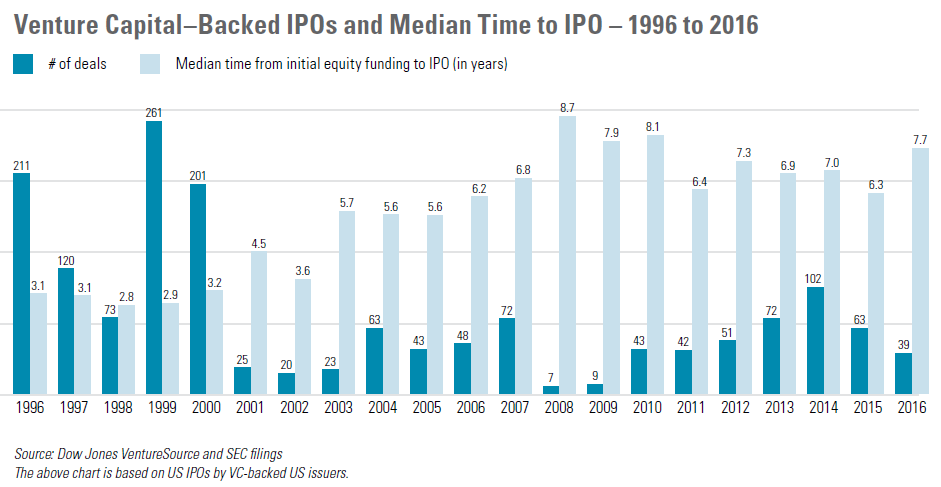
The number of venture-backed US issuer IPOs, which dropped from 102 in 2014 to 63 in 2015, declined for the second consecutive year, numbering only 39 in 2016—the lowest annual level since 2009. The largest VC-backed IPO of 2016 was the $237.9 million offering of Nutanix, followed by the IPOs of Cotiviti Holdings ($237.5 million), Twilio ($150.0 million) and Coupa Software ($133.2 million). The median amount of time from initial funding to an IPO increased from 6.3 years in 2015 to 7.7 years in 2016—the highest annual level since the 8.1-year median recorded in 2010.
In 2016, 60% of all VC-backed IPOs were by life sciences companies, down from 68% in 2015 and 62% in 2014, while the VC-backed IPO market share for technology companies increased to 36% in 2016 from 30% in 2015 and 34% in 2014—still well below the 60% market share that prevailed in the five-year period preceding 2014.
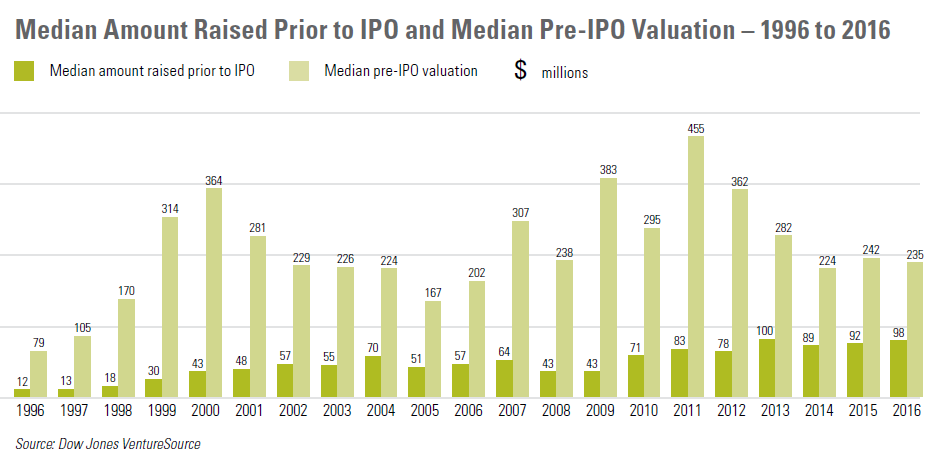
The median amount raised prior to an IPO increased for the second consecutive year, jumping 6%, from $92.1 million in 2015 to $97.9 million in 2016, while the median pre-IPO valuation decreased 3%, from $242.2 million to $234.7 million. As a result, the ratio of pre-IPO valuations to the median amount raised prior to an IPO by venture-backed companies going public decreased to 2.4:1, its lowest level in the last 20 years, down from 2.6:1 in 2015 (a lower ratio means poorer returns to pre-IPO investors). The ratio was between 3.2:1 and 5.5:1 for each year from 2001 to 2012, other than a spike to 9.0:1 in 2009 based on a very small sample size of VC-backed IPOs that year. In contrast, this ratio ranged from 7.5:1 to 10.0:1 from 1997 to 2000, due to very large pre-IPO valuations by younger companies.
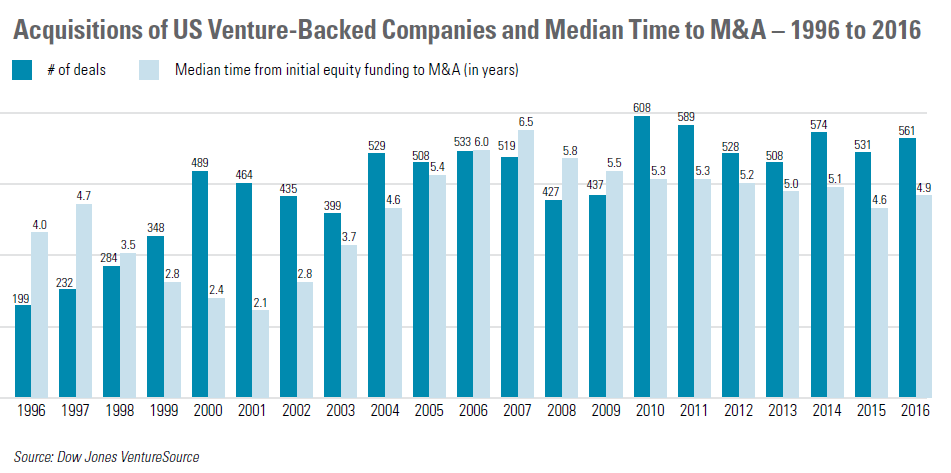
The number of reported acquisitions of VC-backed companies increased 6%, from 531 in 2015 to 561 in 2016, while total proceeds increased 42%, from $58.1 billion to $82.4 billion. This tally represents the third-highest annual level in 16 years, lagging behind only the $97.8 billion figure in 2000 at the height of the dot-com boom and the $88.5 billion figure in 2014. Once all 2016 acquisitions are accounted for, deal flow should further increase its margin over the 2015 result.
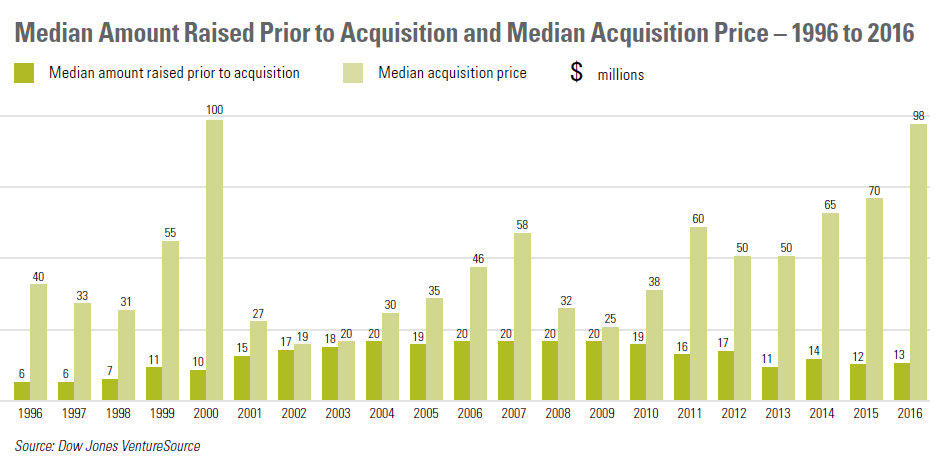
The median acquisition price for venture-backed companies increased 39%, from $70.0 million in 2015 to $97.5 million in 2016—the highest annual figure since the $100.0 million in 2000. The median amount of time from initial funding to acquisition increased to 4.9 years in 2016 from 4.6 years in 2015, but nonetheless represents the second-lowest annual figure since 2005.
The median amount raised prior to acquisition increased 4%, from $12.0 million in 2015 to $12.5 million in 2016. The ratio of median acquisition price to median amount raised prior to acquisition increased from 5.8:1 in 2015 to 7.8:1 in 2016 (a higher ratio means higher returns to pre-acquisition investors). This ratio in was the highest annual figure since the ratio of 10.0:1 in 2000 at the apex of the dot-com delirium. The increase in this ratio largely stems from significantly higher acquisition prices, coupled with historically low investment levels prior to acquisition.
There were a total of 16 VC-backed company acquisitions that fetched at least $500 million in 2016, down from 19 in 2015 and 23 in 2014 but well above the nine in 2013. The eight billion-dollar acquisitions of VC-backed companies in 2016 equaled the prior year’s tally, but fell one short of the 2014 total. The year’s largest VC-backed company deal was AbbVie’s acquisition of Stemcentrx for $5.8 billion.
The above comparison of the ratios of valuations to the financing amounts required to achieve liquidity events indicates that—for the fourth time since 2000, and for the fourth consecutive year—returns to venture capital investors in 2016 were higher in M&A transactions than in IPOs. Furthermore, venture investors generally achieve liquidity more rapidly in an M&A transaction (which frequently yields the bulk of the purchase price in cash at closing) than in an IPO (which generally involves a post-IPO lockup period of 180 days and market uncertainty on the timing and prices of subsequent sales).
When combined with 2016’s shorter timeline from initial funding to liquidity for M&A transactions (4.9 years) than IPOs (7.7 years), these data points underscore why venture capitalists often prefer a company sale to an IPO. The average 2016 VC-backed IPO did, however, gain 30% during the year, with 66% of IPO companies trading above their offering price at year-end.
Following on the heels of 2015’s increase in the ratio of M&A transactions to IPOs—which rose to 8.4:1 from 5.5:1 in 2014, reversing six years of consecutive declines—the ratio increased again, reaching 14.4:1 in 2016.
Outlook
Financing and liquidity activity in the venture capital market over the coming year will depend on a number of factors. After declining in 2016, the market continues to face the headwinds of a tepid IPO market, a slowdown in M&A activity and a pullback by crossover investors. At the same time, the large amount of capital raised by venture capital funds last year, combined with a resurgence in corporate venture investing, should mean that good companies—especially those with founders who have successful track records—continue to get funded.
- Financing Activity: Venture capital fundraising in 2016 was at its highest level in a decade, while investment activity declined. With sharp decreases in valuations, deal flow can be expected to pick up as prior concerns over excessive valuations dissipate. The anticipated uptick in financing activity is not yet evident in the first quarter of 2017, however, as macro factors continue to weigh on the market.
- IPOs: At the start of 2017, there are more than 150 “unicorns” (startup companies whose valuations exceed $1 billion), along with other companies that are qualified to pursue an IPO. Many of these companies have opted for the relative ease of private fundraising and chosen to remain private. Others are likely waiting for more favorable market conditions. The solid aftermarket performance of VC-backed IPO companies in 2016—on average, they gained 30 % from their offering price through year-end—is likely to generate demand for additional VC-backed IPOs in 2017. Snap’s very successful IPO in March 2017 may provide a further spark to the market.
- Acquisitions: Public companies’ balance sheets remain strong, and favorable interest rates can help strategic acquirers supplement organic growth through acquisitions. Nonetheless, the level of M&A activity in the coming year will depend in part on trends in private company valuations.
- Attractive Sectors: Companies offering products that leverage AI and machine learning, especially in the enterprise environment, should continue to attract funding in 2017. Other industries that should receive significant investment include agriculture and food, enterprise SAAS solutions, fintech, healthcare-related IT, robotics and security. Life sciences companies with compelling market opportunities—such as those in immuno-oncology and gene therapy— should also continue to appeal to investors. Investor focus on companies developing consumer-facing applications, especially in the digital media space, is likely to continue to decline.
Management Carve-Out Plans
Why Are These Plans Needed?
The uneven economy and choppy IPO market of recent years have created a challenging environment for venture capital-backed companies. Many of these companies are finding it takes longer than initially planned to generate revenue traction or to attain cash flow breakeven, causing them to raise more funding than originally anticipated and resulting in large liquidation preferences. Moreover, if a company must raise funds at a time when its business is not clicking on all cylinders, the result is often a “down round ”—a financing at a lower price than the previous financing round—which not only adds to the total liquidation preference, but also significantly dilutes the equity holdings of the management team, eroding the retention and incentive value of management equity plans.
One approach to address this situation is a so-called “management carve-out plan.” Such a plan provides that, upon an acquisition of the company, instead of allocating the purchase price among company stockholders strictly in the manner provided for in the corporate charter (which might result in little or none of the proceeds being allocated to common stockholders and option holders), a portion of the acquisition price is paid directly to plan participants, with the balance allocated in the manner the charter provides.
Basic Terms
A company that wishes to implement a management carve-out plan must address a number of often-complicated issues.
The first set of issues relates to participation in the plan:
- Who will be the participants—all employees, or only management?
- Are participants selected and economic interests in the plan allocated at the time the plan is implemented or at the time the company is sold? The former approach should be a more effective retention and recruiting tool since employees can be assured of some type of payoff upon a sale of the company, while the latter approach provides more flexibility to the board of directors to reward those employees who contribute the most to the company through the time of sale and can avoid some legal and tax complexities.
- Do plan participants’ interests vest over time?
- If participants in the plan are designated at the time of implementation, do they lose their participation rights if they leave the company prior to a sale? If so, what happens to the forfeited interests—do they automatically accrue pro rata to the benefit of the other participants, or is the total payoff to plan participants instead reduced?
The second group of issues involves the determination of the amount to be paid to plan participants:
- Is the payment a fixed amount or based on the sale price? Is there a cap on the amount paid under the plan?
- If the payment is based on the sale price, how is the sale price determined for this purpose? Is it the gross sale price or the net price after transaction expenses? How are earnouts and escrows accounted for? What about assumed or retained liabilities (including company taxes), or company wind-down expenses?
- Does the payment accrue from the first dollar, or apply only above a minimum sale price (to avoid rewarding employees for a sale at an unattractive price) and/or below a maximum sale price (because at a higher sale price the employee’s equity interest becomes valuable again and the carve-out plan is not necessary or the level of compensation due creates a barrier to the buyer’s retention efforts)?
- What is the payment timing? In an asset sale, what if the company needs to retain a portion of the sale proceeds for a period of time to satisfy contingent obligations?
- Is the payment made in cash, or in the form of the consideration (including stock) paid by the buyer?
- Is the amount payable to participants reduced by the value received for their equity interests in the acquisition of the company?
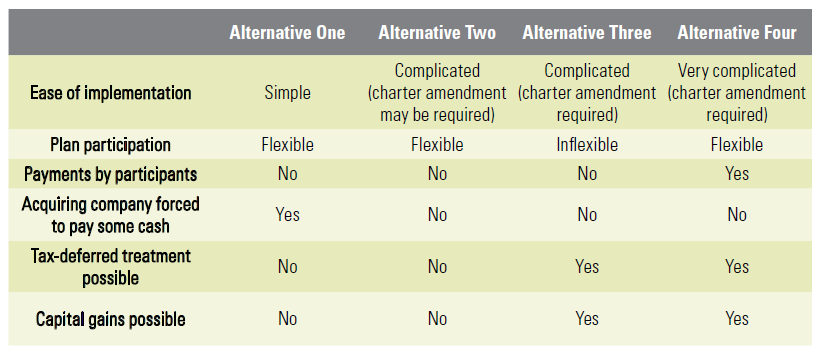
Possible Structures
Described below are four common structures for a management carve-out plan, and the principal advantages and disadvantages of each one.
Alternative One
Establish a cash bonus plan or enter into an agreement with individual employees providing for a cash payment upon an acquisition.
Primary advantages:
- It is simple to implement—stockholder approval is typically not required, and no new securities are issued.
- Participation in the plan can be limited to specific persons (such as key employees) and subject to certain conditions (such as remaining employed through the sale’s closing or beyond).
- It does not require any payments by plan participants.
Primary disadvantages:
- In effect, it forces the buyer to pay a portion of the acquisition price in cash (to fund the payments under the plan), even if the buyer wishes to use stock for the acquisition.
- The payments to plan participants are taxable as ordinary income, not capital gains.
Alternative Two
Establish a plan providing for the payment of a portion of the acquisition price to plan participants, often in the form of the consideration paid by the buyer.
Primary advantages:
- Participation in the plan can be limited to specific persons (such as key employees) and subject to certain conditions (such as remaining employed through the sale’s closing or beyond).
- It does not require any payments by plan participants.
- It does not force the buyer to pay a portion of the acquisition price in cash.
Primary disadvantages:
- This approach is harder to implement than alternative one. For example, it may require a charter amendment to provide that payments under the plan do not contravene the preferred stock liquidation preferences.
- The payments to plan participants are taxable at the time of receipt, even in a tax-free acquisition and even if the payments are in the form of stock that cannot be immediately sold.
- The payments under the plan are taxed as ordinary income, not capital gains.
Alternative Three
Amend the terms of the company’s charter to provide that a percentage of the proceeds of an acquisition is paid to the holders of common stock (and, possibly, option holders) on a pari passu basis with the payments to the holders of preferred stock in respect of their liquidation preferences.
Primary advantages:
- It does not require any additional payments by plan participants (typically holders of common stock and options).
- It does not force the buyer to pay a portion of the acquisition price in cash.
- If the acquisition is structured as tax-free, the plan participants will share in that benefit.
- In a taxable acquisition, the payments to plan participants would typically be treated as capital gains (rather than ordinary income), which would be long-term if the common stock has been held for more than one year.
Primary disadvantages:
- Payments are shared on a pro rata basis by all holders (including non-employees) of common stock and options and cannot be directed solely or disproportionately to contributing employees.
- Implementing this approach requires a charter amendment.
Alternative Four
Create and issue a new class of stock, the terms of which provide for the payment of a certain portion of the proceeds of an acquisition of the company to the holders of that class of stock.
Primary advantages:
- Participation in the plan can be limited to specific persons (such as key employees) and subject to certain conditions (such as remaining employed through the sale’s closing or beyond).
- It does not force the buyer to pay a portion of the acquisition price in cash.
- If the acquisition is structured as tax-free, the plan participants will share in that benefit.
- In a taxable acquisition, the payments to plan participants would typically be treated as capital gains (not ordinary income), which would be long-term if the new stock has been held for more than one year.
Primary disadvantages:
- It is complex to structure and implement.
- Plan participants must either pay for the new stock or incur taxable income upon receiving the stock if it is issued without consideration. Moreover, because the terms of this class of stock include a liquidation preference that effectively guarantees some payment upon an acquisition, the fair market value of this stock (which would either be paid by plan participants or recognized as taxable income) is generally not as low as the fair market value of ordinary common stock.
A company contemplating a management carve-out plan should carefully consider each of the four approaches to determine which is best suited for its particular needs.
Best Practices for Setting Option Exercise Prices in a Private Company
In order to avoid a violation of Section 409A of the Internal Revenue Code, an option must be granted with an exercise price that is at least equal to the fair market value of the underlying stock on the option grant date (generally, the date the option is approved by the company’s board of directors). If the board of directors determines the fair market value of the company’s stock underlying the option in a manner consistent with one of the safe harbor methods provided under Section 409A—typically, by obtaining an independent appraisal—the fair market value determination will be presumed to be reasonable by the IRS.
In the following Q&A, we describe certain rules under Section 409A related to stock options, and provide best practices for a private company setting option exercise prices in light of those rules.
Q1: What is Section 409A?
Section 409A applies to any compensation that is granted or earned in one tax year, but that could be paid in a later tax year. The Section 409A rules are drafted so broadly that, unless a specific exemption applies, all sorts of compensatory arrangements, including employment agreements, severance arrangements and equity awards, are caught in Section 409A’s net.
Q2: Does Section 409A apply to options?
Yes, unless the option qualifies for an exemption under the Section A rules.
Incentive stock options (ISOs) are exempt from Section 409A. However, in order to be a valid ISO, an option must, among other requirements imposed by the Internal Revenue Code, be granted with an exercise price equal to (or greater than) the fair market value of the underlying stock on the grant date. An option that doesn’t meet all ISO requirements is automatically treated as an nonstatutory stock option.
Non statutory stock options (also known as nonqualified stock options, or NSOs) may also be exempt from Section 409A, if, among other requirements, (1) the option exercise price is never less than the fair market value of the underlying stock on the option grant date and (2) the number of shares subject to the option is fixed on the date of grant.
Q3: So, regardless of whether an option is intended to be an ISO or an NSO, it must be granted with an exercise price equal to (or greater than) the fair market value of the underlying stock on the grant date, in order to be exempt from Section 409A?
Yes. Discounted options—options with an exercise price that is less than the fair market value of the underlying stock on the grant date—will always be subject to Section 409A. And if the option holder can choose, after any vesting requirements have been satisfied, when to exercise the discounted option, then the option will violate Section 409A.
Q4: What happens if an option violates Section 409A? That is, what if we grant a discounted option and allow the option holder to exercise any time during the term of the option once it is vested?
It’s not pretty. If an option is not exempt from or compliant with the rules under Section 409A, then Section 409A accelerates the taxation of the option to the time the option vests and imposes a 20% penalty tax on the income recognized at that time, in addition to all applicable regular federal and state taxes. (Note that some states, most notably California, impose their own, additional, 409A penalty tax as well.) In addition, any appreciation in the value of the stock after the vesting of the option is taxed annually at regular federal and state rates, plus a 20% penalty tax and special Section 409A interest charges, until the option is either exercised or expires. So, the option holder is required to pay taxes—lots of taxes—without having received marketable equity or cash. Set forth at the end of this section is an example of just how onerous this tax treatment is.
For more on how a non-409A exempt option could comply with Section A, see Q15 below.
Q5: Do all the adverse tax consequences of a Section 409A violation fall on the option holder?
For the most part, yes. Section 409A imposes the penalty taxes (and additional interest charges) on the option holder (even though he or she likely had nothing to do with how the exercise price of the grant was determined).
However, while the tax liability is imposed on the individual, the company must withhold the federal and state income taxes on the income recognized at vesting (but not the penalty tax or interest charges) and comply with certain reporting obligations.
In addition, Section 409A issues can become problematic for the company at the time of an acquisition or an IPO. Section 409A is very much on the radar of potential acquirors and due diligence in an acquisition routinely involves reviewing option grant practices, including how the exercise price was determined. Acquirors typically insist that sellers address any clear or potential Section 409A violations, including the setting of option exercise prices, through restructuring or cancellation of options or through special indemnification provisions or gross-ups for option holders. After all, acquirors are keenly focused on positive employee relations going forward. Knowing the correct fair market value is also necessary to properly determine and reflect accounting charges for options in the company’s financial statements. This becomes particularly important at the time of an IPO when the SEC reviews compensation charges taken for options granted in the period leading up to the IPO. While it is not required that the same fair market value of the stock be used for both tax purposes and accounting purposes, to the extent that the company’s accountants require the company to use a fair market value of the stock as of the grant date that is greater than the option exercise price, there would be a red flag for both taxing authorities and acquirors regarding the company’s option granting practices. For these reasons, it is very much in the company’s interest—as well as the option holder’s—to get the valuation right.
Q6: OK, we want our options to be exempt from Section 409A. Who establishes what “fair market value” is?
The company’s board of directors.
Q7: And what is the relevant date for determining what “fair market value” is?
To be exempt from Section 409A, the option must have an exercise price equal to the fair market value of the underlying common stock on the grant date, which is generally the date the company’s board of directors approves of the grant.
Q8: You said the grant date is “generally the date the company’s board of directors approves of the grant.” Can it be another date?
An option is considered granted when a duly authorized body (i.e., the board of directors, its compensation committee or an officer to whom the ability to grant options has been properly delegated) completes the last corporate action to effect the option grant, either via approving resolutions at a meeting or completing a unanimous written consent. The resolution or consent must include: (1) the name of the recipient of the option, (2) the number of shares of the company’s stock to be covered by the option, and (3) the option’s exercise price. Because this typically occurs on the date that the board of directors approves the grant of the options, we say that the grant date is the date the grant is approved by the board of directors.
Note, however, that when a unanimous written consent is used to approve option grants, the grant date is the date that the last consent is received by the company.
Q9: Does that mean vesting must also begin on the date the option is approved by the board of directors?
No. The date vesting begins can be any date and is unrelated to the determination of the option’s exercise price. For example, the vesting commencement date for a new hire option grant can be the employee’s date of hire even if the option is approved by the board weeks or months later.
In addition, the board may decide to accelerate the vesting of an option at any time, without any impact on how the option is treated for purposes of 409A.
Q10: How does the board of directors establish “fair market value”?
The regulations under Section 409A state that, for privately held companies, the fair market value of the stock underlying a stock option is the value determined by “the reasonable application of a reasonable valuation method.” Whether or not a valuation is reasonable is determined based on all the relevant facts and circumstances; however, the regulations stipulate that factors to be considered in a reasonable valuation method include:
- the value of tangible and intangible assets of the company;
- discounted cash flows;
- values of comparable companies;
- recent transactions in the stock;
- control premiums and discounts for lack of marketability; and
- whether the valuation is used for any other purpose that would have a material economic effect on the company, its stockholders or its creditors.
Essentially, all qualitative and quantitative factors bearing on valuation must be considered each time the valuation will be used to set the exercise price of an option.
Happily, the Section 409A regulations provide valuation safe harbors that are much less amorphous and that, if used, give any fair market value determination made by a company’s board of directors a presumption of reasonableness. This means that if the IRS were to challenge the fair market value determined by the board, the IRS would have to prove that the value was “grossly unreasonable.” (By contrast, if the board did not use a valuation safe harbor, then, if contested by the IRS, the company would bear the burden of proving that, based on all the facts and circumstances on the valuation date, the valuation was reasonable.)
Q11: What are the Section 409A valuation safe harbors?
The most commonly used valuation safe harbor allows a board of directors to base its fair market value determination on an independent valuation of the company’s stock performed by a qualified appraiser.
Such a valuation can be relied upon for up to 12 months from the valuation effective date (as opposed to the date the report is received by the company) unless its later use would be grossly unreasonable. No guidance yet exists on how to apply this standard. However, it is advisable to obtain a new valuation prior to the end of the 12-month period if the company achieves a significant milestone. In fact, if the company expects to complete an IPO in the next 12 to 18 months, quarterly valuation updates are generally appropriate.
A second valuation safe harbor allows the board of directors of a startup corporation (generally, a privately held corporation that has been in existence for less than 10 years) to base its fair market value determination on a valuation made reasonably and in good faith and evidenced by a written report that takes into account the same factors that an independent appraiser would consider, as set forth in Q10 above. This valuation can be done in-house but must be performed by someone who is qualified to perform the valuation because of his or her significant knowledge, experience (i.e., at least five years of relevant experience in business valuation or appraisal, financial accounting, investment banking, private equity, secured lending or comparable experience in the company’s line of business or industry), education or training. Nor will the safe harbor apply if the company “reasonably anticipates” as of the date of the valuation that it will have a change in control within 90 days of the valuation date or make a public offering of securities within 180 days of the valuation date.
Q12: Which safe harbor is best for us?
Ultimately that’s for the company’s board of directors to decide. If the board complies with the requirements of either safe harbor, the presumption of reasonableness will attach to its determination of fair market value. That said, most pre-funded companies do not have someone in-house with the required expertise to perform the start up corporation valuation in accordance with the requirements of the Section 409A regulations. And funded companies tend to prefer the convenience of hiring a third-party independent appraiser to conduct the valuation. Because of this, most companies rely on the independent valuation safe harbor.
Q13: How much does getting an independent appraiser to do a valuation cost and how long does it take?
Generally, a Section 409A valuation will cost between $3,000 and $10,000 and take about four to eight weeks to complete.
Q14: Can our board delegate to our CEO the authority to make option grants to our new hires based on a good Section 409A valuation determined at our board’s last meeting?
If there is a proper delegation of granting authority that is permitted by the equity plan and that complies with applicable state corporate law, your CEO may grant equity awards within the parameters of his or her authority. However, if the CEO is granting options, then he or she must make an assessment of the fair market value of the underlying stock on each option grant date. Reliance on the board’s previous determination of fair market value alone is not sufficient. Even if the CEO does make his or her own valuation determination, the risk is that the board may conclude at the next board meeting that there has been an increase in the fair market value of the company’s stock. This would throw into question whether the option granted by the CEO has a fair market value exercise price. If it is determined that the increase in stock price occurred before the CEO granted the option, then the option would violate Section 409A. Instead, best practice would be to have the board of directors approve all hire grants to all employees who started with the company since the date of the last board meeting. The vesting period, as described in Q9, can still be tied back to the option holder’s first day of employment or service (or an earlier date, as applicable).
Q15: Is there any way to grant a discounted option that does not create a Section 409A violation?
Yes, but such options are very unusual. To avoid a violation of Section 409A, a discounted option must comply with strict Section 409A rules relating to how and when the option can be exercised.
This compliance eliminates the option holder’s ability to choose when to exercise his or her option and, as such, is a much less attractive (and, consequently, less effective) form of compensation.
Section 409A–compliant options may only be exercised upon any one of six permitted events (in each case, as defined under Section 409A) that are selected at the time of grant: separation from service, death, disability, an unforeseeable emergency, a change in control, or a specified time or on a fixed schedule. Once a Section 409A–compliant option has been granted and the exercise events selected, it cannot be amended and the exercise date cannot be accelerated or deferred, except in very limited circumstances.
Q16: This is all about options. Do the same rules apply to awards of restricted stock?
No. Awards of restricted stock are not subject to Section 409A.
Example of Tax Treatment of Non-Section 409a-Compliant Option Grant
Assume an option to purchase 100,000 shares of common stock with a fair market value of $1.00 per share is granted to an employee on December 31, 2016 with an exercise price of $0.50 per share. The option vests in four equal installments on each December 31 thereafter until the option is fully vested on December 31, 2020. The fair market value of the underlying stock is $1.10 on December 31, $1.20 on December 31, 2018, $1.50 on December 31, 2019, and $2.00 on December 31, 2020.*
Based on this fact pattern, the option holder must include amounts in income each year as his or her option vests and pay additional penalty taxes on those amounts.

By contrast, if the option described above had been an NSO granted with an exercise price of $1.00 per share, there would be no income on each vesting date. Instead, assuming the NSO was exercised on December 31, the option holder would have income equal to $150,000 which would be subject to tax at an effective rate of 45% such that the option holder would pay only $67,500 in taxes.
*For purposes of this example, we have assumed that the stock price steadily increases over time. The Section 409A rules that address what happens when the fair market value of stock underlying an option that violates Section 409A fluctuates or subsequently decreases are particularly complex. However, it is worth noting that under those rules, a holder may not be made completely whole in situations where Section 409A requires income inclusion for amounts that are ultimately never received by the option holder.
Securing Your Series A Round in 2017: Five Things to Do Now
A total of $8.57 billion was invested across 1,299 Series A investments in the United States in 2016, according to VentureSource. The amount invested in Series A rounds has been trending upwards over the last few years. Despite this upswing in proceeds, however, the total number of Series A deals is on the decline. The last quarter of 2016 saw the lowest number of Series A deals since the first quarter of 2011. Fewer companies are successfully raising Series A rounds, but those that do are raising more money.
If you are planning to raise money in 2017, here are five things you should start doing now to improve your chances of success.
Build and Leverage Your Network
Successful founders need to surround themselves with smart people who understand their industry and its challenges, and can offer the right guidance. These people add credibility to the company and the founding team, and can introduce you to investors and influencers. If you haven’t been able to find well-connected, experienced advisors, you need to do so now.
Accelerators and incubators are generally very good at providing access to a network of mentors and investors. Social media—Linkedin, Twitter and Facebook—has made it easier than ever for founders to directly engage with investors and key thought leaders. Another great way to grow your network is to attend startup-focused networking events.
As you build your network, you shouldn’t only be focused on connecting with investors. It’s also important to build relationships with other founders who have successfully raised money. Their experience can be invaluable in helping you decide which investors to target, and in identifying mistakes and potential pitfalls.
Know Your Metrics
One of the key factors investors will consider is whether founders are focused on achieving the right metrics for their business. It is easy to get carried away pursuing vanity metrics, but doing so while ignoring the “right” metrics can make or break your company. Look at comparable companies and plumb your network for insight on metrics.
Align With Co-Founders
One of the most common reasons companies fail is a falling out among co-founders. Before you decide to raise funds, make sure you see eye-to-eye with your cofounders on the key issues that can derail a promising venture. What is each founder’s long-term vision for the company? What does giving up control mean for the future of the company, the founders and their roles in the company? These are just some of the questions you need to discuss.
Acknowledge and Plan for Risks
Founders tend to be wildly optimistic when starting a company, but their aspirations should be grounded in reality. At each stage of development, founders must thoughtfully identify the top risks facing the future growth of their companies and implement strategies to mitigate them, be they market, product or regulatory risks. A founder who can inspire confidence in his or her company’s ability to identify and tackle short-and long-term risks is more likely to raise funding from institutional investors.
Get Market and Customer Validation
Although seed and even pre-seed money is more readily available to startups today than in past years, the bar for a Series A round is now higher than ever before. A few years ago a pre-product company may have been able to raise a Series A round, but that is less likely today. A company should not only have a built-out product, but also proof that the product is, or at least has the potential to be, widely adopted by the market. Founders who have validated the fact that their products address a genuine need in the marketplace, have tested their go-to-market strategies, and have some proof that their strategies will work are the most likely to successfully raise a Series A round.
Seeing Eye-To-Eye with Your Co-Founders
Before taking money, entrepreneurs need to be forthright about where they stand on the key issues that can derail a promising venture and devastate a partnership. Work through these questions with your co-founders, and you’ll not only understand one another better, but you’ll also be more likely to succeed together.
- When do we sell? Founders rightly focus on developing their enterprise, not preparing to let it go, so they often don’t discuss when they’d be willing to sell. Put it out there. Level with your partners: Are we willing to sell at $50 million? How about $100 million? Ever? It’s never too late to ask this question. You should revisit it every time you think about raising capital, and as your business evolves.
- Does anyone want out now? If you suspect that a co-founder’s interest has waned or vanished over the past few months, talk it through. A round of funding can catapult your business to the next level—but it usually adds years to the probable exit horizon, which can make an already discontented partner feel trapped and even unhappier. Don’t assume that everyone’s ambitions and dreams are unchanging.
- Are we willing to give up some control? When you launch a business, it’s all yours. When you take investors’ dollars, you’re giving them a measure of control of your operations and strategy. Unfortunately, founders often don’t have much leverage in negotiating those terms because those with the gold usually make the rules. That’s a bitter pill for some entrepreneurs to swallow, especially when they’ve toiled so long on a venture. Remember that future rounds rarely become less onerous.
- Are we getting the best partner for our needs? A round of investment typically fuels a wave of growth. Perhaps you and your co-founders would benefit from some outside help as you scale the business during this cycle of rapid expansion. If you think you’ll need support—and most of us do—make sure your investor is willing and capable of providing it.
Trends in VC-Backed Company M&A Deal Terms
We reviewed all merger transactions between 2009 and 2016 involving venture-backed targets (as reported in Dow Jones VentureSource) in which the merger documentation was publicly available and the deal value was $25 million or more. Based on this review, we have compiled the following deal data:
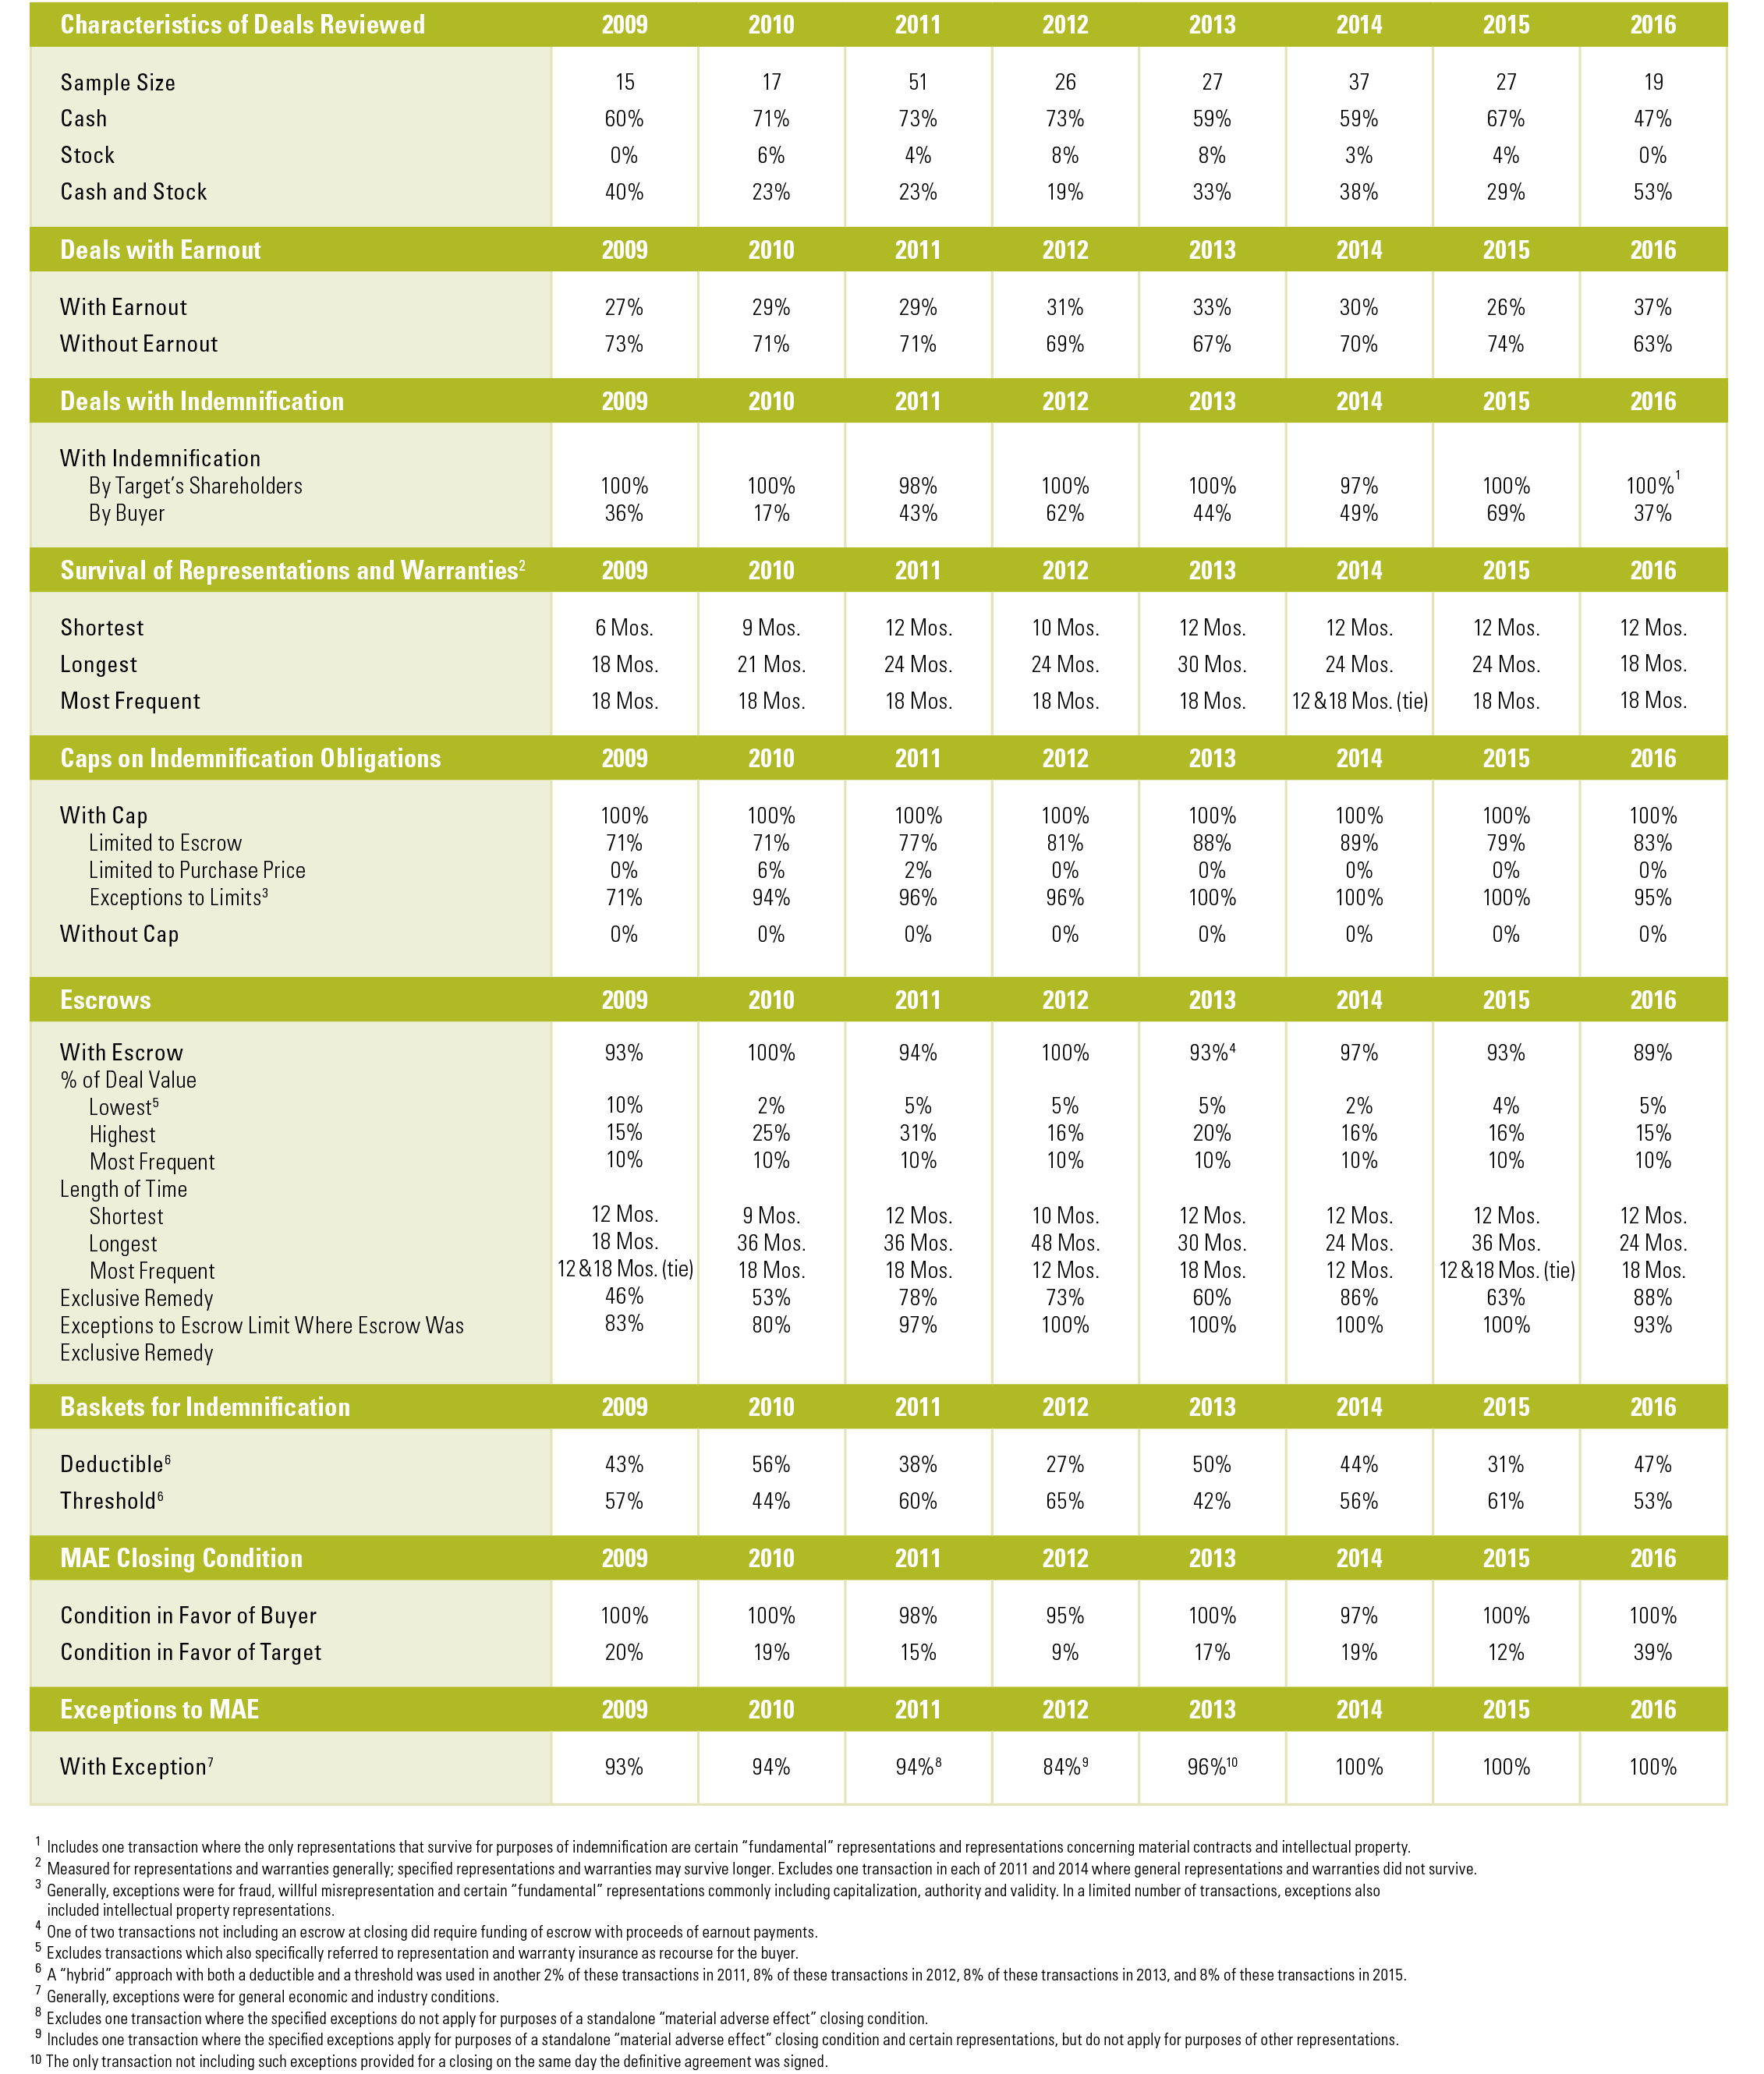
The complete publication is available here.
