 Print
PrintAubrey E. Bout is Managing Partner and Blaine Martin is a Consultant at Pay Governance LLC. This post is based on a Pay Governance publication by Mr. Bout, Mr. Martin, Perla Cruz, Bryce Gerboc, and Phil Johnson. Related research from the Program on Corporate Governance about CEO pay includes Paying for Long-Term Performance (discussed on the Forum here) and the book Pay without Performance: The Unfulfilled Promise of Executive Compensation, both by Lucian Bebchuk and Jesse Fried.
With the introduction of say-on-pay (SOP) in 2011 and the increased clout of proxy advisory firms on executive compensation program designs, the performance share unit (PSU) has become a common feature of executive long-term incentive (LTI) programs among U.S. public companies.
PSUs at many companies have now been in place for ≥10 years, which provides an opportunity to thoroughly review the historical trend in PSU payouts in order to assess critical questions regarding program success:
- What has been the historical payout trend in PSU awards over the 10 most recently completed performance cycles (2005-2014 grants)?
- How did the payouts for PSU awards that included relative total shareholder return (TSR) metrics compare to that of plans based entirely on operating financial results?
- Were PSU payout trends aligned with company TSR performance over the 3-year performance period?
This post provides a historical analysis of trends in PSU award results. With hindsight, we can objectively assess the success of this relatively modern LTI element that has become increasingly important in executive compensation programs since 2011.
Key Takeaways
- PSU plan payouts in aggregate were aligned with company total shareholder return (TSR): plans paying out above target showed significantly higher TSR than plans paying out below target during the same period.
- There is no one-size-fits-all approach to pay-for-performance: PSU plans using both operating metrics and relative TSR metrics show strong alignment with TSR over the contemporaneous period.
- We found that PSU payouts for plans implemented in and after the first year of say-on-pay (SOP) had higher payouts than plans before SOP, but this trend is likely influenced by broad stock market trends independent of SOP.
- PSU plans based entirely on operating metrics had median plan payouts at or below plans that included Relative TSR metrics in 7 of 10 years reviewed. This finding suggests that Compensation Committees closely scrutinize goal setting when using operating metrics in PSU plans, which rebuts arguments that companies commonly set easy operating financial goals to get above-target payouts.
Background
The past 10 years have brought significant changes in executive compensation governance at large public companies in the United States. A Compensation Committee member who retired from Board service in 2005 would perhaps be surprised by the significant increases in transparency and investor influence over executive compensation programs, including the increased disclosure of the compensation process and rationale in the Compensation Discussion and Analysis beginning in 2007, the introduction of the advisory SOP vote in 2011, the increased clout of proxy advisory firms advising institutional investors on SOP voting, and the increasing prevalence of activist investors influencing executive compensation programs.
One concrete way in which these trends have influenced executive pay program design has been the introduction of PSU plans as a significant component of LTI grant value for U.S. executives (from 50% prevalence in 2009 to 87% prevalence in 2016 among S&P 500 companies).1 While PSU plans were already relatively common in 2005, the increased focus by proxy advisors on “performance-based pay,” and the exclusion of stock options from this category by proxy advisors, led to the widespread adoption of PSU programs at large companies. Due largely to the focus by some proxy advisors on providing ≥50% of LTI value using PSUs, the average mix of LTI delivered to public company CEOs as PSUs is now 55%. [1]
In addition to focusing on the LTI mix provided in PSUs, proxy advisors are increasingly focused on the metrics and rigor of PSU programs’ performance goals. Due to this influence, many companies use PSU programs based on relative TSR in addition to—or instead of—operational metrics. Proxy advisors now scrutinize PSU payout schedules for rigor: companies are often criticized for (i) programs that could pay near target payouts for lackluster performance or (ii) goals below prior year results or with a consistent history of above-target payouts.
1) A 10-Year Review of PSU Payouts
We reviewed the payout history for 40 of the largest U.S. public companies that have been granting PSUs to their CEOs for the majority of the past 10 years. While PSU prevalence and weighting increased after SOP in 2011, most of these companies granted PSUs in each of the 10 cycles we reviewed for our study.
Table 1 below shows that payouts for performance periods beginning around or after the introduction of SOP in 2011 had higher payouts than those granted beforehand (113% of target post-SOP versus 106% of target pre-SOP). This trend is not surprising, since 2005-2010 year grants would include performance periods that concluded during the midst of the global financial crisis, and payouts occurring since 2011 would include payouts occurring during the recent record-high bull market. Due to these factors, we cannot make definitive conclusions regarding SOP’s effect on dampening PSU payouts.
| Plans With or Without TSR Metrics | Median PSU Payout (As % of Target) | ||
|---|---|---|---|
| 2005-2014 Grants | 2005-2010 Grants | 2011-2014 Grants | |
| All Plans | 108% | 106% | 113% |
| Plans with TSR Metrics | 110% | 107% | 113% |
| Plan Without TSR Metrics (Operating Metrics Only) | 106% | 102% | 111% |
2) Comparing Plans With Relative TSR to Plans Without Relative TSR Metrics
Plans that included relative TSRs had higher median payouts than plans based exclusively on operating metrics. While critiques of PSU plans based on financial metrics often argue that participants get higher payouts because goals are set too low, the data presented in Table 1 shows that plans based on operating metrics paid out at lower levels than relative TSR plans. This finding illustrates the care that Compensation Committees place on setting rigorous performance goals.
We also reviewed the time series of median payouts by each year for the 10 grant years included in our study. We show overall plans as well as separate statistics for plans that include TSR or plans based solely on operating financial metrics:
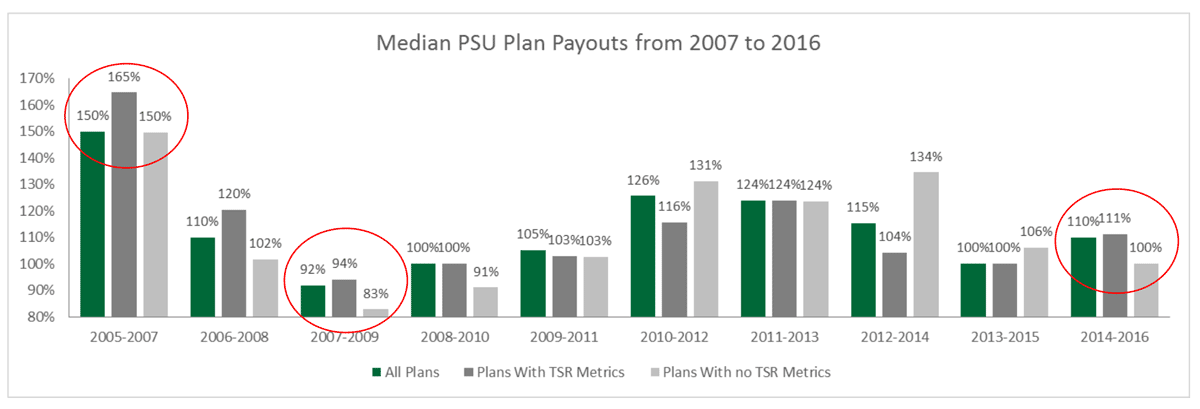
The time series suggests that PSU plan payouts do follow the broader stock market’s vagaries: payouts as a percentage of target were at their highest during the market boom culminating in 2007, at their lowest after the global financial crisis in 2009, and aligned directionally with shareholder experience.
A comparison of TSR and non-TSR plans shows that non-TSR plans had median payouts at or below TSR plan median payouts in 7 of the 10 cycles we reviewed. Again, this finding suggests that the operating financial goals set by Compensation Committees are robust and perhaps that the relative nature of TSR plans provides some downside protection, since competitor stock performance may also suffer in periods of challenging operating or stock performance.
3) Comparing PSU Payouts to Shareholder Value Creation (i.e., TSR)
A major feature of PSU plans is that award payouts leverage above or below target based on performance against the chosen performance metrics, but how do these payouts compare with firm TSR performance over the same period? We examined the relationship between these variables in Table 2.
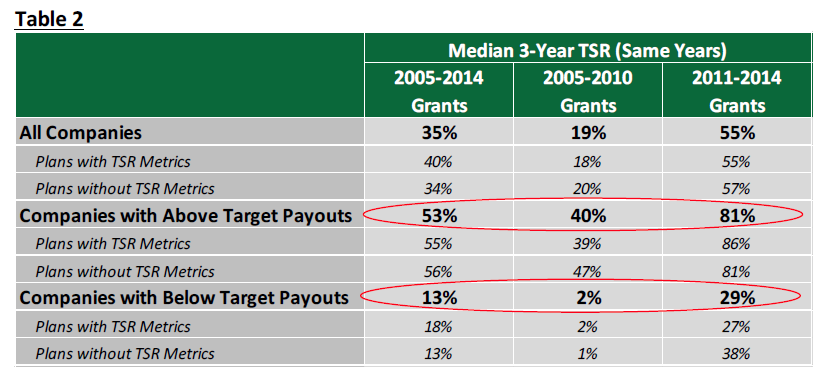
For both the pre-SOP (2005-2010 grants) and post-SOP (2011-2014 grants) periods, TSR was significantly higher for companies with above-target PSU payouts than for those with below-target PSU payouts. For the 2005-2010 periods, companies with above-target payouts had cumulative 3-year TSR of 40% versus 2% for companies with below-target payouts. Similarly, companies with above-target payouts for 2011-2014 PSU grants had cumulative TSR of 81% versus 29% for those companies with below-target payouts. These performance findings suggest that, in aggregate, TSR and PSU payouts are correlated. Further, this relationship holds for plans regardless of whether they include TSR as a performance metric. While there may be few individual outlier companies with misaligned results for shareholders and PSU plan participants, our data show that shareholders generally enjoyed better company performance within the companies that performed above-target on their PSU plan payouts. This broad alignment lends strong support for the performance orientation of PSU programs.
Conclusions
The results of this study suggest that PSU plans have been adopted by companies for good reason: they create broad pay-for-performance (P4P) alignment between plan participants and company shareholders. Aggregate plan payouts range widely in the time series observed, generally tracking stock market performance over the past 10-year period. Most importantly, plan payouts overall are strongly correlated with company TSR performance. Our study suggests that PSU plans without Relative TSR metrics often pay out at slightly lower levels than plans with these metrics. This suggests that Compensation Committees closely scrutinize the setting of performance goals when operational metrics are part of PSU awards.
Our findings confirm our belief that there is no one-size-fits-all approach to P4P, particularly concerning performance metric selection. Both operating financial metrics and relative TSR metrics are observed to provide strong alignment between PSU participant payouts and shareholder value.
Methodology
Our analysis of PSU payouts is based on a sample of 40 S&P 500 companies that have granted performance share or unit awards consistently over the majority of the past 10 years. This sample represents the largest S&P 500 companies consistently granting PSUs since 2005. Payouts were hand collected based on proxy disclosure of plan payouts in the Compensation Discussion and Analysis at the end of the performance period. We analyzed PSU payouts granted in 2005 (generally 2005-2007 performance cycles) through 2014 (generally 2014-2016 performance cycles) and compared them to TSR for the contemporaneous 3-year period aligning with the performance cycle.
Endnotes
1Pay Governance research based on data provided using IBM’s Kenexa database.(go back)
